Load Testing for I-Girder type Bridge to Identify Serviceability, Load-carrying Capacity and Dynamic Response
←
→
Page content transcription
If your browser does not render page correctly, please read the page content below

ISSN: 0974-5823 Vol. 7 No. 1 January, 2022

 International Journal of Mechanical Engineering

 Load Testing for I-Girder type Bridge to Identify
 Serviceability, Load-carrying Capacity and Dynamic
 Response
 Mustafa Khalid Rzaij Al-Nasar and Faiq Mohammed Sarhan Al-Zwainy

 University of Al-Nahrain

Abstract - Most countries are facing several challenges and difficulties when it comes to managing deteriorating structures
and evaluating the structure's remaining service life. One of the most essential things gaining speed the deterioration process
is the shortage of regulations and rules controlling traffic. A Structure Health Monitoring system aims to accurately and
effectively monitor a structure's behaviour identify damage or deterioration. It was chosen one of the bridges in the Republic
of Iraq that were subjected to overloading and unusual traffic for this study to determine the bridge's overall performance
and response to these loads. for the first time in Iraq, it was developed a structural health monitoring system for the Al-
Shuhadah Bridge. Many sensors are connected to the data acquisition device, including LVDT, strain gauges and
accelerometers distributed across the spans. The bridge was then subjected to a load test. The deflections, distribution
factors, neutral axis position, curvatures modal, load rating, and bridge dynamic behaviour were extracted, and it was
discovered that all of these indices values are reported to be lower than AASHTO specifications, with no unnatural
conditions observed.
Index Terms – Structural Health Monitoring, Bridge, Concrete Bridge, Steel Bridge, Load Testing, Distribution Factor,
Load Rating, Dynamic Response.

Introduction

Many of the challenges and difficulties faced by most developing as well as developed countries equivalent concerning their
deteriorating structures are recognized. It is important to invest in the maintenance of existing structures, which have been identified
as dilapidated and in need of restoration, as much as investment in the building of new structures constantly. This is particularly
evident in developing countries like Iraq. Iraq and its decision-makers lack a culture of maintenance, which leads to high costs in
the issue of failure or significant deterioration, which leads to total replacement. In this context, monitoring and evaluation
techniques can significantly improve future decision-making.

Bridge load testing is frequently used to identify problems that are just not easily rectified by visual inspection. To resolve difficulties
with a bridge or a group of bridges, visual inspection, load testing, structural health monitoring (SHM), non-destructive testing
(NDT), and finite element (FE)-based structural modelling are mostly used. AASHTO-MBE[1, 25], for example, proposes load
testing for determining the structural condition. The load test aims may differ from case to case, and such a test may be required on
a specific bridge or a group of comparable bridges in order to make recommendations about bridge closure, load posting,
replacement, and retrofit.

Various research papers in a similar field are studied and referred for this study. The researchers [2-5] explained and presented an
overview of the bridge's behaviour under typical loads and the validity of these bridges to carry such loads in these investigations,
which evaluated the health situation of I-girder bridges. A load test was performed [3] on one of the bridges with steel girders to
extract the bridge's characteristics, and it was discovered that the bridge is appropriate for long-term operation. One of the papers
[5] looked at an old bridge to see whether it could be used to extract fatigue and determine its remaining service life.

 Copyrights @Kalahari Journals Vol. 7 No. 1(January, 2022)
 International Journal of Mechanical Engineering
 833
The researchers, on the other hand, provided novel techniques and approaches for using bridge health monitoring. Many articles [6-
8] utilise deep learning technology to train a computer to assess the location and severity of damage by inputting experimental data.
Deep learning technology combines artificial intelligence and machine learning to determine the location and severity of damage
by entering experimental data. The Fuzzy Krill Herd [8], Artificial Neural Networks (ANN) [6], and Convolutional Neural Networks
(CNN) [7] were all discussed. The machine's technology demonstrated the relevance and capability of detecting damage, and it may
be utilised more broadly in the future. In previous papers, the development and study of bridge Weigh-in-Motion (BWIN)
technology were essential [9-12]; this technology reveals the number of axles and wheel weights that affect the bridge. The
researchers employed FAD sensors [9], acoustic emissions [11], and optical fibre sensors [12]. In the field of SHM, these devices
and technologies have shown to be quite beneficial. Cameras were also utilized to collect and identify the bridge response in
positions where traditional sensors are difficult to install [13, 14]. The researchers concluded that using this approach could produce
more accurate experimental results than using conventional sensors [13]. The strain gauge was only utilised in one study [15] to
obtain bridge response and displacement data. This enables the strain gauge to extract displacement in locations where an LVDT
would be difficult to attach or install on a bridge.

Characterization of Case Study

Al-Shuhadah Bridge was chosen as the case study of this work representing the typical bridge’s superstructure used in Iraq. The
bridge selected for study is located in Al-Muthanna province in the south of Iraq and crosses the Euphrates River, as shown in Figure
1.

 Figure 1 Location of Al-Shuhadah
 Bridge

The length of Al-Shuhadah Bridge is 356 metres and the width is 15.5 metres. The carriageway of the bridge contains four-lane;
two-lane forward and two-lane backward; The Bridge is made up of seven simply supported spans as shown in Figure 3. Initially,
the first two spans are 20 metres long, and the third spans out to 30 metres. The following two spans are 36 metres in length. In all,
the last two spans are 23 metres across each other.The longitudinal girders are continuous as simply supported over the seven spans
of the 188 m crossing. These girders are of two types, one is as pre-tension concrete and the other is a built-up steel girder. Pre-
tensioned girders are used in spans 1, 2, 6, and 7, while built-up steel girders are used in spans 3, 4, and 5. Figure 3 show the
superstructure for the bridge.

 Copyrights @Kalahari Journals Vol. 7 No. 1(January, 2022)
 International Journal of Mechanical Engineering
 834

Figure 2 Layout of the
 Bridge

 (a) Concrete girders (a) Steel girders
 spans Figure 3 Superstructure of thespans
 Bridge

Load Rating

This structure was designed to withstand military live loads of tracked vehicles Class 100 from (Iraqi standard specifications for
road bridges). Figure 4 illustrates the loading pattern, for this loading class, which consists of a bogie 907 KN truck.

 Figure 4 Military Live Loads Vehicles Class 100 From

 Copyrights @Kalahari Journals Vol. 7 No. 1(January, 2022)
 International Journal of Mechanical Engineering
 835

Instrumentation Plan

The data acquisition system in our field testing was developed through the use of Arduino boards in combination with one of the
most famous engineering software, LabVIEW [20]. In addition to LabVIEW software, Arduino boards have been employed in the
development of this system. As shown in Figure 5, finally, the data acquisition device was set up with 14 data collection channels
and a maximum collection rate of 200 samples/second/channel.

 Figure 5The data acquisition
 device
Two strain gauges, two displacement sensors (LVDT) and six accelerometers were utilised and installed on the bridge in our case
study. The main objective of this instrumentation was to record the structural system's overall behaviour. The type of sensors and
its specification was displayed in Figure 6.

 (c) ADXL335 3-
 (a) LVDT Sensor (b) Strain gauges PL-60- axis
 11-1L type and FRAB-1-

 Figure 6 Type of Used
 Sensor
The second span was picked from the south side of the bridge since all of the spans with concrete girders are identical. In terms of
steel spans, the middle span (Span 4) was chosen since it is the longest and sits in the middle of the bridge structure. The forward
traffic lanes, which begin on the bridge's southern side, consist of straight approaches, allowing the test vehicle's speed to be
controlled, in contrast to what we notice on the opposite side (the northern side) which is a curved road. The implementation of
sensors on the girders at the bottom of the forward lanes, that is, east of the bridge structure, was motivated by these reasons.For
several days, ADT (average daily traffic) was monitored in the above-mentioned forward lanes. This provides us with an idea of
which lanes have the most vehicles passing through. We note that roughly 90% of all vehicles travel in the second lane, also known
as the "fast lane," while 10% go in the first lane, often known as the "slow lane". This leads us to monitor the second traffic lane, as

 Copyrights @Kalahari Journals Vol. 7 No. 1(January, 2022)
 International Journal of Mechanical Engineering
 836

we are the ones who installed the sensors below the girders that sustain it.The fifth girder of span 2 and the third girder of span 4
was chosen as the target girder for putting the sensors because they are in the centre of the traffic lane, Figure 7.

 Figure 7 Selected Girders Locations for
 Monitoring
In the investigation that is conducted in previous studies, S. Faraz et al.[10]declared that a girder in the middle of the lane receives
the largest loads, bending moment, and stresses.Finally, the positions of all the sensors deployed on the Al-Shuhadah Bridge in
longitudinal and top views were illustrates in Figure 8.

 Figure 8 Locations of sensors; plan and
 longitudinal view
Load Testing

There were static, pseudo-static, and dynamic tests were performed on 2021\05\21 between 04:00 to 06.00 AM to evaluate the
bridge's performance due to daily traffic and test truck. The Mercedes-Benz SK 3544 8×4 dump truck used in this study is shown
in Figure 9 and the scenarios of static and dynamic cases were designed to implement the different tests. The test load level must be
representative of serviceability situations. It is preferable to aiming for a load lev-

 Copyrights @Kalahari Journals Vol. 7 No. 1(January, 2022)
 International Journal of Mechanical Engineering
 837
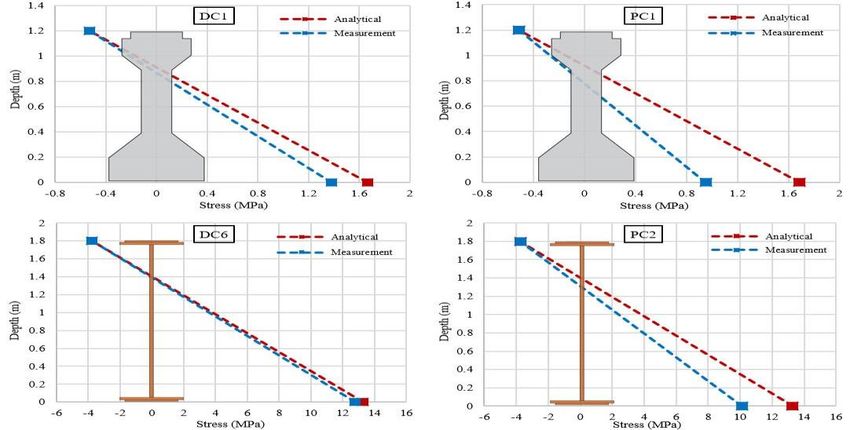
Figure 9 The Test
 Truck
el that corresponds to a 5-year return time. In practice, this involves increasing the test load to around 60% of the characteristic live
load specified in the design code. Never exceed 70% of the design load or 100% of the un-factored traffic load, according to
regulatory requirements[3, 21, 22].The weight of the truck is 18.4 Tons, and the total weight of the truck with load is 52.7 Tons; the
trucks loads represented about 60% of the design loads of the bridge. During a calibration test, the time histories of each designed
vehicle were recorded as it crossed the bridge in each travel lane while ordinary traffic was temporarily stopped in all directions.

The most common type of load test is static testing [21]. Vehicle loads with established axle weights represent the test load, which
were placed at sections A-A, B-B, C-C and D-D in both spans (span 2 and span 4), Figure 10, to obtain the maximum load effect

.

 Figure 10 Test sections on the bridge (longitudinal
 and top view)
Thus, four static and two pseudo-static tests are implemented to evaluate the bridge. Table 1 summarized the static and pseudo-
static cases.

 Copyrights @Kalahari Journals Vol. 7 No. 1(January, 2022)
 International Journal of Mechanical Engineering
 838

In the dynamic loading cases, the bridge was tested in one direction, Al-Shuhadah district to Al-Naadem district, over the second
lane with the truck moving at different speeds, Figure 11. Table 2 presents the truck speeds and directions

 Copyrights @Kalahari Journals Vol. 7 No. 1(January, 2022)
 International Journal of Mechanical Engineering
 839
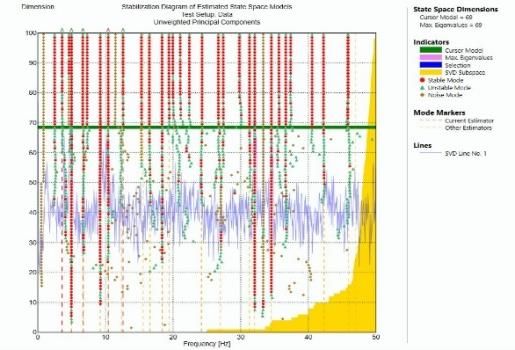
Table 2Dynamic loads scenarios

 Load case Direction Lane Speed
 DC1 Forward 2 10 km/h
 DC2 Forward 2 20 km/h
 DC3 Forward 2 30 km/h
 DC4 Forward 2 40 km/h
 DC5 Forward 2 60 km/h
 DC6 Forward 2 10 km/h
 DC7 Forward 2 20 km/h
 DC8 Forward 2 30 km/h
 DC9 Forward 2 40 km/h
 DC10 Forward 2 60 km/h

 Figure 11 Dynamic test
 cases

Building and Updating a Finite Element Model

The bridge's FE model was created utilising beam elements and shell elements for the reinforced concrete pre-stress or built-up steel
girders and deck, as illustrated in Figure 12. In addition, tendon elements were included in the studies to account for the pre-stress
effect, and shell elements were used to simulate steel girders in steel. According to the bridge's calculation report and project
drawings, all considerations for the FEM were achieved. The structural analysis software CSI-Bridge V.22 [18, 19] was used to
achieve this goal. The bridge was then updated based on the experimental field test's modal characteristics and displacement results
[17, 28]. The distribution factor and load rating of the updated FEM are also taken into account for the purpose of the comparison
of experimental and AASHTO calculation.

 Copyrights @Kalahari Journals Vol. 7 No. 1(January, 2022)
 International Journal of Mechanical Engineering
 840

Figure 12 FE Model for Concrete and
 Steel Span
Static Behavior Evaluation

The load test results can be utilised to gain a basic idea of how each of the bridge's girders responds to vehicle loads. When more
complicated behaviours develop, simple observations in this respect enable relevant comparisons to be formed between the
performance of the cases. In this procedure, comparisons between measured data and predicted responses obtained from FEM and
fundamental strength of materials principles are also beneficial. To assess the load test findings, an attempt was made to separate
the behaviour of the girders from the contributions of other bridge structural parts. In this regard, the present study focused on the
girders' reaction, which was thought to be the most affected by the moving vehicles [24]. As a result, the following analysis of live
load data concentrates on recorded displacements and strains. In addition, static evaluation is used to assess a structure's linear
behavior [3]. The test may also be used to verify and update the load capacity of bridges.

The primary goal of the evaluation Al-Shuhadah Bridge is ultimately to compare the performance of the static and dynamic cases.
The following sections present an analysis of several fundamental behaviours that have been computed. Each behaviour provides
useful information on the baseline state of each factor to be computed, as well as how they behaved in comparison to one another.

Finally, it is important to mention that the steel grade and concrete capacity and AASHTO specifications code are used to evaluate
the safety of the bridge. ST52-3 steel-grade girders, with 345 MPa yield strength and 270 MPa allowable tensile stresses and 200
GPa modulus of elasticity (E) is used.

Deflection Limits Check

The deflection limit check determines if the maximum mid-span displacement exceeds the value determined by (L/800). This limit
is frequently used to assess the bridge's serviceability [1, 23]. Here (L) is the length of the span, which is 20 m ( 20,000 mm) for
span no.2 and is 36 m ( 36,000 mm) for span no.4. Here the limits of deflection is (L₂ / 800 = 20000/800 = 25 mm) and (L₄ / 800 =
36000/800 = 45 mm). As demonstrated in Table 3, the maximum displacement of mid-span collected from experimental test and
FEM of girder 5 in span 2 and girder 3 in span 4 in static and semi-static cases are shown, which is considerably less than the
serviceability deflection limit. This finding can be slightly predictable due to the number of girders and the length of the span.
Finally, the bridge satisfies the requirements of AASHTO (2017) for serviceability

 Copyrights @Kalahari Journals Vol. 7 No. 1(January, 2022)
 International Journal of Mechanical Engineering
 841
.
 Table 3Different experimental and FEM
 measurements with AASHTO specification

Distribution Factors (DF)

We can calculate load distribution factors of the bridge based on the responses across the bridge, which is important for bridge
response and load rating. The DF may be computed using Equation (1) below and the displacement and strain results of each girder:

 ,
 =
 ∑ =1 ,

i, j = girder number,

δ,ϵ = the displacement or strain of the girder

On the other hand, AASHTO specifies formulas for estimating DF based on the geometry of the bridge's superstructure and single
or multiple loading scenarios. The specific formulas for calculating the DF were obtained based on the geometry of the
superstructure of the bridge utilised in our study, which is a composite superstructure with built-up steel girders and precast concrete
girders (Table 4.6.2.2.2b-1 in AASHTO 2017) [1].DF may be calculated using the previous equations within AASHTO’s tables and

 Copyrights @Kalahari Journals Vol. 7 No. 1(January, 2022)
 International Journal of Mechanical Engineering
 842
the bridge parameters for both the concrete (No. 2) and steel (No. 4) spans. According to the specifications of the AASHTO code,
we chose the highest distribution factors, regardless of the loaded cases, as noted previously. The load distribution factors DF for
the span 2 are (0.43) for the interior girders and (0.55) for the exterior girders. For span 4, the DF for the interior and exterior girders
is (0.63). Table 4 shown DF that calculated by AASHTO formulas.

 DF from AASHTO
 Span type Interior
 Exterior girders
 girders
 Concrete
 span 0.43 0.55
 (span no.2)
 Steel span
 0.63 0.63
 (span no.4)

The load distribution factor was practically calculated using the data of the strains and displacements obtained for all of the girders
and Equation 1. Figure 13 compares the load distribution factor computed using AASHTO's formulae to that determined for SC1
and SC3 cases.

 SC1 SC3
 0.6 0.9
 DF-Strain DF-disp. AASHTO
 DF-Strain DF-disp. AASHTO
 0.5 0.8
 Distribution factor (DF)

 0.7
 Distribution factor (DF)

 0.4 0.6

 0.3 0.5
 0.4
 0.2 0.3

 0.1 0.2
 0.1
 0 0
 1 2 3 4 5 6 7 8 9 10 11 1 2 3 4 5 6
The DF calculated Girder Number
 from the strain appears to be comparable to that computed from the Number
 Girder displacements, based on

 Figure 13 DF for SC1 and
the previous figures. Furthermore, the distributionSC3
 factorcases
 DF had the highest values under the truckload. In the load case (DC1), the
highest DF of span No.2 determined from displacements was (0.152), while the highest computed from strain was (0.19) for the
same load case. The highest DF obtained from displacements in span No.4 was (0.21) in the load case (DC6), meanwhile the highest
determined from strain measurements was (0.23) in the load case (SC4). The maximum DF value (0.23) indicates that the load
distribution over the bridge is good.

The values of DFs estimated using the AASHTO formula give more conservative values, especially in the girders further away from
the loaded lane, as illustrated in the previous figures. The AASHTO requirements, which involve taking the highest value obtained
by the equations described at the beginning of this section, which is frequently the value extracted from the equations for multiple
traffic lanes, resulted in the high DFs values computed through the AASHTO formulas. In our study, the cases were for one traffic
lane loading. As a result, we created multiple lane loading scenarios that are more realistic than single-lane loading using the
calibrated FEM. Figure 14 displays four new loading cases, each of which consists of two adjacent traffic lanes and two opposing
traffic lanes. Finally, the DFs for multi-lane loading were discovered, and it was realised that they are still less than the values
computed by AASHTO

 Copyrights @Kalahari Journals Vol. 7 No. 1(January, 2022)
 International Journal of Mechanical Engineering
 843
.

 Figure 14DF for multi-loaded lanes

Load Rating (RF)

The bridge load rating is a defined method for determining a bridge's safe load-carrying capacity. In bridge management systems,
operators utilize load ratings to optimize maintenance and repair funding. The structural condition, material characteristics, loads,
and site traffic situations all play a role in determining a bridge load rating. Each component affects the bridge's condition and, as a
result, the load rating. The primary objective of bridge load rating is to measure the condition of specific bridge components to
ensure public safety.

The Manual for Bridge Evaluation (MBE) [25] by AASHTO provides recommendations on bridge load rating. The technique of
testing live load response to specified AASHTO loads is known as bridge load rating. The MBE establishes a standard evaluation
technique as well as a framework for determining the safe load capacity. Using the values of the DFs from the previous section and
the test truck load, a basic frequently used method for calculating the load rating factor may be determined using AASHTO formulas.
For Strength Limit I, the rating factors (RF) are computed using DF and the test truck. With Equation 2, AASHTO (2017) provides
a general formulation for load rating:

 − − (1)
 =
 ( + )

In which, C denotes the current load-carrying capacity of the bridge members, while DC and DW denote the dead load effects
induced by structural components and the wearing surface, respectively. The live load effect and its equivalent dynamic effects are
denoted by LL and IM, respectively, whereas the load factors are denoted by γDC, γDW and γLL. Moreover, the
current load-carrying capacity C is described as: (2)

 Copyrights @Kalahari Journals Vol. 7 No. 1(January, 2022)
 International Journal of Mechanical Engineering
 844
 =

where φ_c φ_s φ and are the condition factor, system factor, and the LRFD resistance factor, respectively, while Rn denotes the
nominal resistance of bridge member. The load rating factor was calculated using the calibrated FEM, DF data,
and the load value of the test vehicle utilised during the bridge testing, which its load was (52.7 (3) Ton). For Strength
Limit I, we used values (1.25), (1.5) and (1.35) for factors γDC, γDW and γLL, respectively. As due to φ_c φ_s φ
factors, value (1) was used for all them. Figure 15 shows the load rating factors (RF) of the test truck's passage in the second lane
of all concrete and steel spans.

The load rating factor (RF) for girder No. 5, which is directly beneath the test vehicle, is (2.88) in the concrete span, as shown in
the figure above. Additionally, RF for the girder No. 3 directly beneath the test vehicle in the steel span was (5.01). Generally, the
load rating provides an estimation of the bridge carrying capacity with regard to the test truck load [16]. In this example, the results
of the analysis suggest that the two girders G5 in span No.2 and G3 in span No.4 can respectively sustain 2.88 and 5.01 times the
test truck load. More specifically, it can be said that girders G5 and G3 can support a truck weight of (146 tons) and (253.5 tons),
respectively.

 4 8

 7
 3
 Load Rating (RF)
 Load Rating (RF)

 6

 5
 2
 4

 1 3
 1 2 3 4 5 6 7 8 9 10 11 1 2 3 4 5 6
 Figure
 Girder 15
 Number RF for the girders in both span No.2
 Girder Number

 and No.4

 (a) RF for concrete span (a) RF for steel span (span
 (span No. 2) No. 4)
Modal Curvatures

The modal curvature of a bridge is used to evaluate whether or not the structure is damaged [26]. Reynders et al. [26] discovered
that modal curvature determined by strain measurements is more accurate than modal curvature computed from displacement
measurements. In our study, we used data from experimental and calibrated FEM to estimate the modal curvature. The following
formula, Equation 4, is used to compute the curvature of the bridge girders:
 −
 =
 ℎ
 (4)

Where and are the top and bottom strain of the girders; and h is the height of the bridge girder.

The girders under the load of the test truck were selected to estimate the modal curvature for all static, semi-static and dynamic tests
cases. The selected girders were (G4, G5 and G6) for span No.2, while for span No.4 the chosen girders were (G1, G2 and G3).
Figure 16 shows the modal curvature of the selected girders for tests cases. It is noted from the figure that the modal curvature of
the steel span is smaller by about half. This is because of the bracing of the steel span, due to existing the distributed diaphragms
[3]. The highest effect occurs at girder G4 at span No.2. The curvatures of the girder (G4) under cases (DC1) and (PC1) are almost
the same and the highest. Similarly, the girder (G3) had the highest curvatures under cases (DC6) and (PC2). This indicates that
both cases, semi-static cases and moving the truck with a speed of 10 Km/h, can be used to assess the curvature of bending members.
Finally, curvatures modal performance of the bridge under the cases indicate that the modal curvature is found to be the same under
different loading cases and the safety possibility of the bridge is high [26].

 Copyrights @Kalahari Journals Vol. 7 No. 1(January, 2022)
 International Journal of Mechanical Engineering
 845
Span No.2
 120
 G4 G5 G6
 100
 Curvature (m-1)
 80

 60

 40

 20
 80 0
 DC1 DC2 DC3Span No.4 DC5
 DC4 SC1 SC2 PC1
 70
 Load Case
 60
 50 Figure 16Girders Curvatures
 G1 under different load
 Curvature (m-1)

 G2 G3

Neutral Axis Position (NA)
 40
 cases
 30
The neutral axis (NA) was20determined using stress measurements at bottom of girder under loading cases. The selected cases were
(DC1) and (PC1) as for girder
 10 (G5) at span No.2, the cases (DC6) and (PC2) as for girder (G3) at span No. 4. Figure 17 shows the
stress distribution along with
 0 the G5 for concrete girder and G3 for steel girder. The NA of the concrete girder for cases DC1 and
PC1 were located at 0.83 m and DC60.78 m,DC7 DC8 The
 respectively. DC9 NADC10
 for the SC3 SC4 were
 steel girder PC2cases DC6 and PC2 were at 1.38 m and 1.29
 Load Case
m, respectively. Table 5 illustrates the NA of girders G5 and G3 under the cases, also shown the analytical NA that is calculated by
the stresses of bottom of girder were obtained from FEM. From Table 5, the NA changes are in-between 0 − 15% from the analytical
value. This reveals that no abnormal behaviour occurred [3].

 Figure 17The neutral axis of the bridge girder

 Table 5Difference between actual NA and
 analytical NA
 Girder G4 G3
 Case DC1 PC1 DC6 PC2
 Actual NA (m) 0.83 0.78 1.38 1.29
 Analytical NA
 0.9 0.9 1.39 1.39
 (m)
 NA change % 8.5 15.3 0.7 7.75

 Copyrights @Kalahari Journals Vol. 7 No. 1(January, 2022)
 International Journal of Mechanical Engineering
 846
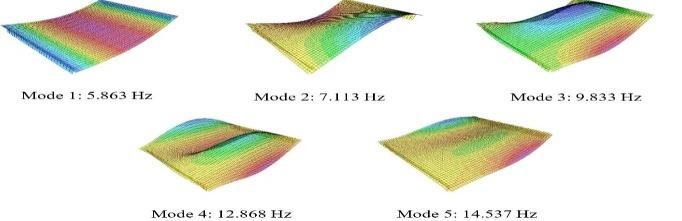
Dynamic Behaviour Evaluation

To identify the modes of the shapes, the CSI Bridge software was used to perform a modal analysis on the calibrated finite element
model. For both concrete and steel spans, modes were discovered. The first five modes of concrete and steel span are depicted in
Figures 18 and 19, respectively.

The accelerations versus time histories obtained by six accelerometers deployed on the bridge were analysed to estimate the bridge's
dynamic parameters from the experimental test. One of the other objectives of modal testing is to utilise the data to find any abnormal
conditions that occur when the test vehicle is being moved. These dynamic findings may be followed over time to see whether there
have been any significant changes

.

 Figure 19The first five mode shapes of steel span Figure 18The first five mode shapes of concrete span
The dynamic response was evaluated using acceleration measurements. It was found that the accelerations measurements in Z-
direction at the ends of spans (ACC4Z and ACC6Z) are good for obtaining the dynamic response in the bridge. The highest
accelerations of these accelerometers were utilized to set a relationship between the different speeds and the acceleration occurring
in the bridge. Figure 20 shows a summary of the relation between the maximum acceleration under different speeds of the test truck
for the two spans. The acceleration measurements under low-speed trucks contaminate by high noises that is because of the time of
the truck that affected on the bridge span. In addition, the exponential equations (acceleration = 0.0584e^(0.0224×speed)) and
(acceleration = 0.0191e^(0.0347×speed)) are a good fitting for the relation between maximum acceleration and truck speeds for
Span No.2 and 4, respectively, and they can be used to detect the acceleration change of the bridge. The results show that the
maximum accelerations (0.21g and 0.17g) are found to be lower than the standard value (0.26 g) [27].

 0.25 0.18

 y = 0.0584e0.0224x 0.16
 0.2 R² = 0.9777 0.14
 y = 0.0191e0.0347x
 Acceleration (g)

 R² = 0.8808
 Acceleration (g)

 0.12
 0.15
 0.1

 0.08
 0.1
 0.06

 0.05 0.04

 0.02
 0 0
 0 10 20 30 40 50 60 70 0 10 20 30 40 50 60 70
 Speed (km/h) Speed (km/h)

 (a) Span (b) Span
 No.2 No.4

 Figure 20Relationship between truck speeds and recorded
 acceleration
Here load cases DC5 and DC10 (test truck moved on Lane 2 with a speed of 60 km/h = 16.66 m/s) is considered for the dynamic
analysis because it was discovered the maximum acceleration within these cases. It is seen based on the speed of the truck it takes

 Copyrights @Kalahari Journals Vol. 7 No. 1(January, 2022)
 International Journal of Mechanical Engineering
 847
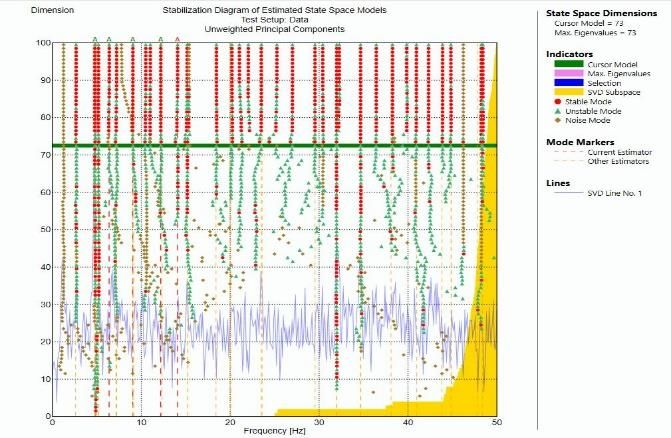
about 1.2 and 2.16 seconds to cross Span No.2 and No.4, respectively. Figure 21 shows the acceleration time histories of each
measurement point and FFT analysis (Fast Fourier Transform) for load cases DC5 and DC10.

 0.3
 0.2
 Acceleration (g)

 0.1
 0
 -0.1
 -0.2
 -0.3
 0 0.5 1 1.5 2 2.5 3 3.5 4 4.5 5
 Time (sec)

 5
 4
 Power Spectral
 Density

 3
 2
 1
 0
 0 5 10 15 20 25 (Hz)
 Frequency 30 35 40 45 50

 (a) Concrete Span

 0.25 0.06

 0.04

 0.15
 Acceleration (g)

 0.02

 0.05
 0

 -0.05 -0.02

 -0.15 -0.04

 -0.25 -0.06

 0 0.5 1 1.5 2 2.5 3 3.5 4 4.5 5
 Time (sec)

 (b) Steel Span

Based on all the collected time histories, the operational modal analysis method is employed to identify the modal frequencies,
damping ratio and mode shapes using (Artemis-Modal 6.0.2.0) software. The operational modal analysis, EFDD and SSI methods
are generally used to identify modal parameters of linear systems using output-only measurements. Figures 22 and 23 present the
estimated modal parameters, modes shapes and damping after modelled and processing the collected data from the experimental
test using Artemis-Modal for both concrete and steel spans.

 9
 8
 Power Spectral Density

 7
 6
 5
 4
 3
 2
 1
 0
 0 5 10 15 20 25 30 35 40 45 50
 Frequency (Hz)

 Figure 21Readings and FFT analysis for DC5 and DC10 cases

 Copyrights @Kalahari Journals Vol. 7 No. 1(January, 2022)
 International Journal of Mechanical Engineering
 848
Bridge girder modelling with
 accelerometers

 Operational modal analysis

 ModeHz
 4.98 1 ModeHz
 6.38 2 Mode Hz
 9.045 3 Mode 4
 12.189 Mode 5
 14.077
 ζ = 5.9 ζ = 5.7 ζ = 3.9 ζ = 3.1 ζ = 1.7
 % Estimated
 % modal characteristics
 % and damping ratio (ζ)
 Figure 22Operational Modal Analysis for concrete span

 Bridge girder modelling with
 accelerometers
 Operational modal analysis

 Mode 1 Mode 2 Mode 3 Mode 4 Mode 5
 3.592 Hz 4.97 Hz 6.67Hz 10.411 12.6 Hz
 ζ = 8.8 ζ = 1.8 ζ = 2.5 ζ = 1.3 ζ = 2.7
 % % %
 Estimated modal characteristics and damping ratio (ζ)

 Figure 23Operational Modal Analysis for steel span

In addition, the dominant frequencies were identified. From the results of Artemis-Modal software, the dominant frequency is 4.98
and 4.97 Hz for the truck speeds 60 km/h along concrete and steel spans, respectively. Finally, the summary of frequency changes
with truck speeds shows that the average dominant frequency is 4.975 Hz, whereas the design value is 2.35 Hz [27]. the calculated
frequency ratios show that it is over than one, which means that the bridge behaviour is safe, and no abnormal conditions occurred,
Table 6.

 Table 6Summary of Extracted Dominant Frequencies
 Span Concrete girders Steel girders
 Frequency (Hz) 4.98 4.97
 Frequency Ratio % 2.12 2.11

 Copyrights @Kalahari Journals Vol. 7 No. 1(January, 2022)
 International Journal of Mechanical Engineering
 849
The outcomes from the FE analysis of the bridge were also given in Table 7 to compare those from the experimental. Such data and
dynamic response can be collected efficiently under operating traffic and can be evaluated to track any stiffness or boundary
condition change.
 Table 7Comparison of modal frequencies

 Experimental
 FEM (Hz) Difference (%)
 No. (Hz)
 Span 2 Span 4 Span 2 Span 4 Span 2 Span 4
 Mode
 4.98 3.592 5.86 3.44 17.67 4.23
 1
 Mode
 6.38 4.97 7.11 4.04 11.44 18.71
 2
 Mode
 9.045 6.67 9.83 6.86 8.67 2.84
 3
 Mode
 12.189 10.411 12.86 11.77 5.5 13.05
 4
 Mode
 14.077 12.6 14.53 12.57 3.21 0.23
 5

Linearity Check

The linearity check of the bridge was carried out mainly to be able to calculate multiple presence factors by combining separate test
results. Under regular operational loads, the bridge response should not reach ultimate response levels. As such, it would be possible
to observe linear behaviour under given increasing load conditions. To check the linearity of the bridge, a random truck was chosen
from the short-term monitoring data and given a name (LC), then compared with the test truck. After investigating, LC Truck was
carrying a load of (832 KN) and has a speed of about (22 km/h). The displacement and strain data were picked from dynamic test
cases with similar speed, which is (DC2 and DC7) to verify the linearity of concrete and steel spans as shown in Figures 24 and 25,
respectively, and Table 8.

The weight increase ratio of the LC Truck to the test truck was found to be 1.57. It is also worth noting that the increased ratios of
displacement and strain readings for the concrete span were by (1.77 and 1.32, respectively), but the increasing ratio for the steel
span were (1.64 and 1.31, respectively). The linearity has been validated because the difference between the ratio increase in the
readings of the LC truck and the ratio between the differences between the two weights was within the range of 15 ± 1% that was
defined due to the change in axle number and total length of the truck as well as their location [23]. Finally, this provides proof that
the bridge behaves linearly under operational loads until the load of 832 KN

 Figure 24 LC Truck data during passing the concrete span

 Copyrights @Kalahari Journals Vol. 7 No. 1(January, 2022)
 International Journal of Mechanical Engineering
 850
Figure 25LC Truck data during passing the steel span

 Table 8Linearity Ratio between LC truck and test truck

 Total Displacement (mm) Strain (μɛ)
 Case name Truck weight Span No. Span No. Span No.
 Span No. 2
 (KN) 4 2 4
 DC2 and Test
 527 2.53 4.75 68.31 60.61
 DC7 truck
 LC LC truck 832 4.48 7.82 90.1 79.8
 Ratio 1.57 1.77 1.64 1.32 1.31

Maximum Stresses Check

The maximum sectional stress distributions are evaluated depending on passing the same long truck that resulted maximum
displacements with allowable stresses of the steel grade and concrete. An analysis of the long truck moving over the bridge was
performed using the calibrated FEM. Figure 26 illustrates the stress performance of the bridge (girder 5 within Span No.2 and girder
3 within Span No.4) under the long truck.

The positive and negative stresses refer to compression and tension stresses of structures members. From Figure 26, the maximum
tension stress (19.01 MPa) was observed at mid-span of steel girder (girder 3). In addition, the maximum tension stress (2.15 MPa)
was obtained at mid-span of girder 5. The maximum, minimum and overall bending and shear stresses reveal that the bridge is safe
under the abnormal load case, where the observed stresses are lower than the allowable stresses of steel grade ST52-3 and the
concrete of girder

.

 Copyrights @Kalahari Journals Vol. 7 No. 1(January, 2022)
 International Journal of Mechanical Engineering
 851
(a) Concrete girder

 (b) Steel girder

 Figure 26Distribution of stresses in the concrete and steel girder
Conclusion

The following is a summary of some of the particular results for this bridge:

• Static and dynamic testing results were acquired through the experimental data. These results were employed for improving the
updated FEM of the bridge. The DF and RF results from the updated FEM were obtained to be in good agreement and reliable.
Hence, the calibrated FEM can be adopted reliably for advanced analysis of the bridge.

• When compared to experimental and FEM methods, the DF of live load computed by AASHTO standards gives more conservative
findings. The static load case's DF is 0.2, which is smaller than the AASHTO code's 0.60. The updated FEM value of 0.2 for this
parameter.

• Maximum deflections in static and dynamic scenarios are well below the (L/800) limit, and deflections are significantly lower than
the AASHTO code-based L/800.

• The load rating factor has been determined with the requirements of AASHTO and experiment results. Rating factors of Strength
Limit I were 2.88 for concrete span and 5.01 for steel span both for test truck for a single lane. As a result, it was possible to
determine the load-carrying capacity for the bridge.

• In addition, the curvature modal, neutral axis and dynamic characteristics are estimated to assess the bridge girders performance
under static and dynamic loads.

• For the bridge assessment, the results show that the bridge behaviour is safe in different indices, such as maximum displacement,
modal curvature, neutral axis, and frequency changes. All these indices are reported to be lower than the standard values of
AASHTO. Furthermore, the evaluation of the measurement shows that no abnormal condition occurred.

• The study found that bridge condition assessments could be completed quickly and accurately without stopping traffic or disrupting
bridge operations. As a result, the methodology presented in the study may be used to bridge in the same population.

• Based on the findings, it is shown that the bridge has sufficient load carrying capacity and the bridge can carry large truck loads.
For the behaviour under heavy truck loading, the 832 KN truck was employed from short-term monitoring to check linearity,

 Copyrights @Kalahari Journals Vol. 7 No. 1(January, 2022)
 International Journal of Mechanical Engineering
 852
displacement and stresses to obtain the bridge capacity and safety for the most critical condition. As a result, the bridge can continue
to serve and no-load posting is necessary based on the results given in this study.

REFERENCES

 1. AASHTO LRFD bridge design specifications. 2008: Fourth edition with 2008 interim revisions. Washington, D.C. :
 American Association of State Highway and Transportation Officials, [2008] ©2007.
 2. Liu, Z., K. Freeseman, and B.M. Phares, Evaluation of the need for negative moment reinforcing in prestressed concrete
 bridges in the view of service loads. Engineering Structures, 2020. 207: p. 110206.
 3. Kaloop, M.R., et al., Service-Life Evaluation of Existing Bridges Subjected to Static and Moving Trucks Using Structural
 Health Monitoring System: Case Study. KSCE Journal of Civil Engineering, 2020. 24(5): p. 1593-1606.
 4. Algohi, B., B. Bakht, and A. Mufti, Long-term study on bearing restraint of a girder bridge. Journal of Civil Structural
 Health Monitoring, 2017. 7(1): p. 45-55.
 5. El-Sisi, A.E.-D.A., et al., Field-testing and numerical simulation of vantage steel bridge. Journal of Civil Structural Health
 Monitoring, 2020. 10(3): p. 443-456.
 6. Nick, H., et al., Damage identification in steel girder bridges using modal strain energy-based damage index method and
 artificial neural network. Engineering Failure Analysis, 2021. 119: p. 105010.
 7. Nguyen, D.H., et al., Damage detection in girder bridges using modal curvatures gapped smoothing method and
 Convolutional Neural Network: Application to Bo Nghi bridge. Theoretical and Applied Fracture Mechanics, 2020. 109:
 p. 102728.
 8. Jahan, S., et al., A Fuzzy Krill Herd Approach for Structural Health Monitoring of Bridges using Operational Modal
 Analysis. Iranian Journal of Science and Technology, Transactions of Civil Engineering, 2021. 45(2): p. 1139-1157.
 9. Kalyankar, R. and N. Uddin, Axle detection on prestressed concrete bridge using bridge weigh-in-motion system. Journal
 of Civil Structural Health Monitoring, 2017. 7(2): p. 191-205.
 10. Faraz, S., et al., Sources of errors in fatigue assessment of steel bridges using BWIM. Journal of Civil Structural Health
 Monitoring, 2017. 7(3): p. 291-302.
 11. Algohi, B., A. Mufti, and D. Thomson, Detection of speed and axle configuration of moving vehicles using acoustic
 emission. Journal of Civil Structural Health Monitoring, 2018. 8(3): p. 353-362.
 12. Lydon, M., et al., Improved axle detection for bridge weigh-in-motion systems using fiber optic sensors. Journal of Civil
 Structural Health Monitoring, 2017. 7(3): p. 325-332.
 13. Dong, C.-Z., S. Bas, and F.N. Catbas, A portable monitoring approach using cameras and computer vision for bridge load
 rating in smart cities. Journal of Civil Structural Health Monitoring, 2020. 10(5): p. 1001-1021.
 14. Xiao, P., et al., Development of video analytics with template matching methods for using camera as sensor and application
 to highway bridge structural health monitoring. Journal of Civil Structural Health Monitoring, 2020. 10(3): p. 405-424.
 15. Jeon, J.-C. and H.-H. Lee, Development of displacement estimation method of girder bridges using measured strain signal
 induced by vehicular loads. Engineering Structures, 2019. 186: p. 203-215.
 16. Sun, Z., D.M. Siringoringo, and Y. Fujino, Load-carrying capacity evaluation of girder bridge using moving vehicle.
 Engineering Structures, 2021. 229: p. 111645.
 17. Friswell, M. and J.E. Mottershead, Finite element model updating in structural dynamics. Vol. 38. 2013: Springer Science
 & Business Media.
 18. CSI BRIDGE, Integrated 3-D bridge analysis, design and rating. V.22: CSI Analysis Reference Manual.
 19. Manual, C.A.R., sap2000 Integrated solution for structural analysis and design. V. 21.
 20. Instruments, N., LabVIEW User Manual. 2003 Edition.
 21. Olaszek, P., M. Łagoda, and J.R. Casas, Diagnostic load testing and assessment of existing bridges: examples of
 application. Structure and Infrastructure Engineering, 2014. 10(6): p. 834-842.
 22. Casas, J., A. Znidaric, and P. Olaszek, Recommendation on the use of soft, diagnostic and proof load testing. Deliverable
 D16. EU project ARCHES. Brussels. 2009.
 23. Dong, C., et al., Bridge load testing for identifying live load distribution, load rating, serviceability and dynamic response.
 Frontiers in Built Environment, 2020. 6: p. 46.
 24. Smolenski, P.J., Field instrumentation and live load testing to evaluate behaviors of three reinforced concrete bridge decks.
 2004, Montana State University-Bozeman, College of Engineering.
 25. Bridges, T.O.S.o., The manual for bridge evaluation. 2011: AASHTO.
 26. Reynders, E., et al., Damage identification on the Tilff Bridge by vibration monitoring using optical fiber strain sensors.
 Journal of engineering mechanics, 2007. 133(2): p. 185-193.
 27. Gaunt, J.T. and C.D. Sutton, Highway bridge vibration studies. 1981.
 28. Roensch, S., "Finite Element Analysis". Roensch &Associates, 2008.

 Copyrights @Kalahari Journals Vol. 7 No. 1(January, 2022)
 International Journal of Mechanical Engineering
 853
29. Bień, J., M. Kużawa, and T. Kamiński, Strategies and tools for the monitoring of concrete bridges. Structural Concrete,
 2020. 21(4): p. 1227-1239.
 30. Chen, H.-P., Structural health monitoring of large civil engineering structures. 2018.

Copyrights @Kalahari Journals Vol. 7 No. 1(January, 2022)
 International Journal of Mechanical Engineering
 854
You can also read