LETHBRIDGE. THIS IS for economic diversity
←
→
Page content transcription
If your browser does not render page correctly, please read the page content below
THIS IS
LETHBRIDGE.
A BRIGHT
CHOICE:
for economic diversity
THIS IS
LETHBRIDGE.
A BRIGHT
CHOICE:
At Economic Development Lethbridge, we are in the
business of building community.

Together with our 25-member volunteer Board of Directors, we serve as
stewards of the economic strategy for the city. We connect, support and
promote Lethbridge as a place for enterprise, but also as a place where
businesses and citizens can thrive within a welcoming community.

As a rallying voice for Lethbridge, we’re here to help you succeed!

                       With quality market data, a network of partners and
                        a dedicated team, we work on projects to support:

                        • business retention and growth
                         • investment attraction and business development
                         • entrepreneur training and development
                         • marketing and advocacy

                          We believe that together, we can
                           build bright opportunities.

chooselethbridge.ca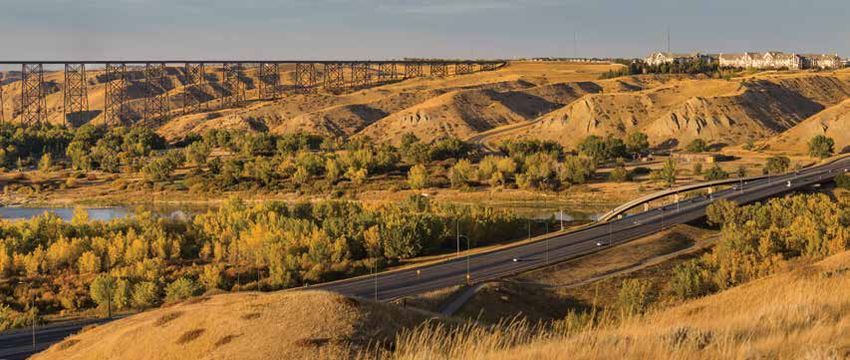
Welcome
Vibrant Economy ............................................................................... 2
Business ............................................................................................... 4
 Entrepreneurship ............................................................................. 8
  Bright People ...................................................................................12
   Living Here ..................................................................................... 16

              Contact us at 403-331-0022
              or visit chooselethbridge.ca
               for more information.

                                                                                              LETHBRIDGE
                                                                                               A BRIGHT CHOICE:   for economic
                                                                                                                  diversity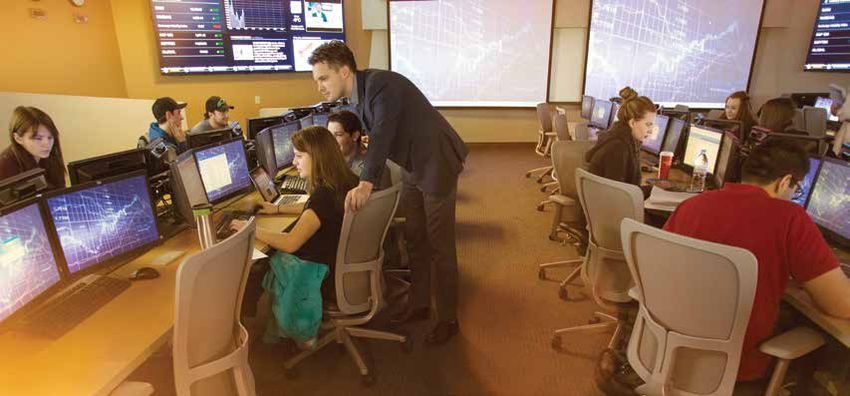
VIBRANT
ECONOMY
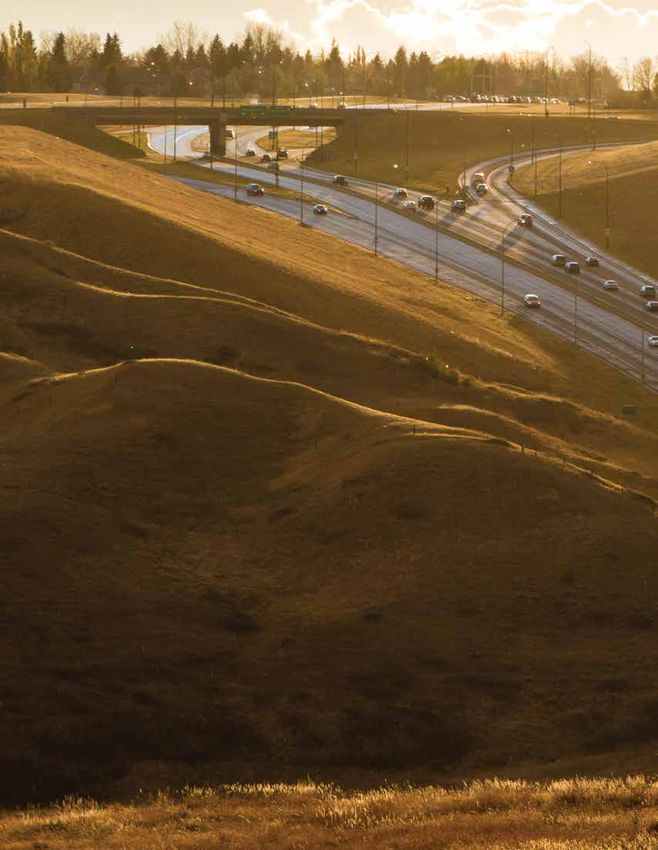
If there is any community in Alberta that can make
the claim of balanced growth, it is Lethbridge. And we
continue to see this claim supported through tracked
economic indicators in areas related to business,
entrepreneurship, population and quality of life.
As a mid-sized city of close to 100,000 people with a trading area nearing
350,000, we continue to see how the stability in traditional sectors, growth
of emerging industries and strength in the public sector creates a positive
environment for continued diversification and bright opportunities.
In 2016 Lethbridge had a GDP of $5.5 billion,
representing growth of 2.6 per cent from 2015.
At the same time, according to the Alberta
government, the province saw its economy
contract by 3.6 per cent.
2 chooselethbridge.ca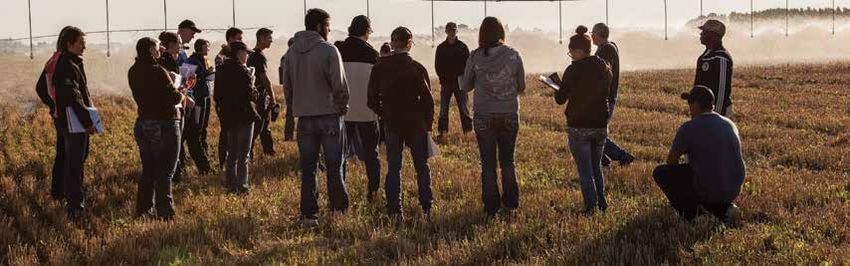
Lethbridge GDP by Sector (2016)                                                      16.8%
                                                                                                          2.4%
                                                                                                                 3.8%
  16.8%   Non-Commercial Services
  15.4%   Primary & Utilities                                                                                            4.0%

  15.2%   Finance, Insurance, Real Estate
  13.4%   Wholesale & Retail Trade                              15.4%                                                           5.0%

  11.5%   Manufacturing
  6.7%    Business Services
                                                                                                                                  5.9%
  5.9%    Construction
  5.0%    Personal Services
  4.0%    Public Administration
                                                                                                                                6.7%
  3.8%    Transportation & Warehousing
  2.4%    Information & Cultural Industries                          15.2%

                                                                                                                 11.5%

                                                                                         13.4%

   $5.5 B                                                  Lethbridge GDP by Sector (2012-2016)

  in 2016 Lethbridge had a GDP of                $5.5 B
  $5.5 billion, representing growth              $5.0 B
      of 2.6 per cent from 2015.                 $4.5 B
                                                 $4.0 B
                                                 $3.5 B
                                                 $3.0 B

    15.4%
                                                 $2.5 B
                                                 $2.0 B
                                                                                                                                  $35.5
                                                  $1.5 B
                                                  $1.0 B
   The percentage of Lethbridge’s                $0.5 B
    GDP driven by the Agriculture                     0
     (Primary & Utilities) Sector.                             2012          2013            2014           2015                 2016

                                                           Lethbridge GDP (2016)
                                                           Largest Increases/Declines by Sector

                                Non-Commercial Services                                                                     7.4%

                       Information & Cultural Industries                                                            6.6%

                                       Personal Services     -1.5%

                                   Public Administration     -1.5%

                                                       -2%    -1%       0%   1%     2%      3%      4%     5%       6%           7%        8%

                                                                                                         A BRIGHT CHOICE:                 for economic
                                                                                                                                          diversity
BUSINESS
     A bright spot in the province, Lethbridge is the
     southern Alberta hub for both traditional industries and
     emerging technologies. Lethbridge thinkers, makers and
     doers are leading change in Agriculture, Food Sciences
     and Manufacturing within a community that is propelled by
     innovative research and a spirit of entrepreneurship.
     The stability of our business and economic environment
     can be attributed to industry diversity, strength in the public
     sector and a robust group of major employers who continue
     to expand and develop within the region.

     With a healthy balance between employment opportunities and a talented
     labour force, the Lethbridge unemployment rate remained the lowest among
     mid-to-large sized cities in Alberta in 2017. With a traditionally lower than
     average participation rate than other cities in Alberta (primarily due to the
     lower cost of living and larger family size), the Lethbridge labour market also
     has capacity to expand which is good news for employers looking to locate in
     Lethbridge or expand their existing business.

                             Investment in the construction of new and revitalized
                              buildings is also a key leading indicator that can provide
                               insights into the state of the economy in the near future.
                               In 2017, Total Building Permit Value in Lethbridge was
                               $313.5 million, the second highest annual total on record.
                                And with more than $1 billion in major development
                                projects either planned or underway in the next three
                                 years, there is reason to be optimistic about a bright future.

4   chooselethbridge.ca
Lethbridge Building Permit Value: Market Share
                  Institutional       Residential          Commercial           Industrial

    $350 M

    $300 M
                                                                                                             $89.7 M

    $250 M
                                                                                                             $11.3 M                 $168.3 M
                                                                                     $59.1 M
                          $50.9 M
    $200 M
                                                          $85.7 M
                          $28.7 M                                                    $23.4 M
                                                                                                             $137.3 M
     $150 M
                                                          $23.5 M                    $71.8 M                                          $14.8 M
                          $83.5 M
                                                          $39.2 M                                                                    $35.5 M
    $100 M

     $50 M                 $84.1 M                        $89.8 M                    $95.5 M                 $98.8 M                 $94.9 M

          0
                           2013                             2014                     2015                    2016                     2017

               Per Capita Building Permit Value Comparison (2017)
               Alberta Cities                                                                                                54%
                                                                                                                        The institutional sector accounts
   Red Deer                          $1,523                                                                              for 54% of total Building Permit
Medicine Hat                                  $1,799                                                                    Value which is primarily driven by
                                                                                                                           construction activity at the
 Lethbridge                                                            $3,192                                                University of Lethbridge.
    Calgary                                                                        $3,674

                                                                                                                        $360 M
  Edmonton                                                                              $3,816

           $0      $500     $1000       $1500          $2000   $2500    $3000       $3500 $4000

                                                                                                                            At $360 million, Cavendish
               Lethbridge Building Permit Values by Sector (2017)                                                         Farms new Potato Processing
                                                                                                                           Facility is the largest private
                                                                                                                         investment in the city’s history.
                                                                                 $168.3 M Institutional
                                                                                 $94.9 M       Residential

                                                                                                                              35%
                                               $168.3 M
                                                                                 $35.5 M       Commercial
                                                                                 $14.8 M       Industrial
                $14.8 M

                                                                                                                           Major Employers (business
               $35.5 M
                                                                                                                           that employ 100+ people)
                                                                                                                             account for 35% of the
                                                                                                                                local workforce.

                                  $94.9 M

                                                                                                                              A BRIGHT CHOICE:         for economic
                                                                                                                                                       diversity
Annual Comparison of Unemployment Rates: Alberta Cities

          12%
                                                                                                                  2013
          10%
                                                                                                                  2014
           8%
                                                                                                                  2015

                                                                                                          8.5%
                                                                                  8.1%
                                                                8.0%
           6%
                                                                                                                  2016

                                               6.1%
                            5.9%

           4%
                                                                                                                  2017
           2%
           0%
                  Lethbridge        Medicine Hat         Red Deer       Edmonton                  Calgary

        Unemployment Rate Comparison (2017): Alberta Cities

    Lethbridge                                                           5.9%

Medicine Hat                                                             6.1%

     Red Deer                                                                                     8.0%

    Edmonton                                                                                       8.1%

       Calgary                                                                                        8.5%

                 0%    1%           2%    3%            4%    5%        6%        7%          8%           9%

        Annual Comparison of Participation Rates: Alberta Cities

          80%
                                                                                                                  2013
          75%
                                                                                                                  2014
                                                                                                          74.2%

          70%
                                                                                  73.0%

                                                                                                                  2015
                                                                71.4%
                                               69.7%

          65%
                                                                                                                  2016
                            66.4%

          60%
                                                                                                                  2017
          55%
          50%
                   Medicine Hat Lethbridge               Red Deer       Edmonton              Calgary

        Participation Rate Comparison (2017): Alberta Cities

Medicine Hat                                66.4%

    Lethbridge                                                 69.7%

     Red Deer                                                             71.4%

    Edmonton                                                                              73.0%
       Calgary                                                                                    74.2%

                 62%    64%           66%              68%    70%         72%              74%            76%

6      chooselethbridge.ca
Lethbridge & Region Major Development Projects: 2018-2021
 PROJECT NAME                                                         COST (IN MILLIONS)      TIMELINE          SECTOR

 Cavendish Farms -Frozen Potato Plant                                            $360.0       2017-2019         Industrial

 University of Lethbridge - Destination Project                                  $280.0       2018-2019         Education, Training & Research

 ATB Centres - Phase 2 Leisure Complex                                            $109.5      2017-2019         Recreation & Leisure

 Electric Distribution Expension & Improvement - Annual Program                   $40.0       2018-2021         Electric Utility

 Waterbridge Middle School                                                         $20.4            2018        Education, Training & Research

 Cargill Rail Expansion                                                            $20.0            2018        Industrial

 All Saints Parish *                                                               $20.0      2017-2020         Community Supports

 Transit Terminal & Regional Park N’ Ride                                          $17.0      2017-2018         Transportation

 Curbside Recycling                                                                $16.3            2018        Waste & Recycling

 Water Treatment Plant - Residuals Management                                      $15.0      2017-2018         Water & Wastewater

 Yates Renewal                                                                     $13.4      2017-2018         Arts & Culture

 Distribution Renewal - Annual Program                                             $13.0      2018-2021         Electric Utility

 Annual Overlay Program                                                            $12.8      2018-2021         Transportation

 Water Treatment Plant - Process Redundancy                                         $12.1     2017-2021         Water & Wastewater

 University of Lethbridge - Kanai Residence Exterior Upgrades                      $12.0            2018        Education, Training & Research

 Substation 13.8 kV Switchgear Upgrades                                             $11.8     2017-2019         Electric Utility

 Waste & Recycling Centre - Disposal Cell Development & Closure                     $11.6     2017-2020         Waste & Recycling

 Wastewater Treatment Plant - Headworks & Clarifier Upgrades                        $11.4     2017-2018         Water & Wastewater

 University Drive - Community Stadium to Sunridge Blvd W                           $10.9     2019-2020          Transportation

 Wastewater Treatment Plant - Primary Clarifier Replacement                        $10.8      2018-2019         Water & Wastewater

 New Fire Station #5 - West                                                        $10.3     2018-2020          Community Supports

 3rd Avenue South (4th-8th St) - Reconstruction                                    $10.0      2017-2020         Transportation

 Water Reservoir Upgrades                                                           $9.4      2017-2021         Water & Wastewater

 Metis Trail - Temple Blvd to Coalbrook Gate                                        $6.9            2020        Transportation

 Bridge Rehabilitation Program                                                      $6.5      2018-2021         Transportation

 Landfill - Gas & Leachate Management System                                        $6.1      2017-2020         Waste & Recycling

 TOTAL                                                                          $1,067.2

 NOTES:
 1.   This list includes major projects identified as of April 2018
 2.   Major projects are valued at $5.0m or higher
 3. Project costs are calculated for the 2017-2021 period and do not including funding allocated outside of this time
      period with the exception of ATB Centre – Phase 2 Leisure Complex and University of Lethbridge – Destination Project
 4. Projects with an * have been proposed
 4.   Projects with an * have been proposed

                                                                                                                 A BRIGHT CHOICE:      for economic
                                                                                                                                       diversity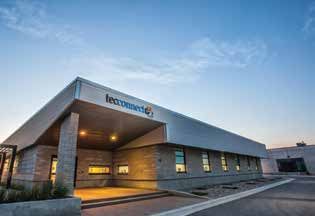
ENTREPRENEURSHIP
     Small business is a key driver of the local economy. The most
     recent data from Industry Canada shows small businesses in Alberta
     contributed 32% of provincial GDP and communities with incubator
     support have a leg up over those that don’t. In fact, Alberta small
     businesses with incubator support have an average 25 per cent
     growth rate, compared to the national average of five per cent.

     Through programs and services available at the Tecconnect centre for entrepreneurship
     and innovation, the University of Lethbridge’s AGILITY program and the Regional
     Innovation Network of Southern Alberta (RINSA), there is tremendous opportunity
     for businesses here to embrace innovation, grow and expand.

     With industry and institutional support within the community, Lethbridge is
     fostering an environment where companies can take root and thrive. In fact,
     local entrepreneurs are leading the way in industries including geospatial imaging,
     cloud-based accounting, automotive industry software, biotechnologies
     and the health industries along with new media and VR.

                                     Since opening in 2011, the companies in
                                     Tecconnect have created 165 new jobs with
                                      a combined incremental payroll of just over
                                      $5 million. Of those employed, 57% are
                                       Lethbridge post-secondary graduates.

8   chooselethbridge.ca
New Business Licenses in Lethbridge
Home-Based Regular
2013 208 106 314
2014 195 139 334
2015 256 155 411
2016 239 150 389
2017 240 143 383
0 50 100 150 200 250 300 350 400 450 500
New Regular Business Licenses in Lethbridge
2013 106
2014 139
2015 155
2016 150
2017 143
0 20 40 60 80 100 120 140 160 180
New Home-Based Business Licenses in Lethbridge
2013 208
2014 195
2015 256
2016 239
2017 240
0 50 100 150 200 250 300
A BRIGHT CHOICE: for economic
diversity% of Total Lethbridge Businesses by Employee Count
1-4 51%
5-9 20%
10-19 14%
20-49 10%
50-99 3%
100+ 2%
0% 10% 20% 30% 40% 50% 60%
383 51% $9 M
There were 383 new 51% of Lethbridge In 2017, Total Revenue
business licenses in 2017. businesses have 4 or reported by Tecconnect
less employees. companies was $9 million.
10 chooselethbridge.caLethbridge Small Business by Industry & Employee Size
% OF SMALL BUSINESSES
INDUSTRY
# OF EMPLOYEES PER BUSINESS: 1-4 5-9 10-19 20-49 50-99 TOTAL BY INDUSTRY
Construction 382 134 59 40 16 636 14%
Retail Trade 167 205 140 55 25 606 14%
Professional, Scientific and Technical Services 317 59 34 20 3 440 10%
Health Care & Social Assistance 239 76 49 25 11 417 9%
Other Services 225 85 42 29 3 386 9%
Agriculture, Forestry, Fishing & Hunting 179 46 37 16 2 282 6%
Accommodation & Food Services 23 48 69 91 16 249 6%
Wholesale Trade 89 53 48 34 3 228 5%
Transportation & Warehousing 133 28 20 19 4 207 5%
Real Estate & Rental and Leasing 168 20 10 6 1 206 5%
Finance & Insurance 111 26 27 18 1 184 4%
Manufacturing 49 33 30 27 14 170 4%
Administrative and Support, Waste 68 44 31 17 7 169 4%
Management and Remediation Services
Arts, Entertainment & Recreation 21 10 12 14 6 65 1%
Educational Services 13 8 3 8 0 38 1%
Mining, Quarrying, & Oil and Gas Extraction 24 7 4 1 0 38 1%
Management of Companies and Enterprises 17 3 5 5 1 33 1%
Information & Cultural Industries 7 3 4 9 3 27 1%
Public Administration 2 1 4 2 1 12 0%
Utilities 2 2 0 1 0 5 0%
TOTAL 2,236 891 628 437 117 4,398 100%
A BRIGHT CHOICE: for economic
diversityBRIGHT
PEOPLE
One of Lethbridge’s greatest assets is its diverse
and dynamic population. Over the past five years, our
population has grown by an average of 2.0% a year.
That’s nearly 150 new arrivals each month! With more
than a quarter of the adult population under the age of 34,
Lethbridge brims with a youthful energy.
Overall, Lethbridge has a well-balanced demographic profile and
a healthy mix of youth, workforce and seniors in the community.
Lethbridge is also a welcoming community that continues to support
and embrace diversity as evidenced in the increase of newcomers over
the past five years.
As home to two post-secondary institutions
(a rarity for a city of its size), Lethbridge is a
true campus community with more than 3,200
students who graduate from Lethbridge College
and the University of Lethbridge each year.
12 chooselethbridge.ca% of Population 25-64 with Apprenticeship Lethbridge College
or Trades Certification Graduates By Program
Kelowna 12%
Business 162
Edmonton 11%
Education 38
Lethbridge Health Services 313
10%
Saskatoon 10%
Languages, Social Sciences,
Arts & Humanities 187
Abbotsford-Mission 10%
Legal & Security 212
Regina 10%
Recreation 20
Victoria 9%
Physical, Natural &
Applied Sciences 192
Calgary 7%
Winnipeg 7% Trades & Technologists 378
Vancouver 7% TOTAL 1,502
0% 2% 4% 6% 8% 10% 12% 14% Sources: Lethbridge College,
Institutional Planning & Reporting, September 2017
% of Population 25-64 with a University University Of Lethbridge
Certification, Diploma, or Degree Graduates By Faculty
Calgary 38% Arts & Science 654
Vancouver 37% Education 207
Victoria 34%
Fine Arts 111
Winnipeg 32%
Health Sciences 218
Saskatoon 31%
Regina 30% Management 478
Edmonton 29% Graduate Studies 160
Lethbridge 23% TOTAL 1,828
Kelowna 21%
Notes: Students awarded combined degrees are included in
Abbotsford-Mission 19% the count of both degrees. School of Graduate Studies
includes all PH.D., Master and Graduate Certificate Programs.
Sources: University of Lethbridge, Department of
0% 5% 10% 15% 20% 25% 30% 35% 40% Institutional Analysis, August 2017
60% 3200 22%
60% of the city’s population More than 3,200 students who Approximately 22% of
(ages 25-64) have furthered graduate from Lethbridge post-secondary graduates
their post-secondary College and the University of stay and work in Lethbridge
education. Lethbridge each year. after graduation.
LETHBRIDGE
A BRIGHT CHOICE: for business
and investment
A BRIGHT CHOICE: for economic
diversityDemographic Growth as a Proportion of Population Growth: Lethbridge (2012 vs 2017)
30%
25%
25%
23%
20%
16%
15%
13%
12%
10%
5% 4%
3%
2% 2%
1%
0%
0-9 10-19 20-29 30-39 40-49 50-59 60-69 70-79 80-89 90+
30-39 Annual Population Growth (2017): Alberta Cities
This age demographic is
the fastest growing Edmonton 3.7%
proportion of the Lethbridge 1.4%
Lethbridge population.
Calgary 0.9%
Red Deer 0.6%
Medicine Hat 0.4%
22% 0% 0.5% 1.0% 1.5%
Source: Alberta Municipal Affairs Population List
2.0% 2.5% 3.0% 3.5% 4.0%
22% of the total number
of immigrants living in
Lethbridge arrived between
2011-2016.
% of Overall Immigrant Population by
Year of Arrival: Lethbridge CMA
24% 2011-2016
2006-2010 17%
22%
Of those immigrants who
arrived in Lethbridge 2001-2005 8%
between 2011 – 2016, 24%
were from the Philippines. 0% 5% 10% 15% 20% 25%
14 chooselethbridge.caAnnual Population Growth Rate in Alberta Cities
EDMONTON LETHBRIDGE CALGARY RED DEER
2013 0.0% 1.5% 2.6% 5.7%
2014 7.4% 2.9% 4.0% 1.5%
2015 0.0% 1.9% 3.0% 2.3%
2016 2.5% 2.1% 0.3% -1.0%
2017 3.7% 1.4% 0.9% 0.6%
*Source: Alberta Municipal Affairs Population List
% of Total Recent Immigrants (2011-2016)
by Place of Birth: Alberta
There are more than
Philippines 29% 70 parks and 200
kilometres of walking and
India 14%
running trails in the city.
China 5%
Pakistan 3%
United Kingdom 3%
0% 5% 10% 15% 20% 25% 30%
% of Total Recent Immigrants (2011-2016)
by Place of Birth: Lethbridge CMA
On average, Lethbridge
Philippines 24% has more than 320 days of
Nepal 9% sunshine each year.
United Kingdom 6%
Syria 4%
India 4%
0% 5% 10% 15% 20% 25%
A BRIGHT CHOICE: for economic
diversityLIVING
HERE
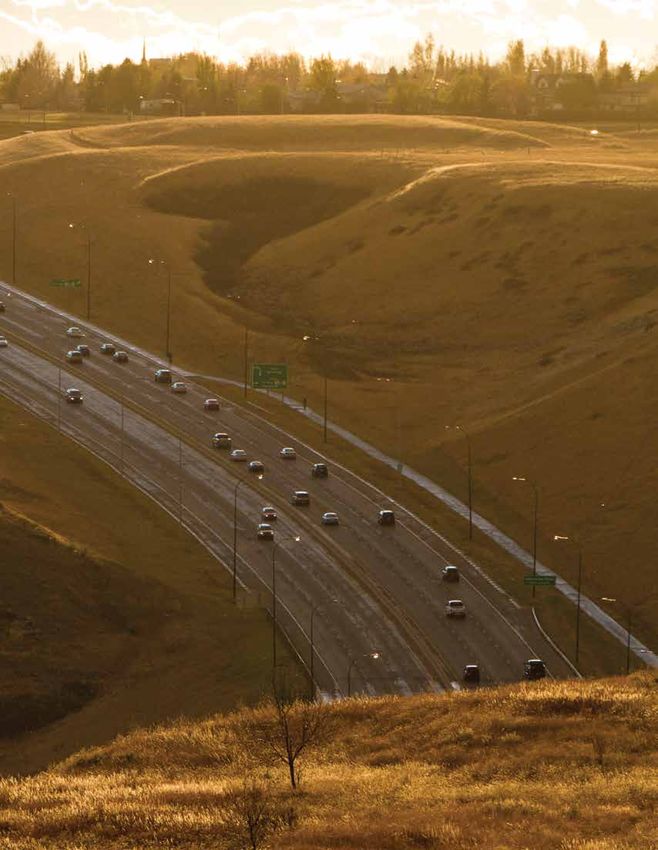
There are many concrete reasons Lethbridge is a great
location to start, grow or expand your business.
But what makes our community really shine
is the combination of city amenities and
small-town charm, the easy lifestyle it
affords and the sense of community
it fosters. With its low cost of living,
mild climate, short commute times and
wide range of recreation and cultural
opportunities, Lethbridge has something
for everyone to achieve a perfect
balance of work and life.
New Infrastructure Adding to Lethbridge Quality of Life
VALUE EXPECTED
CATEGORY PROJECT OUTCOME
(IN MILLIONS) COMPLETION
Arts & Culture Yates Memorial Centre Performing Arts Centre Upgrades $13.40 2018
Education, Training, & Research University of Lethbridge Destination Project $280.00 2019
Education, Training, & Research West Lethbridge Middle School Construction $22.90 2018
Education, Training, & Research Coalbanks Elementary School Construction $16.20 2017
Education, Training, & Research Wilson Middle School Modernization $14.80 2017
Education, Training, & Research University of Lethbridge Student Residence Upgrades $12.00 2018
Recreation & Leisure City of Lethbridge ATB Centre - Phase 2 $64.80 2019
Recreation & Leisure City of Lethbridge Legacy Park $9.00 2020
16 chooselethbridge.caDaily Commuting Duration of Less Than 15 Minutes:
Western Canadian CMAs
Lethbridge 48%
Red Deer 42%
Kelowna 36%
Regina 35%
Saskatoon 33%
Victoria 30%
Winnipeg 22%
Edmonton 21%
Vancouver 18%
Calgary 18%
0% 10% 20% 30% 40% 50%
Median Value of Dwellings to Income
Ratio: Western Canadian CMAs
Lethbridge has the highest
Lethbridge 3.97 proportion of people reporting
Regina 4.13 a daily commute time of less
Saskatoon 4.22
than 15 minutes of any CMA
in Western Canada.
Winnipeg 4.23
Edmonton 4.23
Calgary 4.52
Kelowna 6.66
Abbotsford-Mission 6.79
Victoria 8.40
Vancouver 11.01
Lethbridge has the lowest
0 2 4 6 8 10 12 dwelling-to-income ratio
of comparable CMA’s in
Western Canada making
it an affordable choice.
Median Value of Dwellings to Income Ratio:
Alberta Cities
Medicine Hat 3.81
Lethbridge 3.97
Red Deer 4.06
Edmonton 4.32
Lethbridge is home to
Calgary 4.52 more than 40 residential
neighbourhoods.
3.5 4.0 4.5 5.0
A BRIGHT CHOICE: for economic
diversityT
L
A
C
LETHBRIDGE
A BRIGHT CHOICE for economic
diversity
403-331-0022
info@chooselethbridge.ca
@chooseleth
chooselethbridge.caTHIS IS LETHBRIDGE. A BRIGHT CHOICE: for economic diversity
You can also read