Legion Park Apartments - Market Feasibility Analysis Warrenton, Warren County, Georgia
←
→
Page content transcription
If your browser does not render page correctly, please read the page content below
Market Feasibility Analysis

Legion Park Apartments

Warrenton, Warren County, Georgia

Prepared for:
TBG Residential

Effective Date: April 21, 2020

Site Inspection: April 21, 2020
Legion Park | Table of Contents

TABLE OF CONTENTS
EXECUTIVE SUMMARY.......................................................................................................... VI
1. INTRODUCTION .............................................................................................................. 1
A.    Overview of Subject..............................................................................................................................................1
B.    Purpose of Report.................................................................................................................................................1
C.    Format of Report ..................................................................................................................................................1
D.    Client, Intended User, and Intended Use .............................................................................................................1
E.    Applicable Requirements......................................................................................................................................1
F.    Scope of Work ......................................................................................................................................................1
G.    Report Limitations ................................................................................................................................................2
2.    PROJECT DESCRIPTION.................................................................................................... 3
A.    Project Overview ..................................................................................................................................................3
B.    Project Type and Target Market ...........................................................................................................................3
C.    Building Types and Placement..............................................................................................................................3
D.    Detailed Project Description.................................................................................................................................4
      1. Project Description.......................................................................................................................................4
      2. Other Proposed Uses ...................................................................................................................................4
      3. Proposed Timing of Development ...............................................................................................................4
3.    SITE EVALUATION ........................................................................................................... 5
A.    Site Analysis ..........................................................................................................................................................5
      1. Site Location.................................................................................................................................................5
      2. Existing Uses.................................................................................................................................................6
      3. Size, Shape, and Topography .......................................................................................................................6
      4. General Description of Land Uses Surrounding the Subject Site .................................................................7
      5. Specific Identification of Land Uses Surrounding the Subject Site...............................................................8
B.    Neighborhood Analysis.........................................................................................................................................9
      1. General Description of Neighborhood .........................................................................................................9
      2. Neighborhood Planning Activities................................................................................................................9
      3. Public Safety.................................................................................................................................................9
C.    Site Visibility and Accessibility ............................................................................................................................10
      1. Visibility ......................................................................................................................................................10
      2. Vehicular Access (Ingress/Egress) ..............................................................................................................10
      3. Availability of Public Transit and Inter-Regional Transit ............................................................................10
      4. Pedestrian Access.......................................................................................................................................11
      5. Accessibility Improvements under Construction and Planned ..................................................................11
      6. Environmental Concerns ............................................................................................................................11
D.    Residential Support Network..............................................................................................................................11
      1. Key Facilities and Services near the Subject Site........................................................................................11
      2. Essential Services .......................................................................................................................................13
      3. Commercial Goods and Services ................................................................................................................13
      4. Location of Low Income Housing ...............................................................................................................13
E.    Site Conclusion ...................................................................................................................................................15
4.    MARKET AREA DEFINITION ........................................................................................... 16
A.    Introduction........................................................................................................................................................16
B.    Delineation of Market Area ................................................................................................................................16
5.    COMMUNTIY DEMOGRAPHIC DATA.............................................................................. 18
A.    Introduction and Methodology ..........................................................................................................................18
B.    Trends in Population and Households................................................................................................................18
      1. Recent Past Trends.....................................................................................................................................18
      2. Projected Trends ........................................................................................................................................19
      3. Building Permit Trends...............................................................................................................................20

                                                                                                                                                                   Pa g e i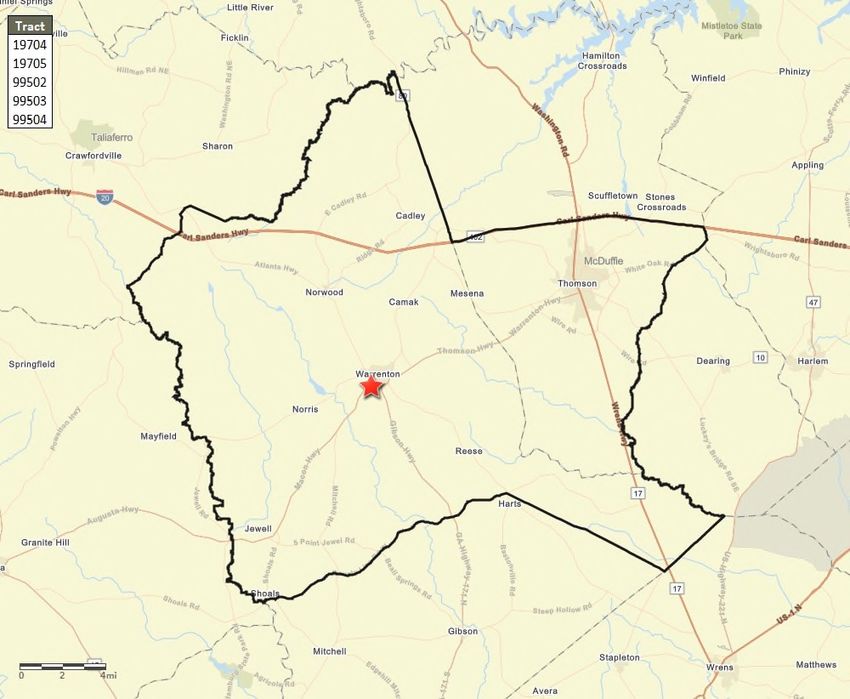
Legion Park | Table of Contents

C.   Demographic Characteristics..............................................................................................................................20
     1. Age Distribution and Household Type .......................................................................................................20
     2. Household Trends by Tenure .....................................................................................................................22
     3. Renter Household Characteristics..............................................................................................................23
     4. Income Characteristics ...............................................................................................................................24
     5. Demographic Conclusions..........................................................................................................................25
6.   EMPLOYMENT TREND................................................................................................... 26
A.   Introduction........................................................................................................................................................26
B.   Labor Force, Resident Employment, and Unemployment..................................................................................26
     1. Trends in County Labor Force and Resident Employment.........................................................................26
     2. Trends in County Unemployment Rate......................................................................................................26
C.   Commutation Patterns .......................................................................................................................................27
D.   At-Place Employment .........................................................................................................................................28
     1. Trends in Total At-Place Employment........................................................................................................28
     2. At-Place Employment by Industry Sector...................................................................................................29
     3. Major Employers ........................................................................................................................................30
     4. Recent Economic Expansions, Contractions, and Projections....................................................................31
     5. Local Employment Base .............................................................................................................................32
     6. Conclusions on Local Economics ................................................................................................................32
7.   PROJECT-SPECIFIC AFFORDABILITY & DEMAND ANALYSIS ............................................. 33
A.   Affordability Analysis ..........................................................................................................................................33
     1. Methodology..............................................................................................................................................33
     2. Affordability Analysis .................................................................................................................................34
     3. Conclusions of Affordability .......................................................................................................................35
B.   Demand Estimates and Capture Rates ...............................................................................................................35
     1. Methodology..............................................................................................................................................35
     2. Demand Analysis ........................................................................................................................................36
8.   COMPETITIVE HOUSING ANALYSIS ................................................................................ 38
A.   Introduction and Sources of Information ...........................................................................................................38
B.   Overview of Market Area Housing Stock............................................................................................................38
C.   Survey of General Occupancy Rental Communities ...........................................................................................39
     1. Introduction to the Rental Housing Survey................................................................................................39
     2. Location......................................................................................................................................................40
     3. Size of Communities...................................................................................................................................40
     4. Age of Communities...................................................................................................................................40
     5. Structure Type............................................................................................................................................40
     6. Vacancy Rates ............................................................................................................................................41
     7. Rent Concessions .......................................................................................................................................41
     8. Absorption History .....................................................................................................................................41
D.   Analysis of Product Offerings .............................................................................................................................41
     1. Payment of Utility Costs.............................................................................................................................41
     2. Unit Features..............................................................................................................................................41
     3. Parking .......................................................................................................................................................42
     4. Community Amenities................................................................................................................................42
     5. Unit Distribution.........................................................................................................................................43
     6. Effective Rents ...........................................................................................................................................43
     7. Scattered Site Rentals ................................................................................................................................43
     8. Surveyed Communities Outside the Legion Park Market Area..................................................................44
     9. DCA Adjusted Market Rent ........................................................................................................................45
E.   Multi-Family Pipeline..........................................................................................................................................46
F.   Housing Authority Data ......................................................................................................................................47
G.   Existing Low-Income Rental Housing..................................................................................................................47
H.   Impact of Abandoned, Vacant, or Foreclosed Homes ........................................................................................48

                                                                                                                                                              Pag e ii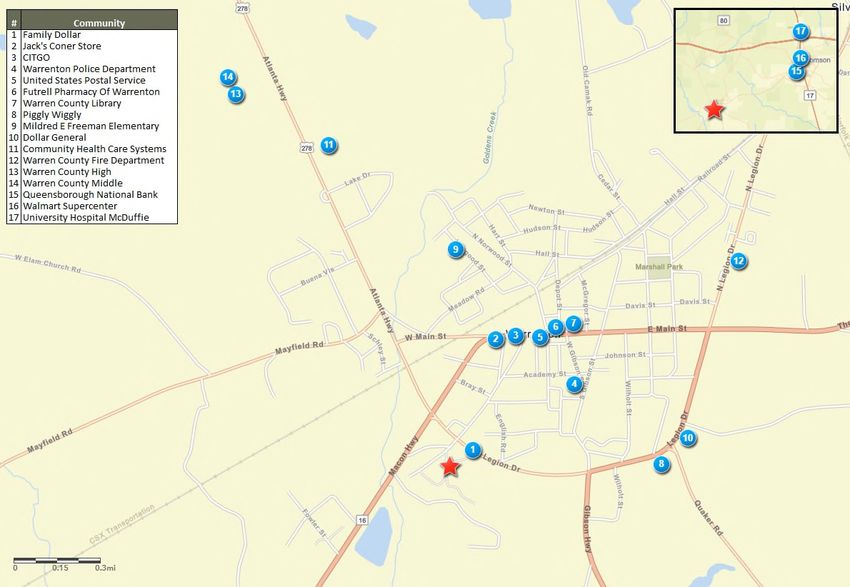
Legion Park | Table of Contents

9.    FINDINGS AND CONCLUSIONS....................................................................................... 50
A.    Key Findings ........................................................................................................................................................50
      1. Site and Neighborhood Analysis ................................................................................................................50
      2. Economic Context ......................................................................................................................................50
      3. Population and Household Trends.............................................................................................................50
      4. Demographic Trends ..................................................................................................................................51
      5. Competitive Housing Analysis ....................................................................................................................51
B.    Product Evaluation .............................................................................................................................................52
C.    Price Position ......................................................................................................................................................53
10.       ABSORPTION AND STABILIZATION RATES .................................................................. 56
A.    Absorption Estimate ...........................................................................................................................................56
B.    Impact on Existing Market..................................................................................................................................56
11.       INTERVIEWS.............................................................................................................. 57
12.       CONCLUSIONS AND RECOMMENDATIONS ................................................................. 58
13.       APPENDIX 1 UNDERLYING ASSUMPTIONS AND LIMITING CONDITIONS ..................... 59
14.       APPENDIX 2 ANALYST CERTIFICATIONS...................................................................... 61
15.       APPENDIX 3 NCHMA CERTIFICATION ......................................................................... 62
16.       APPENDIX 4 ANALYST RESUMES ................................................................................ 63
17.       APPENDIX 5 DCA CHECKLIST ...................................................................................... 66
18.       APPENDIX 6 NCHMA CHECKLIST ................................................................................ 71
19.       APPENDIX 7 RENTAL COMMUNITY PROFILES ............................................................. 74

                                                                                                                                                              Pag e ii i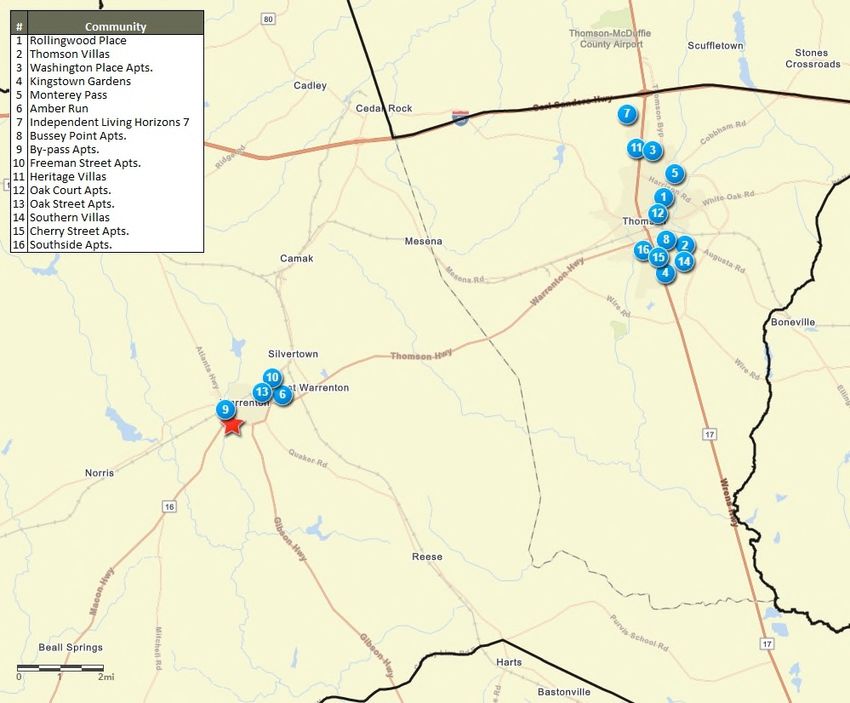
Legion Park | Table of Contents

TABLES, FIGURES AND MAPS
Table 1 Legion Park Detailed Project Summary............................................................................................................4
Table 2 Key Facilities and Services..............................................................................................................................12
Table 3 Subsidized Communities, Legion Park Market Area ......................................................................................14
Table 4 Population and Household Projections..........................................................................................................19
Table 5 Persons per Household, Legion Park Market Area ........................................................................................19
Table 6 Building Permits by Structure Type, Tri-County Market Area........................................................................20
Table 7 Age Distribution .............................................................................................................................................21
Table 8 Households by Household Type......................................................................................................................21
Table 9 Households by Tenure, 2000-2020 .................................................................................................................22
Table 10 Households by Tenure, 2020-2022 ...............................................................................................................23
Table 11 Renter Households by Age of Householder ................................................................................................23
Table 12 Renter Households by Household Size .........................................................................................................24
Table 13 Household Income ........................................................................................................................................24
Table 14 Household Income by Tenure .......................................................................................................................25
Table 15 Labor Force and Unemployment Rates........................................................................................................27
Table 16 2014-2018 Commuting Patterns, Legion Park Market Area .........................................................................28
Table 17 Major Employers, Warren County ...............................................................................................................31
Table 18 2022 Total and Renter Income Distribution.................................................................................................33
Table 19 2019 LIHTC Income and Rent Limits, National Non-Metro .........................................................................34
Table 20 Affordability Analysis, Legion Park...............................................................................................................35
Table 21 Substandard and Cost Burdened Calculations ............................................................................................36
Table 22 DCA Demand by Income Level ....................................................................................................................37
Table 23 DCA Demand by Floor Plan .........................................................................................................................37
Table 24 Occupied Unit by Structure Type and Tenure..............................................................................................38
Table 25 Dwelling Units by Year Built and Tenure......................................................................................................39
Table 26 Value of Owner Occupied Housing Stock......................................................................................................39
Table 27 Rental Summary, Surveyed Communities in the Legion Park Market Area..................................................41
Table 28 Utility Arrangement and Unit Features.......................................................................................................42
Table 29 Community Amenities ..................................................................................................................................42
Table 30 Unit Distribution, Size, and Pricing................................................................................................................43
Table 31 Scattered Site Rentals, Legion Park Market Area .........................................................................................44
Table 32 Unit Distribution, Size, and Pricing - Outside the Legion Park Market Area .................................................45
Table 33 Average Adjusted Market Rents ...................................................................................................................46
Table 34 Adjusted Market Rent and Rent Advantage Summary ................................................................................46
Table 35 Subsidized Communities, Legion Park Market Area ....................................................................................47
Table 36 Foreclosure Rate and Recent Foreclosure Activity, ZIP Code 30828 ...........................................................49

Figure 1 Site Plan ...........................................................................................................................................................3
Figure 2 Views of Subject Site........................................................................................................................................6
Figure 3 Satellite Image of Subject Site .........................................................................................................................7
Figure 4 Views of Surrounding Land Uses .....................................................................................................................8
Figure 5 Legion Park Market Area Households by Tenure 2000 to 2020 ..................................................................22
Figure 6 At-Place Employment ...................................................................................................................................29
Figure 7 Total Employment by Sector, 2019 (Q3).......................................................................................................30
Figure 8 Change in Employment by Sector 2011-2019 (Q3).......................................................................................30
Figure 9 Price Position – Legion Park...........................................................................................................................54

Map 1 Site Location ......................................................................................................................................................5
Map 2 2019 CrimeRisk, Subject Site and Surrounding Areas .....................................................................................10
Map 3 Location of Key Facilities and Services ............................................................................................................12
Map 4 Subsidized Rental Communities ......................................................................................................................14
Map 5 Legion Park Market Area .................................................................................................................................17
Map 6 Major Employers, Warren County....................................................................................................................31

                                                                                                                                                                 Pa g e iv
Legion Park | Table of Contents

Map 7 Surveyed Rental Communities, Legion Park Market Area...............................................................................40
Map 8 Surveyed Rental Communities, Outside the Legion Park Market Area ...........................................................45
Map 9 Subsidized Rental Communities ......................................................................................................................48

                                                                                                                                                 Pa g e v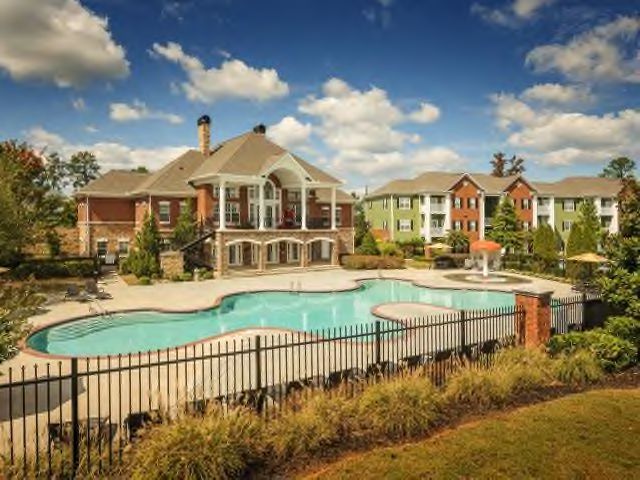
Legion Park | Executive Summary
EXECUTIVE SUMMARY
TBG Residential has retained Real Property Research Group, Inc. (RPRG) to conduct a comprehensive
market feasibility analysis of Legion Park, a proposed affordable rental community in Warrenton,
Warren County, Georgia. As proposed, Legion Park will be financed in part with nine percent Low
Income Housing Tax Credits (LIHTC) allocated by the Georgia Department of Community Affairs (DCA)
and will contain 72 units.
1. Project Description
The subject site is on the south/east side of Parham Street Extension roughly one-half mile
southwest of downtown Warrenton, Warren County, Georgia. The newly constructed
community will comprise 72 income and rent restricted units through the Low-Income
Housing Tax Credit (LIHTC) program with 20 units targeting 40 percent AMI, 40 units targeting
60 percent AMI, and 12 units targeting 80 percent AMI.
Legion Park’s proposed general occupancy (family) units will target very low to moderate
income renter households earning up to 40 percent, 60 percent, and 80 percent of the Area
Median Income (AMI). The proposed unit mix includes one, two, and three-bedroom units,
which will attract a range of households including singles, roommates, couples, and families.
A detailed summary of the newly constructed subject property, including the rent and unit
configuration, is shown in the table below. Although Legion Park will accept Housing Choice
Vouchers (HCV), it does not have project based rental assistance.
Unit Mix/Rents
Income Heated Sq. Net Utility Gross
Type Bed Bath #
Target Feet Rent Allowance Rent
LIHTC 1 1 40% 2 800 $295 $105 $400
LIHTC 1 1 60% 6 800 $576 $105 $681
LIHTC 1 1 80% 4 800 $804 $105 $909
Subtotal 12 16.7%
LIHTC 2 2 40% 10 1,000 $371 $129 $500
LIHTC 2 2 60% 22 1,000 $671 $129 $800
LIHTC 2 2 80% 4 1,000 $931 $129 $1,060
Subtotal 36 50.0%
LIHTC 3 2 40% 8 1,200 $427 $163 $590
LIHTC 3 2 60% 12 1,200 $737 $163 $900
LIHTC 3 2 80% 4 1,200 $997 $163 $1,160
Subtotal 24 33.3%
Total 57.8% 72
Rents include: trash Source: TBG Residential
Legion Park will offer a refrigerator, stove/range, dishwasher, garbage disposal, microwave,
washer and dryer connections, ceiling fans, and central heating and air-conditioning which
will be comparable to the newest LIHTC community in the market area (Rollingwood Place)
and superior to the other two surveyed communities in the market area. The proposed unit
features will be competitive in the Legion Park Market Area.
Legion Park will include a clubhouse/community room, laundry facilities, playground, and
fenced community garden. Although the subject will not offer a fitness center or computer
area similar to the existing LIHTC communities, Legion Park will offer a fenced gardening area
Pa g e v i
Legion Park | Executive Summary
which will be unique to the market area. The proposed amenities are acceptable and will be
well received by the target market of very low to moderate income renter households.
2. Site Description / Evaluation
The subject site, on Parham Street Extension, is a suitable location for an affordable rental housing
community as it is compatible with surrounding land uses and has access to amenities, services,
employers, and transportation arteries.
The subject site is primarily undeveloped with a former overgrown baseball/softball field in
the western portion of the site which will be demolished. The site is relatively flat.
The site for Legion Park is in an established neighborhood in southwestern Warrenton.
Residential uses are common in the immediate area including modest single-family detached
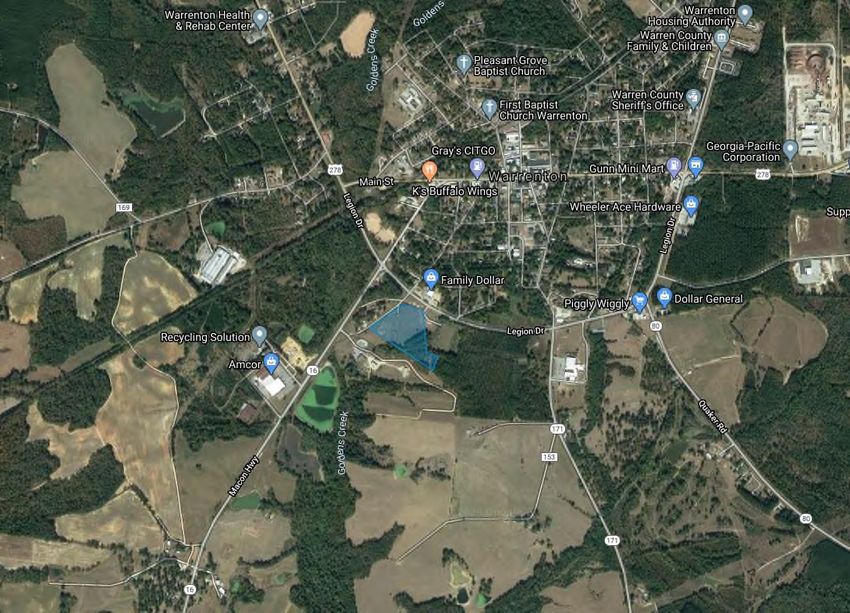
homes and mobiles homes. Additional land uses surrounding the site include Family Dollar
just north of the site, light industrial uses to the southwest, and Warren County Solid Waste
Center to the south. Downtown Warrenton is roughly one-half mile north of the site with
several small retailers, restaurants, and municipal services.
Legion Park will have good visibility from Legion Drive and U.S. Highway 278 is within one-half
mile of the site connecting Warrenton to employment in the region including in Thomson
roughly 10 miles to the northeast.
The positive aspects of the site are proximity to traffic arteries, neighborhood services, and
convenient access to employment; RPRG did not identify any negative attributes.
Neighborhood amenities and services are within 1.3 miles of the site including shopping,
convenience stores, a pharmacy, a grocery store, medical facilities, and schools. The recently
built Warren County Senior Center is just over one-half mile east of the site and the closest
regional medical center (University Hospital McDuffie) is roughly 16 miles to the northeast in
Thomson.
The subject site’s CrimeRisk is below the national average of 100. The site’s crime risk is less
than the location of nearly all surveyed communities. Taking this into account along with field
observations at the time of the site visit, we do not expect crime or the perception of crime
to impact the subject property’s marketability.
The subject site is suitable for the proposed development. RPRG did not identify any negative
land uses that would affect the proposed development’s viability in the marketplace.
3. Market Area Definition
The Legion Park Market Area comprises all census tracts in Warren County and three census
tracts in McDuffie County including the city of Thomson. The areas included in the Legion
Park Market Area are those most comparable to the subject site’s immediate neighborhood
and is where prospective tenants are most likely to originate. Based on the similarities of the
housing stock and ease of access via several major thoroughfares, we believe households
living throughout the Legion Park Market Area would consider the subject site as an
acceptable shelter location. Interstate 20 crosses through the northern portion of the Legion
Park Market Area and U.S. Highway 278 connects Warrenton to Thomson to the east; several
state highways provide additional connectivity in the Legion Park Market Area. The market
area is bound by county lines to the north, south, and west while it does not extend further
east due to distance. The three tracts in McDuffie County to the east are included in the
market area due to convenient access via U.S. Highway 278 and Thomson’s generally similar
neighborhood composition compared to Warrenton.
Pag e v ii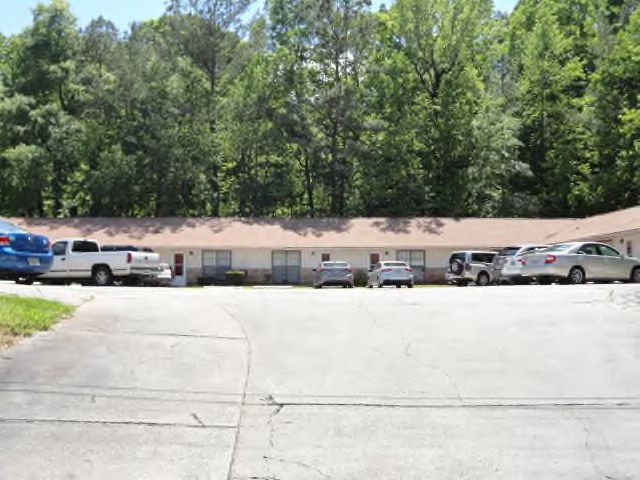
Legion Park | Executive Summary
The boundaries of the Legion Park Market Area and their approximate distance from the
subject site are Taliaferro County / Wilkes County / Interstate 20 to the north (13.9 mile),
Sweetwater Creek to the east (12.2 miles), Glascock County to the south (8.1 miles), and
Hancock County to the west (9.1 miles).
4. Community Demographic Data
The Legion Park Market Area has had modest household loss since 2010 with modest losses
expected to continue over the next two years; however, the number of renter households has
increased since 2010 and the renter household base is projected to remain steady through
2022.
The Legion Park Market Area added 88 net people (0.4 percent) and 139 households (1.8
percent) from 2000 to 2010.
Based on Esri data, the Legion Park Market Area’s population and household base decreased
slightly from 2010 to 2020 with annual losses of 25 people (0.1 percent) and 13 households
(0.2 percent). The Legion Park Market Area contains an estimated 19,942 people and 7,662
households in 2020. Esri projections suggest the market area will lose an annual average of
34 people (0.2 percent) and 16 households (0.2 percent) over the next two years resulting in
19,875 people and 7,630 households in the Legion Park Market Area in 2022.
Adults age 35-61 comprised 32.7 percent of the population in the Legion Park Market Area.
Children/Youth under the age of 20 account for 26.0 percent of the Legion Park Market Area’s
population while Seniors ages 62 and older account for nearly one-quarter (23.2 percent) of
the population. Young Adults age 20-34 are the least common at 18.0 percent of the Legion
Park Market Area’s population.
Multi-person households without children were the most common household type in the
Legion Park Market Area at 37.9 percent, followed by households with children at 35.7
percent. Single-person households accounted for 26.4 percent of Legion Park Market Area
households.
The Legion Park Market Area’s 2020 renter percentage is 39.9 percent compared to 34.6
percent in the Tri-County Market Area. The Legion Park Market Area added 678 net renter
households since 2000 (28.5 percent net growth) while it lost 666 owner households. RPRG
projects the Legion Park Market Area renter household base to remain steady over the next
two years while all household loss will be among owner households.
Working age households (age 25 to 54 years) form the core of Legion Park Market Area renter
households totaling 55.4 percent. Roughly 36 percent of the Legion Park Market Area’s renter
households are ages 55 or older while 8.3 percent are under 25 years old.
The majority (55.3 percent) of renter households in the Legion Park Market Area had one or
two people including 31.5 percent with one person. Roughly one-third (33.1 percent) of
Legion Park Market Area’s households had three or four people and 11.6 percent had 5+
people.
The Legion Park Market Area’s 2020 median income of $38,434 is $3,612 or 8.6 percent lower
than the Tri-County Market Area’s median of $42,046. RPRG estimates that the median
income of Legion Park Market Area households by tenure is $25,173 for renters and $52,937
for owner households. Roughly half (49.7 percent) of renter households earn less than
$25,000, 28.8 percent earn $25,000 to $49,999, and 11.6 percent earn $50,000 to $74,999.
Foreclosures and abandoned homes are not expected to impact the demand for the subject
property or its ability to achieve and maintain stabilized occupancy.
Pag e v ii i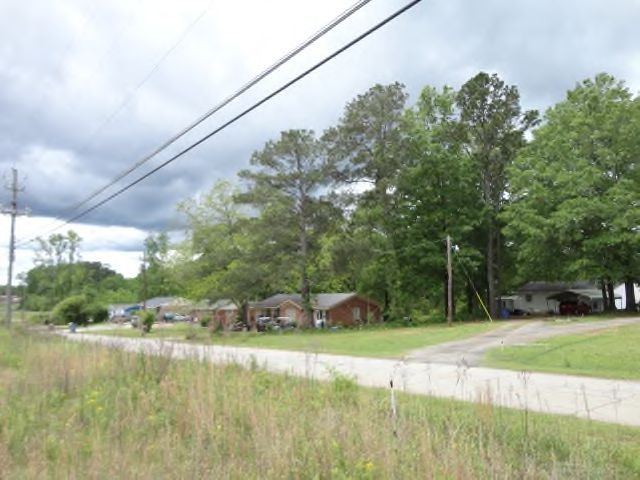
Legion Park | Executive Summary
5. Economic Data
Warren County’s economy is growing with job growth over the past seven years and a decreasing
unemployment rate which is roughly one-quarter the peak during the recession-era.
Warren County added jobs in six of the past seven years with the net addition of 470 jobs
(44.5 percent) since 2012; this growth is more than double the 198 jobs lost from 2008 to
2011 during the recession-era.
More than three-quarters (77.0 percent) of Warren County’s jobs are in the Trade-
Transportation-Utilities, Manufacturing, or Government sectors. The Education-Health
sector accounts for 10.7 percent of the county’s jobs.
The county’s 2019 unemployment rate of 5.0 percent is roughly one-quarter of its recession-
era high pf 18.1 percent in 2009 and within roughly a percentage point of state and national
unemployment rates. The county’s unemployment rate has dropped from 7.8 percent in 2015
to 4.7 percent in 2019.
Georgia-Pacific recently completed a lumber facility in Warrenton and expanded employment
by 80 people while Heart Wood Products is nearing completion of a pallet production facility
which will employ 100 people once completed in late 2020.
Warren County’s economy is growing with job growth in six of the past seven years and a
decreasing unemployment rate. The economy is expected to continue growing given the
announced job expansions which will strengthen demand for rental housing in the county.
6. Project Specific Affordability and Demand Analysis:
Legion Park will contain 72 LIHTC units reserved for households earning at or below 40
percent, 60 percent, or 80 percent of the Area Median Income (AMI).
The proposed units at 40 percent AMI will target renter householders earning from $13,714
to $26,160. The 20 proposed units at 40 percent AMI would need to capture 2.6 percent of
the 779 income-qualified renter households to lease-up.
The proposed units at 60 percent AMI will target renter householders earning from $23,349
to $39,240. The 40 proposed units at 60 percent AMI would need to capture 5.8 percent of
the 695 income-qualified renter households to lease-up.
The proposed units at 80 percent AMI will target renter householders earning from $31,166
to $52,320. The 12 proposed units at 80 percent AMI would need to capture 1.9 percent of
the 633 income-qualified renter households to lease-up.
The project’s overall affordability renter capture rate is 4.4 percent among 1,647 income-
qualified renter households.
The project’s affordability capture rates by floor plan and overall indicate a sufficient number
of income-qualified renter households will exist within the Legion Park Market Area for the
units proposed at Legion Park.
DCA demand capture rates for the subject property are 5.1 percent for 40 percent AMI units,
11.4 percent for 60 percent AMI units, and 3.8 percent for 80 percent AMI units. The project’s
overall capture rate is 8.7 percent. Capture rates by floor plan within each AMI level range
from 1.1 to 17.7 percent and capture rates by floor plan are 2.5 percent for one-bedroom
units, 9.5 percent for two-bedroom units, and 10.7 percent for three-bedroom units.
Pag e ixLegion Park | Executive Summary
All demand capture rates are well below DCA thresholds indicating sufficient demand for the
units proposed at Legion Park.
7. Competitive Rental Analysis
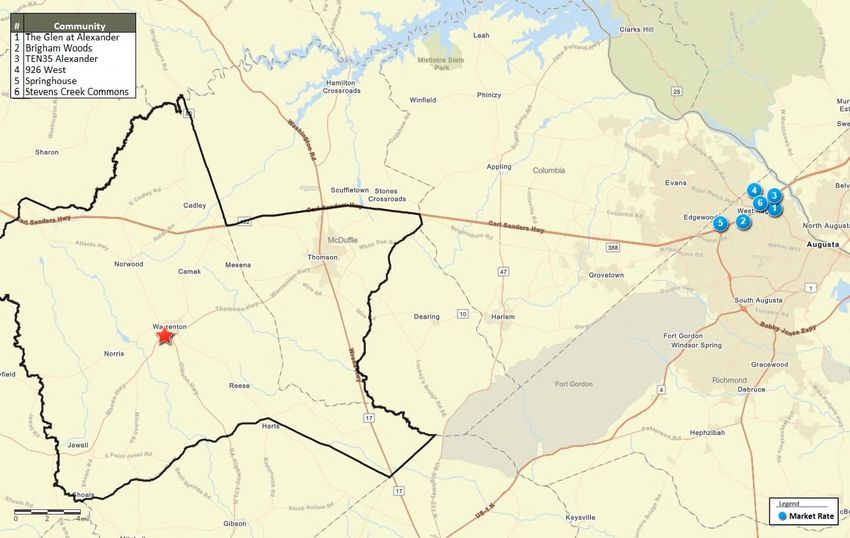
RPRG surveyed three multi-family rental communities in the Legion Park Market Area including the
only two LIHTC communities without deep subsidies in the market area. The rental market was
performing well with limited vacancies. We also surveyed six market rate communities outside the
market area in Augusta to gain insight into market rate rents in the region.
The surveyed LIHTC communities inside the market area have 60 to 72 units while the
market rate community has 17 units. Two of three communities offer garden apartments
while Thomson Villas (LIHTC) offers townhomes.
The surveyed communities inside the market area combine to offer 149 units of which
three units or 2.0 percent were reported vacant. The three vacancies are at the LIHTC
communities which combine for 132 units for an aggregate vacancy rate of 2.3 percent.
The newest community in the market area (Rollingwood Place) was placed in service in
2015; absorption data is neither available nor relevant.
Among the surveyed communities inside the market area, net rents, unit sizes, and rents
per square foot were as follows:
o One-bedroom effective rents range from $485 to $554 and average $523 per
month. The average one-bedroom unit size is 750 square feet, resulting in a net
rent per square foot of $0.70.
o Two-bedroom effective rents range from $330 to $755 and average $580 per
month. The average two-bedroom unit size is 930 square feet, resulting in a net
rent per square foot of $0.62.
o Three-bedroom effective rents range from $374 to $864 and average $664 per
month. The average three-bedroom unit size is 1,142 square feet, resulting in a
net rent per square foot of $0.58.
The 60 percent AMI units are the highest-priced units in the market area with rents
significantly higher than rents at the older market rate community with less extensive unit
features.
Among the surveyed communities outside the market area, net rents, unit sizes, and
rents per square foot were as follows:
o One-bedroom effective rents range from $758 to $1,133 and average $945 per
month. The average one-bedroom unit size is 792 square feet, resulting in a net
rent per square foot of $1.19.
o Two-bedroom effective rents range from $845 to $1,250 and average $1,066 per
month. The average two-bedroom unit size is 1,075 square feet, resulting in a net
rent per square foot of $0.99.
o Three-bedroom effective rents range from $1,265 to $1,424 and average $1,353
per month. The average three-bedroom unit size is 1,351 square feet, resulting in
a net rent per square foot of $1.00.
The “adjusted market rents” among the closest comparable market rate communities are
$945 for one-bedroom units, $1,066 for two-bedroom units, and $1,353 for three-
bedroom units. The proposed 40 percent AMI rents have rent advantages of at least 187
percent while the proposed 60 percent AMI rents have rent advantages of at least 58
percent. The proposed 80 percent AMI rents have rent advantages ranging from 14.5 to
35.7 percent. While the communities included in the adjusted market rent analysis have
superior locations due to their proximity to employment concentrations and community
Pa g e xLegion Park | Executive Summary
amenities near Augusta, the subject’s 80 percent AMI rents are $135 to $356 below these
adjusted market rents which is appropriate.
RPRG did not identify any multi-family rental communities as planned, approved, or under
construction in the Legion Park Market Area. The most recent LIHTC allocation in the
market area was for Rollingwood Place in 2014.
8. Absorption/Stabilization Estimate
Based on the product to be constructed and the factors discussed through the report, we
expect Legion Park to lease-up at a rate of 12 units per month. At this rate, the subject
property will reach a stabilized occupancy of at least 93 percent within six months.
The Legion Park Market Area’s rental market is performing well with a stabilized aggregate
vacancy rate of 2.0 percent; the market area’s limited supply of LIHTC units is 97.7 percent
occupied. We do not believe that the construction of the 72 units at Legion Park will have a
negative impact on existing communities in the market area including those with tax credits.
The proposed units will fill a void for new and modern rental housing in the Legion Park
Market Area and Legion Park’s rents are reasonable.
9. Overall Conclusion / Recommendation
Based on acceptable affordability/demand capture rates and strong rental market conditions,
sufficient demand exists to support the proposed units at Legion Park. As such, RPRG believes that
the proposed Legion Park will be able to successfully reach and maintain a stabilized occupancy of at
least 93 percent following its entrance into the rental market. The subject property will be
competitively positioned with the existing LIHTC communities in the Legion Park Market Area and the
units will be well received by the target market.
This market study was completed based on the most recent available data, which does not reflect
the potential impact of the COVID-19 pandemic on demographic and economic trends as well as
housing demand. At this stage, we do not believe demand for affordable rental housing will be
reduced in the long term due to economic losses related to COVID-19. Demand for rental housing,
especially affordable housing, is projected to increase over the next several years partially at the
expense of market rate rental housing and for-sale housing.
We do not believe that the proposed development of Legion Park will have a negative impact on the
existing communities in the market area including those with tax credits. We recommend proceeding
with the project as planned.
Pag e xiLegion Park | Executive Summary
10. DCA Summary Table:
Large Household Average
Units Renter Income Total Adjusted Net Capture Market Rents Proposed
Income/Unit Size Income Limits Size Adjustment Supply Market
Proposed Qualification % Demand Demand Demand Rate Band* Rents
(3+ Persons) Rent*
40% AMI $13,714 - $26,160
One Bedroom Units 2 11.7% 181 181 0 181 1.1% $945 $758 - $1,133 $295
Two Bedroom Units 10 10.0% 154 154 0 154 6.5% $1,066 $845 - $1,250 $371
Three Bedroom Units 8 12.0% 185 44.7% 83 0 83 9.7% $1,353 $1,265 - $1,424 $427
60% AMI $23,349 - $39,240
One Bedroom Units 6 9.8% 151 151 0 151 4.0% $945 $758 - $1,133 $576
Two Bedroom Units 22 8.1% 125 125 0 125 17.7% $1,066 $845 - $1,250 $671
Three Bedroom Units 12 10.2% 158 44.7% 70 0 70 17.0% $1,353 $1,265 - $1,424 $737
80% AMI $31,166 - $52,320
One Bedroom Units 4 9.3% 144 144 0 144 2.8% $945 $758 - $1,133 $804
Two Bedroom Units 4 6.6% 102 102 0 102 3.9% $1,066 $845 - $1,250 $931
Three Bedroom Units 4 10.5% 161 44.7% 72 0 72 5.5% $1,353 $1,265 - $1,424 $997
By Bedroom
One Bedroom Units 12 30.9% 476 476 0 476 2.5%
Two Bedroom Units 36 24.7% 381 381 0 381 9.5%
Three Bedroom Units 24 32.7% 504 44.7% 225 0 225 10.7%
Project Total $13,714 - $52,320
40% AMI $13,714 - $26,160 20 25.5% 393 0 393 5.1%
60% AMI $23,349 - $39,240 40 22.7% 351 0 351 11.4%
80% AMI $31,166 - $52,320 12 20.7% 319 0 319 3.8%
Total Units $13,714 - $52,320 72 53.8% 830 0 830 8.7%
Adjusted Market Rent calculated utilizing communities outside the market area*
SUMMARY TABLE:
Development Name: Legion Park Apartments Total # Units: 72
Location: Parham Street Extension, Warrenton, Warren County, GA # LIHTC Units: 72
North: Taliaferro County / Wilkes County / Interstate 20, East: Sweetwater Creek, South:
PMA Boundary: Glascock County, West: Hancock County
Farthest Boundary Distance to Subject: 13.9 miles
RENTAL HOUSING STOCK – (found on pages 4, 41, 46)
Type # Properties Total Units Vacant Units Average
Occupancy
All Rental Housing 3 149 3 98.0%
Market-Rate Housing 1 17 0 100.0%
Assisted/Subsidized Housing not to
include LIHTC
LIHTC 2 132 3 97.7%
Stabilized Comps 3 149 3 98.0%
Properties in construction & lease up
Totals above include only communities inside the market area.
Subject Development Average Market Rent Highest Unadjusted
Comp Rent*
# # # Proposed Per Unit Per SF Advantage Per Unit Per SF
Units Bedrooms Baths Size (SF) Tenant Rent
2 1 1 800 $295 $945 $1.19 220.4% $1,095 $1.37
6 1 1 800 $576 $945 $1.19 64.1% $1,095 $1.37
4 1 1 800 $804 $945 $1.19 17.6% $1,095 $1.37
10 2 2 1,000 $371 $1,066 $0.99 187.3% $1,280 $1.19
22 2 2 1,000 $671 $1,066 $0.99 58.8% $1,280 $1.19
4 2 2 1,000 $931 $1,066 $0.99 14.5% $1,280 $1.19
8 3 2 1,200 $427 $1,353 $1.00 216.7% $1,485 $1.24
12 3 2 1,200 $737 $1,353 $1.00 83.5% $1,485 $1.24
4 3 2 1,200 $997 $1,353 $1.00 35.7% $1,485 $1.24
Includes communities inside and outside the market area*
NOTE: 70% or 80% unit designations are not allowed where 70% and 80% rents are at or above market rents.
CAPTURE RATES (found on page 37)
Targeted Population 40% AMI 60% AMI 80% AMI Overall
Capture Rate 5.1% 11.4% 3.8% 8.7%
Pa g e xi iLegion Park | Introduction
1. INTRODUCTION
A. Overview of Subject
The subject of this report is Legion Park, a proposed affordable multi-family rental community in
Warrenton, Warren County, Georgia. Legion Park will be newly constructed and financed in part with
Low Income Housing Tax Credits (LIHTC) allocated by the Georgia Department of Community Affairs
(DCA). Legion Park will comprise 72 rental units including 20 units targeting households earning up to
40 percent of the Area Median Income (AMI), adjusted for household size, 40 units targeting 60
percent AMI, and 12 units targeting 80 percent AMI.
B. Purpose of Report
The purpose of this market study is to perform a market feasibility analysis through an examination
of the economic context, a demographic analysis of the defined market area, a competitive housing
analysis, a derivation of demand, and an affordability analysis.
C. Format of Report
The report format is comprehensive and conforms to DCA’s 2020 Market Study Manual. The market
study also considered the National Council of Housing Market Analysts’ (NCHMA) recommended
Model Content Standards and Market Study Index.
D. Client, Intended User, and Intended Use
The Client is TBG Residential. Along with the Client, the Intended Users are DCA, potential lenders,
and investors.
E. Applicable Requirements
This market study is intended to conform to the requirements of the following:
DCA’s 2020 Market Study Manual.
The National Council of Housing Market Analyst’s (NCHMA) Model Content Standards and
Market Study Index.
F. Scope of Work
To determine the appropriate scope of work for the assignment, we considered the intended use of
the market study, the needs of the user, the complexity of the property, and other pertinent factors.
Our concluded scope of work is described below:
Please refer to Appendix 5 and 6 for a detailed list of DCA and NCHMA requirements as well
as the corresponding pages of requirements within the report.
Brett Welborn (Analyst) conducted field research including a site visit on April 21, 2020.
Primary information gathered through field and phone interviews was used throughout the
various sections of this report. The interviewees included rental community property
managers, Michael Thigpen with the Warren County Planning Department, Gail Newsome
with the Thomson-McDuffie Planning and Zoning Department, staff with the City of
Warrenton, and Jeffrey Fowler with the Warren County Chamber of Commerce. We were
Pag e 1Legion Park | Introduction
unable to contact staff with the Warrenton Housing Authority following repeated attempts
by phone.
All pertinent information obtained was incorporated in the appropriate section(s) of this
report.
G. Report Limitations
The conclusions reached in a market assessment are inherently subjective and should not be relied
upon as a determinative predictor of results that will occur in the marketplace. There can be no
assurance that the estimates made, or assumptions employed in preparing this report will in fact be
realized or that other methods or assumptions might not be appropriate. The conclusions expressed
in this report are as of the date of this report, and an analysis conducted as of another date may
require different conclusions. The actual results achieved will depend on a variety of factors, including
the performance of management, the impact of changes in general and local economic conditions,
and the absence of material changes in the regulatory or competitive environment. Reference is made
to the statement of Underlying Assumptions and Limiting Conditions contained in Appendix I of this
report.
Pag e 2Legion Park | Project Description
2. PROJECT DESCRIPTION
A. Project Overview
Legion Park will be on the south/east side of Parham Street Extension, just south of Legion Drive’s
intersection with State Highway 16 in southern Warrenton, Warren County, Georgia. The physical
address of the site is 55 Parham Street, Warrenton GA 30828. The site is roughly one-half mile
southwest of downtown Warrenton and eight miles south of Interstate 20. The newly constructed
community will comprise 72 income and rent restricted units through the Low-Income Housing Tax
Credit (LIHTC) program with 20 units targeting 40 percent AMI, 40 units targeting 60 percent AMI, and
12 units targeting 80 percent AMI.
B. Project Type and Target Market
Legion Park’s proposed general occupancy (family) units will target very low to moderate income
renter households earning up to 40 percent, 60 percent, and 80 percent of the Area Median Income
(AMI). The proposed unit mix includes one, two, and three-bedroom units, which will attract a range
of households including singles, roommates, couples, and families.
C. Building Types and Placement
Legion Park’s residential units will be contained within three garden buildings with three stories and
brick and HardiPlank siding exteriors. An entrance will be on Parham Street to the west and a
community access road will extend east and form a loop with the buildings along the road and parking
adjacent to each building (Figure 1). A community building and most community amenities will be in
the interior of the loop while a gardening area will be in the eastern portion of the site.
Figure 1 Site Plan
Source: TBG Residential
Pag e 3You can also read