Legal Dimensions of Sea Level Rise: Pacific Perspectives - David Freestone and Duygu Çiçek
←
→
Page content transcription
If your browser does not render page correctly, please read the page content below
Public Disclosure Authorized                          Public Disclosure Authorized   Public Disclosure Authorized   Public Disclosure Authorized

   David Freestone and Duygu Çiçek
                                      of Sea Level Rise:
                                      Legal Dimensions
                                     Pacific Perspectives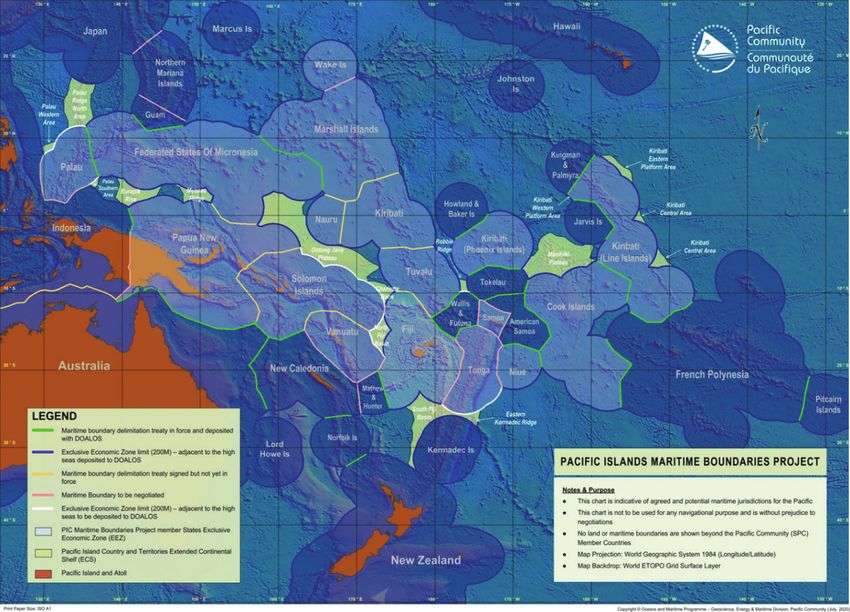
Legal Dimensions
 of Sea Level Rise:
Pacific Perspectives
    David Freestone and Duygu Çiçek
This work is a product of the staff of The World Bank and the Global Facility for Disaster Reduction and Recovery (GFDRR) with
external contributions. The findings, analysis and conclusions expressed in this document do not necessarily reflect the views of
any individual partner organization of The World Bank, its Board of Directors, or the governments they represent.

Although the World Bank and GFDRR make reasonable efforts to ensure all the information presented in this document is correct,
its accuracy and integrity cannot be guaranteed. Use of any data or information from this document is at the user’s own risk and
under no circumstances shall the World Bank, GFDRR or any of its partners be liable for any loss, damage, liability or expense
incurred or suffered which is claimed to result from reliance on the data contained in this document. The boundaries, colors,
denomination, and other information shown in any map in this work do not imply any judgment on the part of The World Bank
concerning the legal status of any territory or the endorsement or acceptance of such boundaries.

Suggested Citation: David Freestone and Duygu Çiçek. 2021. Legal Dimensions of Sea Level Rise: Pacific Perspectives. Washington,
D.C. : World Bank Group.

Rights and Permissions
The material in this work is subject to copyright. Because The World Bank encourages dissemination of its knowledge, this work
may be reproduced, in whole or in part, for noncommercial purposes as long as full attribution to this work is given.

Design: Miki Fernández, ULTRA Designs, Inc.

Front cover photo: Ian Dyball. Back cover photo: Efate Island, Vanuatu. © Martin Valigursky | Dreamstime.com
LEGAL DIMENSIONS OF SEA LEVEL RISE: PACIFIC PERSPECTIVES / iii

Table of Contents

Acknowledgements......................................................................................................................................................................................................     v
Executive Summary.....................................................................................................................................................................................................    vi

Part I
Expected Effects of Climate Change on Small Island Developing States (SIDS),
and Pacific Atoll Countries in Particular, with a Focus on Rising Sea Level.............................................                                                                                                   1

1. Sea Level Rise Predictions from the Intergovernmental Panel on Climate Change.............................................................................                                                             2
2. Physical and Ecological Impacts of Climate Change and Sea Level Rise...............................................................................................                                                    4

Part II
The Legal Regime Governing the Rights and Resources of Coastal
and Island States in the Age of Climate Change and Sea Level Rise...............................................................                                                                                         11

1. 1982 UN Convention on the Law of the Sea...................................................................................................................................................                           12
2. 1992 UN Framework Convention on Climate Change and the 2015 Paris Agreement.......................................................................                                                                    17
3. Legal Aspects of Statehood................................................................................................................................................................................            19
4. Legal Framework for Human Mobility in the Context of Climate Change..............................................................................................                                                     21
5. Work of the International Law Association and the International Law Commission.......................................................................... 25

Part III
Key Legal and Policy Questions Faced by SIDS, and Pacific Atoll Countries
in Particular, in Relation to Sea Level Rise...............................................................................................................................                                              29

1. What are the legal implications of physical changes to different types of baselines under the 1982 LOSC
      as a result of sea level rise?................................................................................................................................................................................. 30
2. What is the difference between an “island” and a “rock”?.......................................................................................................................... 33
3. What are the legal implications for the outer limits of a State’s maritime zones and maritime boundaries
      with other States, and for the rights of third States and their nationals, of changes in coastal baselines
      from which maritime zones are delineated or delimited?........................................................................................................................... 36
4. How might a State defend its existing maritime entitlements in accordance with international law?......................................... 42
5. What are the legal implications of an island State becoming uninhabitable?...................................................................................... 48
6. What are the legal and policy options relating to human mobility in the context of climate change?..........................................                                                                          51
7. How is the international community able to provide support for States that need to adapt to impacts
      from sea level rise?................................................................................................................................................................................................ 57

Appendix I: Key Legal and Policy Options Pertaining to Human Mobility in the Context of Climate Change.................................... 62
Appendix II: Selected Funds, Financing and Other Options Available to SIDS............................................................................................ 66
Appendix III: Selected Work of the World Bank in the Pacific Region............................................................................................................ 70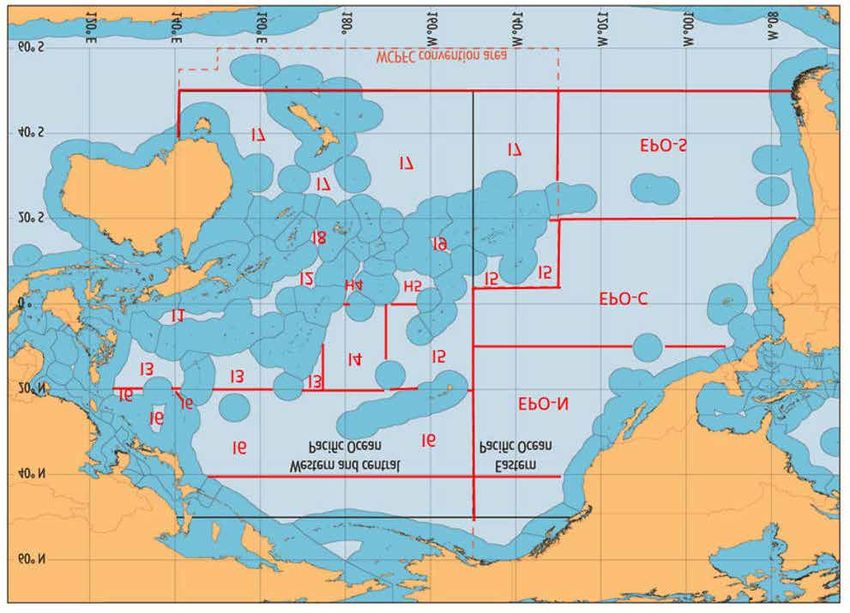
iv LEGAL DIMENSIONS OF SEA LEVEL RISE: PACIFIC PERSPECTIVES

List of Figures
Figure 1.         Map of the EEZs of PICTs and international water high seas areas for the tropical Pacific Ocean .................................                                                                     7
Figure 2.         Average historical (2005) distributions of skipjack, yellowfin and bigeye tuna,
                  and South Pacific albacore (Mt/km2) in the tropical Pacific Ocean, and projected changes in biomass
                  of each species relative to 2005 under the RCP8.5 emission scenario for 2050 and 2100, simulated
                  using SEAPODYM ...................................................................................................................................................................................    8
Figure 3.         Projected changes in license revenue from the purse-seine fishery, in terms of value (USD) and as
                  a percentage of all government revenue, in 2050 relative to 2016 due to the effects of climate change
                  on the combined biomass of skipjack, yellowfin and bigeye tuna in the EEZ of 10 PICTs ..................................................                                                              9
Figure 4.         Coastal baseline and maritime zones stipulated under LOSC ...................................................................................................                                        12
Figure 5.         Illustration of types of baselines ........................................................................................................................................................          13
Figure 6.         LTEs and the generation of maritime zones ...................................................................................................................................                        13
Figure 7.         Definition of the outer limits of the continental shelf ..................................................................................................................                           15
Figure 8.         Archipelagic state zones. ..................................................................................................................................................................... 33
Figure 9.         Islands and LTEs ..................................................................................................................................................................................... 34

Figure 10. Impacts on maritime zone of receding baselines .......................................................................................................................... 37
Figure 11. Maritime zones ....................................................................................................................................................................................... 38
Figure 12. (i) Two States with boundary dividing EEZs and (ii) Coastlines retreat: New High Seas area is created ....................... 39
Figure 13. LTE with navigational aid installation .............................................................................................................................................. 43

Figure 14. Major land reclamation in Singapore ................................................................................................................................................ 44
Figure 15. The Status of Pacific Regional Maritime Boundaries as of July 2020 .................................................................................... 45
Figure 16. Consequences of “freezing” coastal baselines to maintain maritime entitlements ............................................................ 46

List of Boxes
Box 1.            Impacts of migration on the Marshallese migrants and the Compact of Free Association (COFA) ................................ 54
Box 2.            Fiji’s Planned Relocation Guidelines (2018) ..................................................................................................................................... 55
Box 3.            NDCs of Atoll Countries with ocean-related commitments ....................................................................................................... 58
LEGAL DIMENSIONS OF SEA LEVEL RISE: PACIFIC PERSPECTIVES / v

Acknowledgements
This Study was prepared as part of the World Bank’s         Study including Artessa Saldivar-Sali, Annette Leith,
Building Resilience in Pacific Atoll Island Countries       Veronica Piatkov, Georgina McArthur, Colleen Butcher-
Study, which aims to strengthen the capacity of             Gollach, Richard Croad, Jon Metcalf, Doug Ramsay,
selected Pacific Atoll Island countries to cope with        Karen Jimeno, and Alessio Giardino.
the long-term (100 year+) adverse impacts of climate
                                                            We are also indebted to the peer reviewers who were
change and boost their resilience.                          instrumental in the review process by helping us
Acknowledging the collaborative efforts leading to the      ensure the quality of the product including Professor
finalization of this Study, we wish to extend our thanks    Nilufer Oral, Professor Walter Kaelin, Stephane
and appreciation for the overall guidance and input         Hallegatte, Nicolas Desremaut, Brenden Jongman and
received from the Environmental and International           Borja Gonzalez Reguero. We cannot forget the great
Law Practice Group (LEGEN) team including Christina         comments other reviewers provided on various parts
                                                            of the text including Professors Davor Vidas, William
Leb, Siobhan McInerney-Lankford, Sachiko Morita,
                                                            Edeson and Clive Schofield. We are also grateful to
Remi Moncel, and Victor Bundi Mosoti. We also greatly
                                                            Professor Schofield and Andi Arsana for use of graphics.
appreciate the valuable comments from the regional
team and its extended members working on the                Our thanks are also due to Angela Takats for the editorial
Building Resilience in Pacific Atoll Island Countries       assistance and Miki Fernandez for the design.
vi LEGAL DIMENSIONS OF SEA LEVEL RISE: PACIFIC PERSPECTIVES

Executive Summary

T
          his legal study has been developed as a part of                 (UNFCCC) and its 2015 Paris Agreement. Although the
          the World Bank’s work on “Building Resilience                   primary focus of this study is the maritime rights of
          in Pacific Atoll Island Countries” which aims                   coastal States, it also looks at the key legal framework
          to strengthen the capacity of selected Pacific                  regulating other issues likely to arise or increase in the
atoll island countries to cope with the long-term adverse                 light of the possible threats, such as that related to hu-
impacts of climate change and boost their resilience.                     man mobility in this context and the issue of continued
The goal of this work is to contribute to the National                    statehood. Many of these issues pose completely un-
Adaptation Planning Process currently in progress for                     precedented challenges to the international legal order,
the Republic of the Marshall Islands and inform adap-                     so definitive answers to many questions are simply not
tation options for Kiribati and Tuvalu through the Atoll                  possible, but the objective of this study is to present
Adaptation Dialogue Mechanism. “Building Resilience                       the latest legal thinking on these issues and provide an
in Pacific Atoll Island Countries” stresses that short- to                analysis that will be useful to stakeholders, policymak-
medium-term adaptation options will not suffice in ad-                    ers, and practitioners.
dressing the escalating impacts of sea level rise and cli-
                                                                          It is divided into three parts. Part I looks at the pioneer-
mate change. Consequently, it explores the implications
                                                                          ing work of the Intergovernmental Panel on Climate
of alternative adaptation options while also considering
                                                                          Change (IPCC) and its most recent predictions for sea
investment needs and relevant costs associated with
                                                                          level rise during the current century and then sets it
these options.1
                                                                          in the context of other scientific work on threats from
Against this background, this legal study is designed                     sea level rise and warming, in particular the predicted
to provide an assessment of the impacts of climate                        impacts on the fish resources on which the region is so
change, especially sea level rise on the maritime rights                  dependent. Part II sets out an overview of relevant le-
of coastal States. In doing so, it builds on the 2008                     gal frameworks, key terminology, and principles based
World Bank legal working paper on the Maritime Rights                     on international law as well as judicial decisions and
of Coastal States.2 In the intervening years, the threats                 scholarly work that define the rights, resources, and
of climate change have amplified, more coastal States                     obligations of SIDS and the Pacific atoll countries in
have resolved to strengthen their resilience, and the rel-                particular. Part III then presents a series of responses
evant international legal regime has evolved, including                   to key legal and policy questions faced by these States,
through the adoption of the 2015 Paris Agreement.                         in relation to sea level rise. The questions addressed are
                                                                          the following:
This study, therefore, aims to take a much wider view of
the legal aspects of the impacts of sea level rise and cli-               1. What are the legal implications of physical changes
mate change on Small Island Developing States (SIDS),                        to different types of baselines under the 1982 LOSC
and the Pacific atoll countries in particular. It looks at                   as a result of sea level rise? Sea level rise is likely
the main projected impacts of sea level rise and ocean                       to result in retreating coastlines and the inundation
related climate change on these States and territories                       of small offshore features—all of which are used to
including the possible impacts on the marine resourc-                        measure maritime entitlements. These changes may
es upon which they depend. It outlines the main legal                        make it difficult for coastal States to retain those
regimes that regulate these issues, including the 1982                       entitlements according to the strict requirements of
UN Law of the Sea Convention (LOSC) and the regime of                        the LOSC.
the 1992 UN Framework Convention on Climate Change
                                                                          2. What is the difference between an “island” and a
1
    Further details in respect to the World Bank’s work in this area in      “rock”? Arbitration Tribunal awards provide detailed
    the Pacific Region are summarized in Appendix III.                       guidance on the difference between “rocks” and
2
    Di Leva, Charles, and Sachiko Morita. 2008. “Maritime Rights             “islands” as defined by the LOSC, but questions still
    of Coastal States and Climate Change: Should States Adapt
    to Submerged Boundaries?” World Bank Law and Development                 remain as to whether physical changes in islands
    Working Paper Series.                                                    brought about by sea level rise might require them to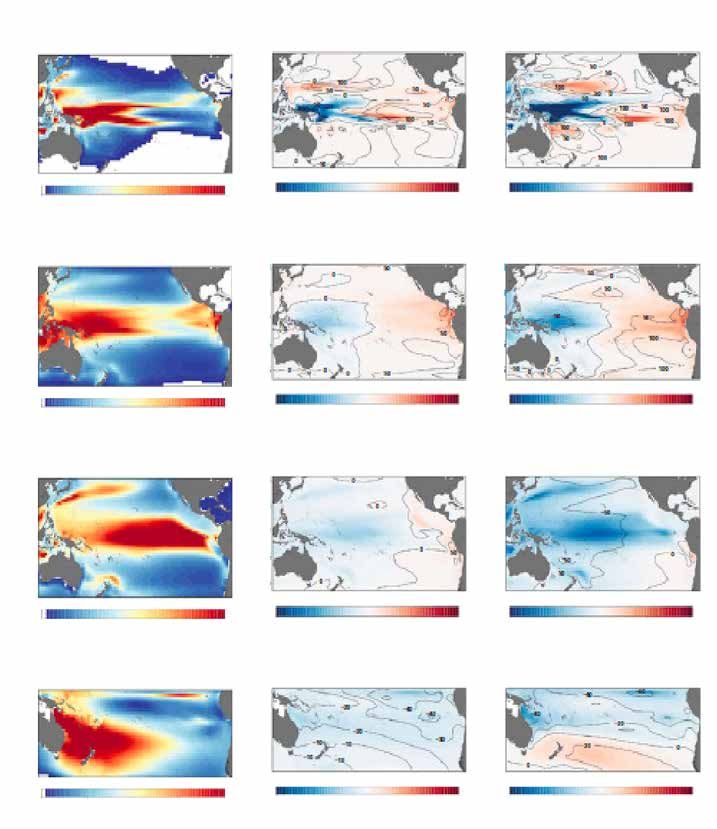
LEGAL DIMENSIONS OF SEA LEVEL RISE: PACIFIC PERSPECTIVES / vii

  be reclassified as “rocks” with more limited maritime              community will need to address. But international
  entitlements.                                                      law and practice does suggest a presumption of
                                                                     State continuity provided that the State can honor
3. What are the legal implications for the outer
                                                                     its international obligations and responsibilities.
   limits of a State’s maritime zones and maritime
   boundaries with other States, and for the rights              6. What are the legal and policy options relating to
   of third States and their nationals, of changes in               human mobility in the context of climate change?
   coastal baselines from which maritime zones are                  International law does provide a framework for
   delineated or delimited? It is not clear what the legal          addressing issues of human mobility in the face of
   effect is of physical changes to coastal baselines that          sea level rise, but it is fragmented. This section sets
   have been used as the basis for maritime boundary                out the relevant legal tools and policy options that
   delimitation treaties or judicial decisions, even if the         might help people adapt in situ and that facilitate
   result is to extend the delimitation lines beyond 200            human mobility if it becomes necessary.3
   nautical miles (nm) from the coast.
                                                                 7. How is the international community able to provide
4. How might a State defend its existing maritime                   support for States that need to adapt to impacts
   entitlements in accordance with international                    from sea level rise? There is a myriad of mechanisms
   law? Coastal States are entitled to use a number of              available for financial support and technical
   physical means, including artificial islands, to defend          assistance in designing and implementing adaptation
   their coastlines and coastal basepoints. They may                measures, including legal and policy strategies.4
   also seek to argue at the legal and policy level that
   they are not obliged to amend their existing maritime
   entitlements in the face of sea level rise.

5. What are the legal implications of an island State            3
                                                                     For ease of reference, these are summarized in tabular form in
   becoming uninhabitable? This is an unprecedented                  Appendix I.
   situation for international law, which the international      4
                                                                     These are also set out in tabular form in Appendix II.
viii LEGAL DIMENSIONS OF SEA LEVEL RISE: PACIFIC PERSPECTIVES

Kiribati, . Photo: © Trentinness | Dreamstime.com.
LEGAL DIMENSIONS OF SEA LEVEL RISE: PACIFIC PERSPECTIVES / 1

         Part I
       Expected Effects of
Climate Change on Small Island
   Developing States (SIDS),
   and Pacific Atoll Countries
      in Particular, with a
    Focus on Rising Sea Level
2 LEGAL DIMENSIONS OF SEA LEVEL RISE: PACIFIC PERSPECTIVES
1. Sea Level Rise Predictions from globe and the Pacific region is already facing some of
the highest rates and levels.9
the Intergovernmental Panel on
Climate Change The 1990 FAR noted that the main drivers of these pre-
dictions would be the melting of glaciers and thermal
The Intergovernmental Panel on Climate Change (IPCC) expansion and that the effects of the Antarctic and
was established in 1988 by the UN Environment Pro- Greenland ice sheets would be small.10 It is now clear
gramme (UNEP) and the World Meteorological Orga- that the melting of the polar ice sheets will be a major
nization (WMO) to provide policymakers with regular factor in future rises but uncertainty about the rates as
scientific assessments on climate change, its implica- well as possible extent of that melting remains high.11
tions, and potential future risks, as well as to put for- The most recent 2019 Special Report on the Ocean and
ward adaptation and mitigation options. The IPCC does the Cryosphere in a Changing Climate (SROCC),12 dis-
not conduct its own research but through its assess- cussed in more detail below, highlighted the fact that
ments, it determines the state of scientific knowledge under a continued high GHG emissions scenario, the
on climate change. It identifies where there is agree- likely range of sea level rise might extend beyond 1 me-
ment in the scientific community on topics related to ter (m) in 2100 due to a larger projected ice loss from the
climate change, and where further research is needed. Antarctic Ice Sheet.13 However, if GHG emissions are in-
The reports are drafted and reviewed in several stages, creasingly restricted—as the Paris Agreement seeks to
thus guaranteeing objectivity and transparency. IPCC ensure—a more likely prediction would be a rise of 0.39
reports are neutral, policy-relevant but not policy-pre- m from the period 2081–2100 (within a possible range
scriptive.5 Its First Assessment Report (FAR) issued in of 0.26–0.53 m) and 0.43 m by 2100. The uncertainty
19906 predated the 1992 UN Framework Convention at the end of the century is mainly determined by the ice
on Climate Change (UNFCCC), yet it added a degree of sheets, especially in Antarctica.14
urgency to the negotiations because of the breadth of
The IPCC has produced three interim special reports ad-
issues which it predicted would be impacted by climate
dressing concerns flagged within the UNFCCC. Two of
change and the possible severity of those impacts.
these are particularly important for their coverage of
The IPCC is now in its sixth cycle, producing the Sixth sea level rise and ocean impacts: 2018 Global Warming
Assessment Report (AR6).7 The contributions from its of 1.5°C (1.5°C Report or SR1.5) 15 and the 2019 SROCC.
three Working Groups will be published in 2021 followed
by a Synthesis Report in 2022.8 Over the last 30 years, 9
The Pacific Marine Climate Change Report Card 2018 suggested
scientific knowledge has increased exponentially as has that the Pacific Islands experienced sea level rise of 3-6 mm per
year. See, Commonwealth Marine Economies Programme (CMEP),
modeling expertise. Although there are still uncertain- Pacific Marine Climate Change Report Card 2018, available at:
ties about a number of issues, it is clear that even if https://climateanalytics.org/media/cefas_pacific_islands_report_
Greenhouse Gas (GHG) emissions are radically reduced card_final_amended_spreads_low-res.pdf
10
Although it did acknowledge the uncertainties surrounding this.
or even eliminated, sea levels will still continue to rise in
Ibid., p. xi.
the following decades or centuries. It is also clear that 11
Mass loss from the Antarctic ice sheet over the period 2007–16
although the predictions are of Global Mean Sea Levels tripled relative to 1997–06. For Greenland, mass loss doubled
(GMSL), rises in sea level will not be uniform all over the over the same period (likely, medium confidence). IPCC, 2019:
Summary for Policymakers. In: IPCC Special Report on the Ocean
and Cryosphere in a Changing Climate (SROCC SPM), H.-O.
Pörtner, D.C. Roberts, V. Masson-Delmotte, P. Zhai, M. Tignor, E.
Poloczanska, K. Mintenbeck, A. Alegría, M. Nicolai, A. Okem, J.
Petzold, B. Rama, N.M. Weyer (eds.), available at: https://www.ipcc.
5
The Intergovernmental Panel on Climate Change (IPCC), available ch/site/assets/uploads/sites/3/2019/11/03_SROCC_SPM_FINAL.
at: https://www.ipcc.ch/ pdf, at A 3.2 [3.3.1, Figures SPM.1, SPM.2, SPM A.1.1].
6
IPCC, First Assessment Report Synthesis (FAR), published as part 12
SROCC SPM.
of the 1992 IPCC Supplementary Reports as IPCC First Assessment 13
Ibid., at B.3.1 But even for this higher projection the possible range
Report Overview and Policymaker Summaries and 1992 IPCC is 0.61-1.10 m by 2100.
Supplement, available at: https://www.ipcc.ch/report/ar1/syr/ 14
Ibid., at B.3.
7
See, in general, following upcoming reports: IPCC, The Sixth 15
IPCC, 2018: Global Warming of 1.5°C. An IPCC Special Report on the
Assessment Report (AR6) with contributions by its three Working impacts of global warming of 1.5°C above pre-industrial levels and
Groups and a Synthesis Report, three Special Reports, and a related global greenhouse gas emission pathways, in the context of
refinement to its latest Methodology Report, available at: https:// strengthening the global response to the threat of climate change,
www.ipcc.ch/assessment-report/ar6/ sustainable development, and efforts to eradicate poverty (SR 1.5),
8
Ibid. Masson-Delmotte, V., P. Zhai, H.-O. Pörtner, D. Roberts, J. Skea,LEGAL DIMENSIONS OF SEA LEVEL RISE: PACIFIC PERSPECTIVES / 3
The SR1.5 discusses a world 1.5°C warmer than pre-in- GMSL rise will cause the frequency of extreme sea level
dustrial times—prompted by the commitment by the events at most locations to increase. Localized coastal
Parties to the Paris Agreement—to pursue “efforts to flooding events that historically occurred once per cen-
limit the temperature increase to 1.5°C above pre-in- tury (historical centennial events) are projected to oc-
dustrial levels, recognizing that this would significantly cur at least annually at most locations by 2100 under
reduce the risks and impacts of climate change.”16 all scenarios.21 Many low-lying megacities and small
islands (including SIDS) are projected to experience
The basic message of the 1.5°C Report is that climate
historical centennial events at least annually by 2050
change impacts on sustainable development, eradication
under a range of scenarios.22 The increasing frequency
of poverty, and reducing inequalities would increase even
of high water levels can have severe impacts in many lo-
if global warming were limited to 1.5°C, even if mitigation
cations.23 Under the same assumptions, annual coastal
and adaptation synergies are maximized while trade-offs
flood damages are projected to increase by 2–3 orders
are minimized.17 Even in a world warmed to 1.5°C, there
of magnitude by 2100 compared to today.24
will be major negative impacts, including a probable de-
cline of 70–90 percent of the world’s coral reefs.18 The average intensity of tropical cyclones, the propor-
tion of Category 4 and 5 tropical cyclones, and the as-
As the title indicates, the 2019 SROCC is a more fo-
sociated average precipitation rates are projected to
cused report on ocean issues. It reported that it is virtu-
increase for a 2°C global temperature rise above any
ally certain that the global ocean has warmed unabated
baseline period. Rising mean sea levels will contribute
since 1970 and has taken up more than 90 percent of
to higher extreme sea levels associated with tropical
the excess heat in the climate system. Since 1993, the
cyclones. Coastal hazards will be exacerbated by an
rate of ocean warming has more than doubled. Marine increase in the average intensity, magnitude of storm
heatwaves have very likely doubled in frequency since surge and precipitation rates of tropical cyclones.25
1982 and are increasing in intensity. By absorbing more
carbon dioxide (CO2), the ocean has also undergone in- The 2019 SROCC also highlighted the fact that warm-
creasing surface acidification. A loss of oxygen has also ing-induced changes in the spatial distribution and
occurred from the surface to 1000 m.19 abundance of some fish and shellfish stocks have had
both positive and negative impacts on catches, eco-
The 2019 SROCC found that GMSL had already risen nomic benefits, livelihoods, and local culture. This has
over the last century by 0.16 m (likely range 0.12–0.21 obvious negative consequences for indigenous peoples
m) and the rate of rise for 2006–15 was 3.6 mm per and local communities that are dependent on fisheries.
year which is unprecedented over the last century and Long-term loss and degradation of marine ecosystems
about 2.5 times the rate for 1901–90 of 1.4 mm a year. compromises the ocean’s role in cultural, recreation-
It confirmed that the dominant cause was anthropo- al, and intrinsic values important for human identity
genic and that the dominant source of increased water and well-being.26 Similarly, climate change impacts on
levels was ice sheet and glacier melt which exceeded the marine ecosystems and their services put key cultur-
effect of thermal expansion of ocean water. In particu- al dimensions of lives and livelihoods at risk, includ-
lar, the combined increased ice loss from the Greenland ing through shifts in the distribution or abundance of
and Antarctic ice sheets.20 harvested species and diminished access to fishing
The 2019 SROCC is also unusual in that it devotes con- or hunting areas. This includes potentially rapid and
siderable space to impacts on society, pointing out that irreversible loss of local and indigenous culture and
knowledge, and negative impacts on traditional diets
P.R. Shukla, A. Pirani, W. Moufouma-Okia, C. Péan, R. Pidcock, S.
Connors, J.B.R. Matthews, Y. Chen, X. Zhou, M.I. Gomis, E. Lonnoy, 21
Ibid., at B 3.4 [4.2.3, 6.3, Figures SPM.4, SPM.5].
T. Maycock, M. Tignor, and T. Waterfield (eds.), available at: https:// 22
Under RCP2.6, RCP4.5 and RCP8.5. The year when the historical
www.ipcc.ch/sr15/ centennial event becomes an annual event in the mid-latitudes
16
Paris Agreement, Art 2(10)(a). occurs soonest in RCP8.5, next in RCP4.5 and latest in RCP2.6.
17
SR 1.5 SPM, at D.2. 23
SROCC SPM, at B 3.4.
18
Ibid., at B.6.2. 24
Ibid., at A.9 [4.3.3, 4.3.4, Box 6.1, Figure SPM.5].
19
SROCC SPM, at A2 [1.4, 3.2, 5.2, 6.4, 6.7, Figures SPM.1, SPM.2]. 25
There are greater increases projected under RCP8.5 than under
20
Mass loss from the Antarctic ice sheet over the period 2007–16 RCP2.6 from around mid-century to 2100 (medium confidence).
tripled relative to 1997–06. For Greenland, mass loss doubled over There is low confidence in changes in the future frequency of
the same period (likely, medium confidence). See, SROCC SPM, at tropical cyclones at the global scale. See, ibid., at B.3.6 [6.3.1].
A 3.2 [3.3.1, Figures SPM.1, SPM.2, SPM A.1.1]. 26
Ibid., at B.8 [3.2.4, 3.4.3, 5.4.1, 5.4.2, 6.4].4 LEGAL DIMENSIONS OF SEA LEVEL RISE: PACIFIC PERSPECTIVES
and food security, aesthetic aspects, and marine rec- 2100 may be outside that range.32 The problem is exac-
reational activities.27 erbated by the fact that the persistent warming of the
oceans together with increased acidification is interfer-
At the same time, shifts in species distributions and
ing with these natural processes.33 Mass coral bleaching
abundance has challenged international and national
events primarily attributed to ocean warming resulting
ocean and fisheries governance, including in the Arctic,
in widespread coral deaths—such as those on the Great
North Atlantic and Pacific, in terms of regulating fishing
Barrier Reef in Australia—impact the ability of reefs to
to secure ecosystem integrity and sharing of resources
maintain themselves.34 Continued ocean warming will
between fishing entities.28
bring higher ocean temperatures and increase storm
The 2019 SROCC’s final message is that in the absence severity.35 There are also concerns that higher concen-
of more ambitious adaptation efforts compared to to- trations of human populations, as a result of increasing
day, and under current trends of increasing exposure and urbanization and coastal development, will inevitably
vulnerability of coastal communities, it can predict with increase local pollution, and that “hard” sea defenses
a very high level of confidence that risks, such as erosion will disrupt sediment flows to prevent islands from nat-
and land loss, flooding, salinization, and cascading im- urally replenishing themselves.
pacts due to mean sea level rise and extreme events are
As a result, scientists have raised concerns over the
projected to significantly increase throughout this centu-
persistence of coral reefs, and the low-lying reef islands
ry under all GHG emissions scenarios.
32
The Pacific Marine Climate Change Report Card 2018 suggested
2. Physical and Ecological Impacts of that the Pacific Islands experienced sea level rise of 3–6 mm per
Climate Change and Sea Level Rise year in the period 1993–17 “but with some notable differences
between islands” with some islands in the Western Pacific
(Solomon Islands, Papua New Guinea and Marshall Islands) subject
Coastal ecosystems are essentially dynamic and adapt to a higher rate of sea level rise (up to 6 mm/year) compared to
to changes in sea levels. The important question, how- islands further east (such as Samoa and Kiribati), available online:
https://climateanalytics.org/media/cefas_pacific_islands_report_
ever, is whether they will be able to do this in ways which card_final_amended_spreads_low-res.pdf.
allow continued human habitation and uses. 33
IPCC 1.5˚C Report suggested that even if warming were to be
restrained to 1.5˚C above pre-industrial levels, the result would be a
“further loss of 70-90% of reef-building corals compared to today”,
Impacts on Coral Reefs and Reef Islands and that if warming reached 2˚C above pre-industrial levels, coral
losses were estimated at 99%.
Atoll islands are the creation of corals and for millennia, 34
The potentially serious effects of ocean warming for coral reefs
coral reefs and reef islands appear to have been able are underscored by the increasing frequency and severity of coral
to keep pace with the numerous changes in sea level. reef bleaching events. See, for example, P.P. Wong et al., “Coastal
systems and low-lying areas,” in Climate Change 2014: Impacts,
Conventional wisdom, therefore, was that coral growth
Adaptation, and Vulnerability. Part A: Global and Sectoral Aspects.
would similarly be able to keep pace with changes in sea Contribution of Working Group II to the Fifth Assessment Report of
level brought about by anthropogenic climate change. the Intergovernmental Panel on Climate Change, eds. C.B. Field et
Although individual corals seem well able to grow at al. (Cambridge University Press, 2014), pp. 361–409, 378. See also,
T.P. Hughes, J.T. Kerry, M. Alvarez-Noriega et al., “Global Warming
rates of 10–100 mm per year,29 reefs accrete at slower and Recurrent Mass Bleaching of Corals” Nature Vol. 543 (2017),
rates than coral grows.30 The fastest recorded rate of pp. 373–377; T.P. Hughes, K.D. Anderson and S.R. Connolly, “Spatial
reef growth from the fossil record is 7.89 mm per year,31 and Temporal Patterns of Mass Bleaching in the Anthropocene”
Science Vol. 359 (2018), pp. 80–83; R. van Hooidonk, J. Maynard,
and current predictions of the rate of sea level rise to J. Tamelander et al., “Local-Scale Projections of Coral Reef Futures
and Implications of the Paris Agreement” Scientific Reports 6
27
Ibid., at B.8.4 [3.4.3, 3.5.3, 5.4.2]. (39666) (2016), pp. 1–8; T.L. Frölicher, E.M. Fischer and N. Gruber,
28
Ibid., at A 8.1 [3.2.4, 3.5.3, 5.4.2, 5.5.2, and Figure SPM 2]. “Marine Heatwaves Under Global Warming”, Nature 560 (2018), pp.
29
Coral Reef Alliance, “How Coral Reefs Grow” available online: 360–364; T.P. Hughes et al., “Global Warming Transforms Coral
https://coral.org/coral-reefs-101/coral-reef-ecology/how-coral- Reef Assemblages” Nature 556 (2018), pp. 492–496; Harrison,
reefs-grow/#:~:text=The%20massive%20corals%20are%20 Hugo B., Álvarez-Noriega, Mariana, Baird, Andrew H., Heron, Scott
the,21%E2%80%9329%C2%B0%20C). F., Macdonald, Chancey, and Hughes, Terry P. (2019) “Back-to-back
30
Camoin, Gilbert M., Lucien Montaggioni, et al. 1997. “Holocene coral bleaching events on isolated atolls in the Coral Sea.” Coral
sea-level changes and reef development in South-Western Indian Reefs, Vol. 38 (4), pp. 713-719.
Ocean”, Coral Reefs, Vol. 16(4), pp. 247-259. 35
See also, Curt D. Storlazzi et al., “Most atolls will be uninhabitable
31
McManus, John W. 2017. “Offshore Coral Reef Damage, Overfishing, by the mid-21st century because of sea level rise exacerbating
and Paths to Peace in the South China Sea.” International Journal wave-driven flooding”, Science Advances, Vol. 4(4), available online
of Marine and Coastal Law, Vol. 32, pp. 199-237 at 220. https://advances.sciencemag.org/content/4/4/eaap9741.LEGAL DIMENSIONS OF SEA LEVEL RISE: PACIFIC PERSPECTIVES / 5
that depend on them, and question whether they will islands exhibited no widespread sign of physical desta-
become increasingly unable to support human popu- bilization in the face of sea level rise. She found that
lations over the coming century.36 Nevertheless, recent smaller islands were more susceptible to change but
research suggests that reef islands are remarkably that no islands larger than 10 hectares (ha) had actually
geomorphologically resilient land forms that have been decreased in size during that period. Kane and Fletch-
able to remain stable or even grown in area over the last er (2020) however add some caution to this message
20–60 years. In a groundbreaking study in 2010, Webb in their multitemporal island vulnerability assessment
and Kench37 analyzed historical aerial photography and (MIVA) which they applied to the islands of the Republic
satellite images in order to study physical changes in 27 of the Marshall Islands.40 They conclude that with rates
atoll islands in the central Pacific over a 19- to 61-year of sea level rise that are likely under the IPCC “interme-
period. Their study presents the first quantitative anal- diate to high” sea level rise scenario, by mid-century, is-
ysis of the changes they observed. land stability will deteriorate and that island instability
“will be inevitable with no action.” Urbanized islands and
The key takeaway from this important empirical re-
those where there have been a high level of human infra-
search is that sea level rise in itself does not necessarily
structure and interference with coastline structure are
mean the gradual and inevitable erosion of reef islands
those most at risk.
until they become uninhabitable. It highlights the fact
that these are dynamic systems which may be able to The combined impacts of sea level rise and other cli-
maintain themselves by processes of sediment move- mate change phenomena such as warming oceans and
ment and accretion, provided always that those coral increased storm risk are still not clear.41 The natural pro-
reefs are able to survive and maintain the supplies of cesses which have ensured the survival of islands in the
sediment. past, can also be interfered with by human activities at
a local level, such as beach sand and gravel mining, poor
At a time when instrumental records showed a rate of
engineering and even reclamation activities.42 Efforts to
sea level rise of 2.0 mm per year in the Pacific, their study
defend threatened parts of the coast are likely to have
shows that only 14 percent of islands lost areas whereas
unanticipated and unwelcome consequences elsewhere
43 percent remained stable, and the further 43 percent
along the coast, especially in such dynamic inter-linked
increased in area over the timeframe of analysis. Only
systems. Nevertheless, the most important message
14 percent of study islands exhibited a net reduction in
may be from Kane and Fletcher that by 2050 radical
island area. Despite small net changes in area, islands
human intervention may be necessary in many island
exhibited larger gross changes. This was expressed as
systems to counteract increasing island instability.43
changes in the platform configuration and position of
islands on reef platforms.38 Collectively, these adjust-
ments represent net lagoon-ward migration of islands
in 65 percent of cases.
Vol. 10 (1).
More recent work appears to confirm this more posi- 40
Kane, Haunani H. and Charles H. Fletcher. 2020. “Rethinking Reef
tive message. Duvat (2019) conducted a global assess- island stability in relation to Anthropogenic Sea Level Rise.” Earth’s
Future, Vol. 8 (10).
ment of atoll islands platform changes over a series of 41
Storm events can be highly destructive for coastal ecosystems
decades.39 She found that over the past decades, atoll such as corals and, coupled with multiple other factors such as
disease, feed web changes, invasive organisms and heat stress
mortality, may “overwhelm the capacity for natural and human
36
Leatherman, Stephen P. 1997. Island States at Risk: Global systems to recover following disturbances.” See, IPCC 1.5°C Special
Climate Change, Development and Populations, Coastal Education Report, above, p. 223. Note that other research shows how flood
Research Foundation; Connell, John. 1999. “Environment Change, risk will increase with sea level rise and loss of reefs. See, e.g.,
economic development and emigration in Tuvalu.” Pacific Studies, Michael W. Beck, Iñigo J. Losada, et al., “The global flood protection
Vol. 22, pp. 1-20. (cited by Webb et al. below). savings provided by coral reefs” (2018) Nat Commun No. 9 Article
37
Webb, Arthur and Paul Kench. 2010. “The dynamic response of reef No. 2186.
islands to sea-level rise: Evidence from multi-decadal analysis of 42
The construction of sea defences may also interrupt sediment flow
island change in the Central Pacific.” Global and Planetary Change, regimes, potentially compromising the capacity of coral islands
Vol. 72(3), pp. 234-246. to naturally adapt to sea level rise. See, for example, Paul Kench,
38
Modes of island change included: ocean shoreline displacement “Understanding Small Island Dynamics: A Basis to Underpin Island
toward the lagoon; lagoon shoreline progradation; and extension of Management,” in Proceedings of the International Symposium of
the ends of elongate islands. Islands and Oceans, 22–23 January 2009, ed. H. Terashima (Ocean
39
Duvat, Virginie K. E. 2019. “A global assessment of atoll island Policy Research Foundation, 2009), pp. 24–28.
planform changes over the past decades.” WIREs Climate Change, 43
See, Kane and Fletcher (2020).6 LEGAL DIMENSIONS OF SEA LEVEL RISE: PACIFIC PERSPECTIVES
Threats to Natural Resources, Livelihoods, more in the Central and Eastern Pacific. These events
and Food Security can affect the survival of tuna larvae in positive as well
as negative ways—for example, more skipjack tuna lar-
The depletion of coral reefs predicted by IPCC SR 1.5°C vae survive during El Niño to become juvenile fish.47
as a result of the impacts of ocean warming and acidifi-
cation will reduce the availability of the fish species that The IPCC predictions suggest that sea surfaces will be
depend on these coral reef ecosystems. In fact, the pro- very likely to become warmer and more acidic; it is also
duction of demersal stocks in the Western and Central likely that there will be changes in water circulation pat-
Pacific is predicted to decline by 20 percent by 2050 terns and decreases in oxygen levels in the water. This,
and 20–50 percent by 2100 under continued high GHG in turn, seems likely to change the availability of nutri-
emissions.44 As a result, the Pacific Island Countries and ents and hence food availability for tuna.
Territories (PICTs) will have to make greater domestic
In a recent analysis, the South Pacific Community
use of pelagic species—particularly tunas. Indeed, it
(SPC), with partners,48 sought to assess the impacts of
has been estimated that by 2035, 25 percent of all fish
climate change on tropical tuna species and tuna fisher-
required for food security of Pacific Island people will
ies in Pacific Island waters and high seas areas. The new
need to be supplied by tuna. To meet this need, more
modelling simulates the response of tropical tuna spe-
than 85,000 tones of tuna and tuna-like species will be
cies, and the ecosystem that supports them, to project-
required annually for domestic consumption within the
ed changes in sea surface temperature, ocean currents,
next 15 years.45
dissolved oxygen levels, and other ocean variables un-
The tuna fisheries of the Western and Central Pacific der IPCC’s continued high emissions “business as usual”
are among the best managed tuna stocks in the world, scenario in 2050 and 2100. The modelling indicates that
largely as a result of the work of South Pacific Forum significant changes in the distribution of the main tar-
Fisheries Agency and the Parties to the Nauru Agree- get species of skipjack, yellowfin, and bigeye tuna and
ment (PNA),46 as well as the Western and Central Pa- South Pacific albacore are expected to occur by 2050.
cific Fisheries Commission (WCPFC). However, there
The models suggest that there will be a strong eastward
is increasing evidence that many of these stocks may
shift in the distribution of skipjack and yellowfin tuna,
begin to migrate as the ocean continues to warm over
resulting in reduced abundance of both species in the
the course of the current century. The migration of fish
Exclusive Economic Zones (EEZs) of PICTs west of 170E
stocks as a result of climate change has been widely ob-
in the Western and Central Pacific Ocean. There might
served in other parts of the world and it is already known
also be a similar but weaker eastward shift in the distri-
that the distribution and abundance of tuna species is
bution of bigeye tuna. This shift to the east seems likely
influenced by natural climate variability through the in-
to mean that stocks will be moving out of the EEZs of
fluence of climate drivers such as the El Niño Southern
some of the Pacific coastal States and moving into the
Oscillation (ENSO) and the Pacific Decadal Oscillation
EEZs of others, but also into high seas areas, resulting
(PDO). During a La Niña event, tuna populations are
in a larger proportion of the catch of each species being
found more in the Western Pacific and during El Niño
made in international waters. A possible positive effect,
however, might be an increase in the biomass of South
44
See, Pacific Islands Oceanic Fisheries Management Fact Sheet Pacific albacore in the EEZs of Pacific Island Countries
(OFMP2) based on: “Climate Change Impacts, vulnerabilities and (PICs), although these predictions are uncertain due to
adaptation: Western and Central Pacific marine fisheries” in M.
Barange, T. Bahri, M.C.M. Beveridge, K.L. Cochrane, S. Funge-Smith,
poor information about likely future levels of dissolved
and F. Poulain, eds. 2018. Impacts of climate change on fisheries oxygen in oceanic waters.
and aquaculture: synthesis of current knowledge, adaptation and
mitigation options. FAO Fisheries and Aquaculture Technical Paper
No. 627, p. 628, available at: http://www.fao.org/3/i9705en/
i9705en.pdf 47
See, OFMP2, “Climate Change Impacts, vulnerabilities and
45
South Pacific Community (SPC), “Implications of climate-driven adaptation: Western and Central Pacific marine fisheries” at p. 2.
redistribution of tuna for Pacific Island economies”. SPC Policy Brief 48
SPC and Conservation International, “What are the effects of
No. 32 (2019) at p. 3. climate change on tuna fisheries in the Western and Central
46
The Nauru Agreement is a sub-regional agreement regulating Pacific Ocean?” (January 2019). The modeling and analyses
terms and conditions for tuna purse-seine fishing licenses in the were made possible through the support of the World Bank-
region. The Parties include Federated States of Micronesia, Kiribati, implemented Ocean Partnerships for Sustainable Fisheries and
Marshall Islands, Nauru, Palau, Papua New Guinea, Solomon Islands Biodiversity Conservation, a sub-project of the Common Oceans
and Tuvalu. ABNJ Program led by the FAO and funded by the GEF.LEGAL DIMENSIONS OF SEA LEVEL RISE: PACIFIC PERSPECTIVES / 7
Figure 1. Map of the EEZs of PICTs and international water high seas areas for the tropical Pacific Ocean.
Source: South Pacific Community, Division of Fisheries, Aquaculture and Marine Ecosystems, “Impact of climate and tuna fisheries in Pacific Island
waters and high seas areas: modelling the effects of climate change on tuna abundance in areas beyond national jurisdiction” (December 2018).
License fees from tuna fishing make a substantial con- Research and modelling done under the auspices of the
tribution to the government revenues of many PICTs. SPC shows that in the period up to 2050 the relative
Purse-seine fishing provides the vast majority of these abundance of skipjack and yellowfin tuna in the EEZs
important national economic benefits. Indeed, six PICTs of PICTs west of 170E (for example, Federated States of
derive approximately 30–100 percent of their govern- Micronesia, Marshall Islands, Nauru, Palau, Papua New
ment revenues from tuna fishing license fees.49 Tuna Guinea, and Solomon Islands) and in international wa-
ters (high seas) areas I1, I2 and H4 are projected to de-
fishing also makes significant contributions to the gross
cline. However, the relative abundance of tuna species
domestic product of Federated States of Micronesia
is expected to increase in the EEZs of most (but not all)
and Marshall Islands. It also supports the employment
PICTs east of 170 (for example, Cook Islands, Fiji, French
of almost 25,000 people across the region, through
Polynesia, Kiribati, Niue, Samoa, Tonga, and Vanuatu)
jobs on fishing vessels, in fish processing operations, and in all other high seas areas.50
and in management of tuna fisheries. The tuna stocks
that provide these economic and social benefits are in a 50
SPC Division of Fisheries, Aquaculture and Marine Ecosystems,
“Impact of climate change on tropical tuna species and tuna
healthy condition (that is, none of the tropical tuna spe-
fisheries in Pacific Island waters and high seas areas: Modelling
cies are overfished and overfishing is not occurring), due the effects of climate change on tuna abundance in areas beyond
largely to strong management of purse-seine fishing in national jurisdiction” (December 2018), Information Paper 6003922
(CI-4), developed for Conservation International (CI) as part of the
the EEZs of PICTs, particularly in the waters of the PNA. GEF-funded, World Bank implemented Ocean Partnerships for
sustainable fisheries and biodiversity conservation (OPP), a sub-
49
Ibid., p. 4. project of the Common Oceans ABNJ Program led by UN-FAO., p. 3.8 LEGAL DIMENSIONS OF SEA LEVEL RISE: PACIFIC PERSPECTIVES
Figure 2. Average historical (2005) distributions of skipjack, yellowfin and bigeye tuna, and South Pacific albacore
(Mt/km2) in the tropical Pacific Ocean, and projected changes in biomass of each species relative to 2005 under the
RCP8.5 emission scenario for 2050 and 2100, simulated using SEAPODYM.
Skipjack
2005 2050 2100
40 °N 40 °N 40 °N
20 °N 20 °N 20 °N
0° 0°
0°
20 °S 20 °S
20 °S
40 °N 40 °N
40 °N 150 °E 160 °W 110 °W 150 °E 160 °W 110 °W
150 °E 160 °W 110 °W
0 0.1 0.2 0.3 -0.2 -0.15 0 0.15 0.2 -0.2 -0.15 0 0.15 0.2
Yellowfin
2005 2050 2100
40 °N 40 °N 40 °N
20 °N 20 °N
20 °N
0° 0°
0°
20 °S 20 °S
20 °S
40 °N 40 °N
40 °N 150 °E 160 °W 110 °W 150 °E 160 °W 110 °W
150 °E 160 °W 110 °W
-0.15 -0.075 0 0.075 0.15 -0.15 -0.075 0 0.075 0.15
0 0.05 0.1 0.15
Bigeye
2005 2050 2100
40 °N 40 °N 40 °N
20 °N 20 °N 20 °N
0° 0° 0°
20 °S 20 °S
20 °S
40 °N 40 °N
40 °N
150 °E 160 °W 110 °W 150 °E 160 °W 110 °W
150 °E 160 °W 110 °W
-0.05 -0.025 0 0.025 0.05 -0.05 -0.025 0 0.025 0.05
0 0.01 0.02 0.03 0.04
South Pacific albacore
2005 2050 2100
0° 0° 0°
10 °S 10 °S 10 °S
20 °S 20 °S 20 °S
30 °S 30 °S 30 °S
40 °S 40 °S 40 °S
50 °S 50 °S 50 °S
150 °E 160 °W 110 °W 150 °E 160 °W 110 °W
150 °E 160 °W 110 °W
0 0.01 0.02 0.03 0.04 -0.04 -0.02 0 0.02 0.04 -0.04 -0.02 0 0.02 0.04
Source: Western and Central Pacific Ocean marine fisheries in “Impacts of climate change on fisheries and aquaculture Synthesis of current
knowledge, adaptation and mitigation options”, FAO Fisheries and Aquaculture Technical Paper 627 (Rome: FAO, 2018), p. 313, Figure 14.4.LEGAL DIMENSIONS OF SEA LEVEL RISE: PACIFIC PERSPECTIVES / 9
Figure 3. Projected changes in license revenue from the purse-seine fishery, in terms of value (USD) and as
a percentage of all government revenue, in 2050 relative to 2016 due to the effects of climate change on the
combined biomass of skipjack, yellowfin and bigeye tuna in the EEZ of 10 PICTs.
2016 2050 Change 2016–2050
Change (%)
Contribution in combined Contribution
of licence biomass of of licence Contribution
Total Govt. Tuna licence fees to SKJ, YFT & Total Govt. Tuna licence fees to Tuna licence to total
revenue fee revenue total Gov’t BET tuna by revenue fee revenue total Gov’t fee revenue Gov’t
PICT (EEZ) (USD m) (USD m)* revenue (%) 2050 (USD m) (USD m) revenue (%) (USD m) revenue (%)
EEZ west of 170E
FSM 133.9 63.2 47.2 -26 117.6 46.9 39.9 -16.3 -7.3
Marshall 64.7 29.2 45.1 -15 60.2 24.7 41.0 -4.5 -4.1
Islands
Nauru 56.0 27.8 49.6 -9 53.4 25.2 47.1 -2.6 -2.5
Palau 50.7 6.8 13.4 -24 49.1 5.2 10.6 -1.6 -2.8
Papua New 5366.7 128.8 2.4 -37 5319.0 81.1 1.5 -47.7 -0.9
Guniea
Solomon 411.9 41.6 10.1 -15 405.7 35.4 8.7 -6.2 -1.4
Islands
EEZ east of 170E
Cook Islands 143.8 12.8 8.9 18 146.1 15.1 10.3 2.3 1.4
Kiribati 217.5 118.3 54.4 15 235.4 136.2 57.9 17.9 3.5
Tokelau 13.6 13.3 98.0 -8 12.5 12.3 97.8 -1.0 -0.2
Tuvalu 39.0 23.4 60.0 -9 37.0 21.4 57.8 -2.0 -2.2
Total 465.2 403.5
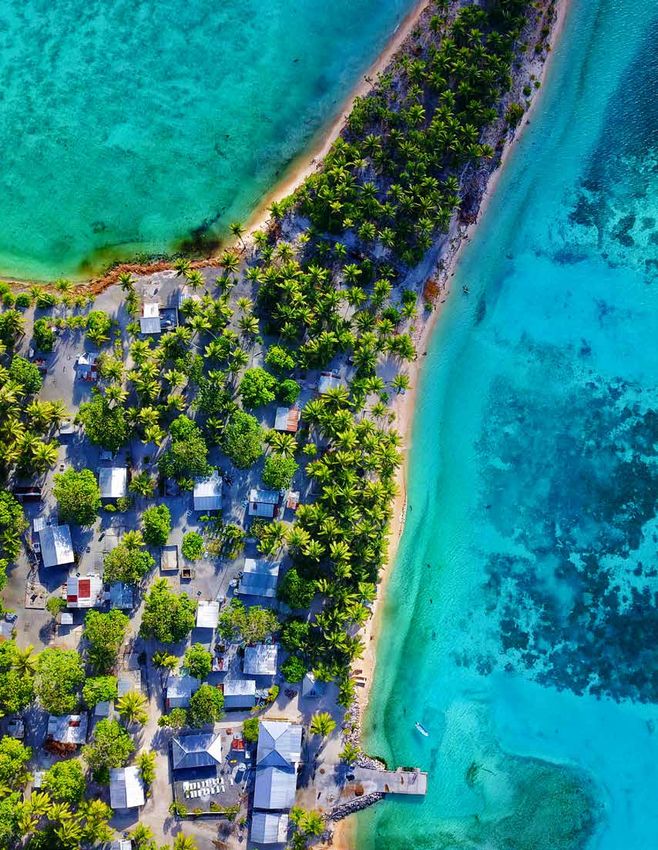
Source: Pacific Islands Forum Fisheries Agency.10 LEGAL DIMENSIONS OF SEA LEVEL RISE: PACIFIC PERSPECTIVES Atafu Atoll, Tokelau. Photo: World History Archive / Alamy Stock Photo
LEGAL DIMENSIONS OF SEA LEVEL RISE: PACIFIC PERSPECTIVES / 11

       Part II
 The Legal Regime Governing
  the Rights and Resources
of Coastal and Island States
in the Age of Climate Change
      and Sea Level Rise
12 LEGAL DIMENSIONS OF SEA LEVEL RISE: PACIFIC PERSPECTIVES
1. 1982 UN Convention on The contiguous zone stretches a further twelve nm sea-
ward. In addition, the coastal State is entitled to claim
the Law of the Sea an Exclusive Economic Zone (EEZ) out to 200 nm which
gives it sovereign rights (although not full sovereignty)
The 1982 UN Law of the Sea Convention (LOSC) has 320
over the resources of the seabed and the superjacent
Articles and nine Annexes; it was negotiated over nearly
waters.53 If a coastal State has a continental shelf that
a decade (1973–82) and entered into force in 1994. It
extends beyond 200 nm from the baseline, it is also—
represents codification as well as progressive develop-
subject to certain limitations—entitled to sovereign
ment of the law of the sea. Many of its innovative pro-
rights over those seabed resource of that shelf right to
visions are a carefully negotiated compromise between
the outer edge of the continental margin.54
different States’ interests.51
In the measurement of all these zones, the coastal
The legal regime for the determination of maritime
baseline plays a crucial role, as it does with the
zones, limits and boundaries is a mixture of pre-existing
delimitation of a State’s maritime boundaries with its
customary law rules and innovative new concepts, such
neighbors. In recognition of this, a coastal State that
as the regime for archipelagic States in Part IV of LOSC.
uses anything other than the “normal” low water line as
its baseline must commission and publicize charts of an
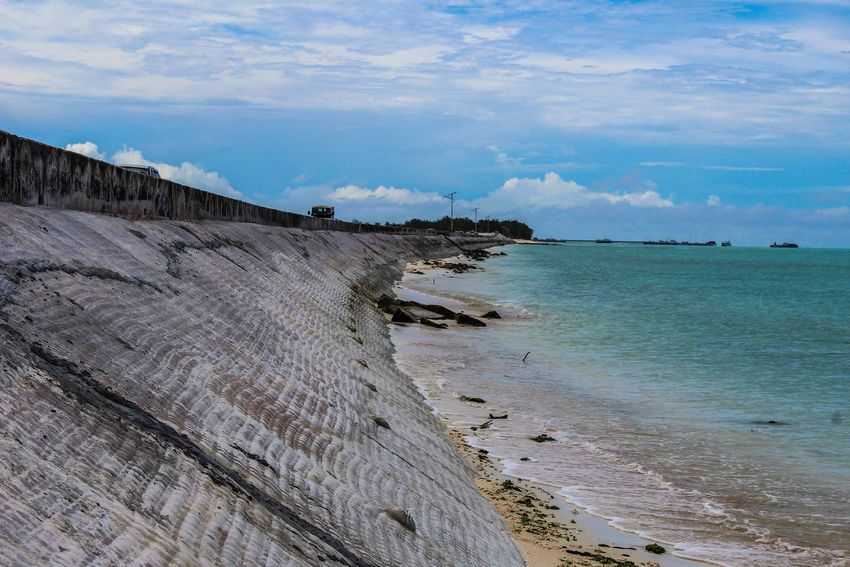
Figure 4. Coastal baseline and maritime zones adequate scale to show its baselines, and submit them
stipulated under LOSC. (or their geographical co-ordinates) to the Secretary-
General of the United Nations (UNSG).55 It is also obliged
to publish, publicize and similarly submit charts or co-
Continental Shelf
Territorial Sea Baseline
The ordinates of any delimitation lines of any maritime
Sea-bed, Subsoil, Sedentary Species Area
(Extended boundary agreements with other States.56
Continental Shelf)
Exclusive Economic There are few, if any, States that do not have a
Zone (EEZ) High Sea
neighboring State whose own maritime zones abut it,
Internal waters
Water Column,
Sea-bed, Subsoil
Contiguous 200 M
either as an adjacent or opposite State. Where a State
12 M zone
Territorial 12 M has an opposite or adjacent neighbor, the LOSC enjoins
sea Sea Level
those States to reach agreement on the delimitation
of a maritime boundary. For territorial sea boundaries
between adjacent States or those less than 24 nm
Upper
Slope
Plateau apart, there is a presumption of equidistance in that in
or
Terrace Lower
Rise Deep the absence of historic title or special circumstances,
Slope Ocean
no State may legitimately claim beyond a median line.57
Source: Andi Arsana and Clive Schofield, Manual on Technical Aspects For other boundaries, however, there is an obligation to
of the Law of the Sea (TALOS Manual), International Hydrographic reach agreement based on international law to reach an
Organization, Special Publication No.51, (Monaco: International
Hydrographic Bureau, 2014), Figure 5.1. “equitable solution.”58
In the case of islands situated on atolls or having fringing
The Coastal Baseline reefs, the baseline may be drawn from the seaward low
water line of the reef. Similarly, where an insular feature
The coastline is the starting point for the measure- which is only above water at low tide—a low tide elevation
ment of a coastal State’s maritime zones. The “nor- (LTE)—is situated less than twelve nm from the main-
mal” baseline is “the low water line along the coast as land or an island—this may also be used as a basepoint.59
marked on large scale charts officially recognized by the
coastal State.”52 From this baseline can be measured
the State’s twelve nautical mile (nm) territorial sea, the 53
LOSC, Part V, Arts. 55-75.
outer boundary of which is a line “every point of which is
54
LOSC, Part VI, Arts. 76-85.
55
LOSC, Art. 16.
[twelves miles] from the nearest point of the baseline…”. 56
For boundaries in the territorial sea, LOSC, Art. 16. Also, for the EEZ,
Art. 75 and continental shelf, Art. 84.
57
LOSC, Art. 15.
51
The so-called “Package deal”. 58
For EEZ, LOSC Art. 74; continental shelf, Art. 83.
52
LOSC, Art. 5. 59
LOSC, Art. 13.You can also read