KOO 2011 - UN Environment Document Repository ...
←
→
Page content transcription
If your browser does not render page correctly, please read the page content below
UNE P
YEAR
B OOK
EMERGING ISSUES
IN OUR GLOBAL ENVIRONMENT

                      2011
    United Nations Environment Programme
© 2011 United Nations Environment Programme
ISBN: 978-92-807-3101-9
UNEP/GC.26/INF/2
DEW/1300/NA

Disclaimers
The content and views expressed in this publication are those of the authors and do not necessarily reflect the views or policies, or carry
the endorsement of the contributory organisations or the United Nations Environment Programme (UNEP).
The designations employed and the presentation of material in this publication do not imply the expression of any opinion whatsoever
on the part of UNEP concerning the legal status of any country, territory or city or its authorities, or concerning the delimitation of its
frontiers and boundaries.
Reference to a commercial company or product in this publication does not imply the endorsement of UNEP.
© Maps, photos, and illustrations as specified.
Photo credits for front and back covers: Bill Macdonald (front top), Lasse Arvidson/Stora Enso (front bottom), Design Pics/Still Pictures
(front middle), Ningxia Forest Bureau (back top), Pat Danna/www.patdanna.com (back bottom right), Tara Thompson (back bottom left)

Reproduction
This publication may be reproduced in whole or in part and in any form for educational or non-profit purposes without special
permission from the copyright holder, provided acknowledgement of the source is made. UNEP would appreciate receiving a copy of
any publication that uses this publication as a source.
No use of this publication may be made for resale or any other commercial purpose whatsoever without prior permission in writing
from UNEP. Applications for such permission, with a statement of purpose and intent of the reproduction, should be addressed to the
Director, Division of Communications and Public Information (DCPI), UNEP, P.O. Box 30552, Nairobi 00100, Kenya.
The use of information from this publication concerning proprietary products for publicity or advertising is not permitted.
This publication was printed in chlorine free ISO 9706 and ISO 14001 (environment) certified facilities, using vegetable inks
and water-based varnish. It is made from 100 per cent post-consumer waste, contains no mill broke, and is certified by the Forest
Stewardship Council.

Produced by
UNEP Division of Early Warning and Assessment
United Nations Environment Programme
P.O. Box 30552
Nairobi, 00100, Kenya
Tel: (+254) 20 7621234
Fax: (+254) 20 7623927
E-mail: uneppub@unep.org
Web: www.unep.org
UNEP Year Book 2011: Emerging issues in our global environment,
United Nations Environment Programme, Nairobi. Published February 2011
Website: http://www.unep.org/yearbook/2011                                                                 UNEP promotes
                                                                                                  environmentally sound practices
Project coordination/editors: Tessa Goverse and Susanne Bech                                      globally and in its own activities.
Graphics, layout and printing: Green Ink Ltd, United Kingdom                                 This publication is printed on chlorine free
Distribution: SMI (Distribution Services) Ltd., United Kingdom                             paper from 100 per cent post-consumer waste.
This publication is available from http://www.earthprint.com                                   Our distribution policy aims to reduce
                                                                                                      UNEP’s carbon footprint.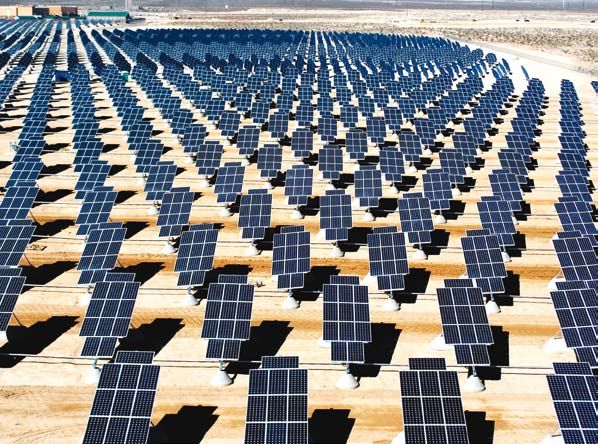
UNEP
YEAR
BOOK
EMERGING ISSUES
IN OUR GLOBAL ENVIRONMENT

                      2011
     United Nations Environment Programme
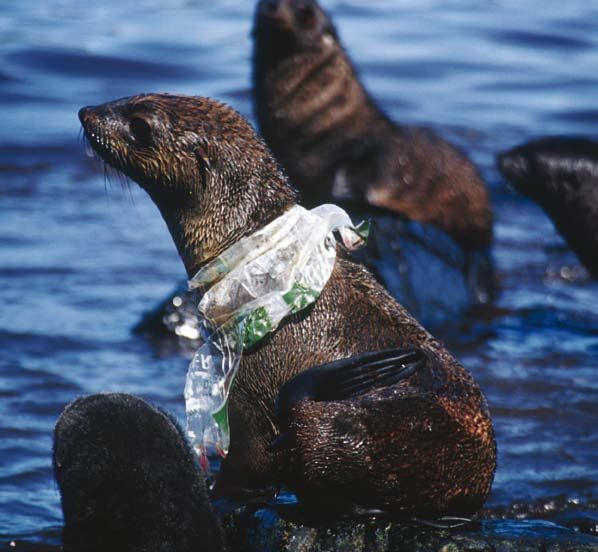
Table of Contents
             Preface                                                                   v
             Executive Summary                                                         vi

             Events and Developments                                                   1
                Sustainable development and a green economy                            1
                Calendar of events 2010                                                2
                Renewable energy                                                       4
                Keeping the climate momentum going                                     5
                Reducing black carbon and tropospheric ozone                           7
                Emerging connections between air pollution and human health            9
                Warming lakes                                                         12
                Biodiversity under threat—time to act                                 12
                Getting involved: citizen science                                     14
                Sustainable agricultural development                                  16
                Reversing desertification in Ningxia, China                           17
                References                                                            18
                Upcoming events 2011                                                  19

             Plastic Debris in the Ocean                                              21
                Assessing the extent of the problem                                   21
                Physical and chemical impacts                                         25
                Social and economic effects: ‘wider than the ocean’                   28
                Tackling the issues, managing the problems                            28
                Looking ahead                                                         32
                References                                                            32

             Phosphorus and Food Production                                           35
               Supplying a critical nutrient                                          35
               A resource reconsidered: environmental solutions                       39
               Looking ahead                                                          44
               References                                                             45

                                                                      UNEP YEAR BOOK 2011   iii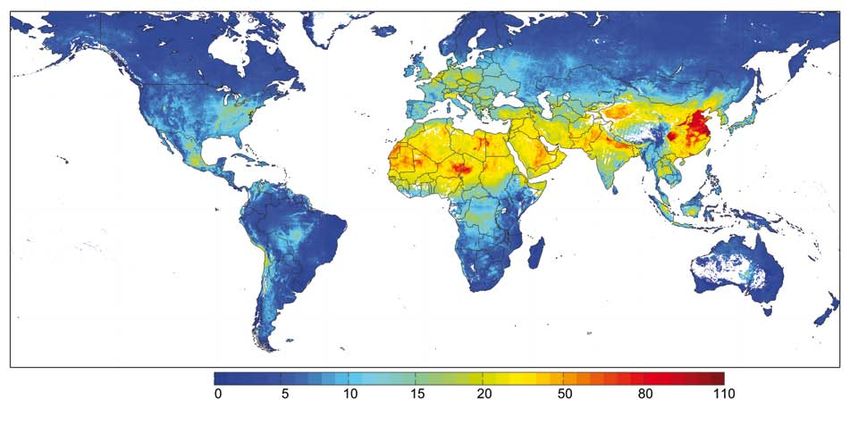
Emerging Perspectives on Forest Biodiversity             47
                     Drivers and consequences of forest biodiversity loss   48
                     Approaches to biodiversity conservation                51
                     Giving full value to living forests                    54
                     Trends in forest governance                            56
                     Looking ahead                                          56
                     References                                             58

                   Key Environmental Indicators                             61
                     Depletion of the ozone layer                           62
                     Climate change                                         62
                     Natural resource use                                   65
                     Biodiversity loss                                      67
                     Waste                                                  68
                     Water                                                  68
                     Environmental governance                               70
                     References                                             73

                   Acknowledgements                                         74
                   Acronyms                                                 76
                   Index                                                    77

iv   UNEP YEAR BOOK 2011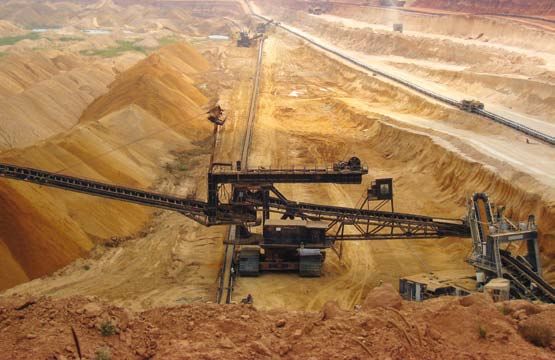
Preface
The world is again on the Road It also spotlights growing scientific concern over the
to Rio, almost 20 years after the chemical and material impact of marine litter on wildlife and the
Earth Summit of 1992 that laid human food chain, as well as the crucial role of biodiversity in
out the treaties, policies and maintaining healthy forests.
principles towards sustainable With the right public policies and enabling conditions, these
development. challenges can be addressed in ways that reduce humanity’s
The intervening years environmental footprint while generating new kinds of
have witnessed an extra business and employment, for example in sustainable waste
ordinary explosion in scientific management—one of the ten sectors identified as key to
understanding of the impacts catalysing a transition to a low carbon, resource efficient Green
of human activity on the planet Economy.
and atmosphere. The window for action is narrowing. As the Year Book
That science has informed policymakers on the options underlines, persistent issues are in many cases becoming more
and choices for change and has assisted in evolving responses, acute, whilst new ones are emerging.
such as the greenhouse gas emission reduction treaty—the Next year at Rio+20, governments need to urgently address
Kyoto Protocol—or more recently a decision to establish the gap between science and how to form a decisive response as
an International Regime on Access and Benefit Sharing part of an overall package that finally aligns the economic pillar
of Genetic Resources at the Convention on Biological Diversity of sustainable development with the social and environmental
(CBD) meeting in Nagoya, Japan last year. ones.
The UNEP Year Book 2011 underlines some of the successes The UNEP Year Book 2011 is a snapshot of the world 15 months
achieved when science is fully brought into service for before Rio+20—perhaps future Year Books may reflect a different
sustainable development. Yet, it also spotlights that many of story as a result of the evolutionary decisions taken in Brazil
the international responses to the challenges remain at best in 2012.
a patchwork: at worst, often far behind the scale and pace of
environmental change being witnessed today.
The 2011 Year Book showcases and explains three emerging
issues. The first—the wider impacts of phosphorus use in food
production, pointing to concerns over the future availability of
phosphorus supplies —in contrast with the millions of tonnes Achim Steiner
of fertilizer washed from the land into the seas triggering algal United Nations Under-Secretary-General and Executive Director,
blooms and damage to fish stocks and tourism-based industries. United Nations Environment Programme
UNEP YEAR BOOK 2011 v
Executive Summary
     The UNEP Year Book series provides an annual update on new               when plastic debris enters the food chain through ingestion by
     science and developments. It brings emerging environmental               fish and other marine organisms.
     issues to the attention of governments and other stakeholders                Plastic debris can damage nets, foul propellers, and pollute
     for their consideration. The Year Book is part of a suite of UNEP        beaches and other areas, with major economic impacts on the
     products whose aim is to strengthen the science-to-policy                fishing and tourist industries. Local governments and other
     interface.                                                               bodies spend millions of dollars per year on cleaning up plastic
          The events and developments presented in the UNEP Year              and other marine litter. To reduce the volume of plastic entering
     Book 2011 remind us that it is urgent to achieve results in the          the ocean, all aspects of waste management need to be improved
     international climate change processes. Although countries’              and existing policy instruments strengthened.
     greenhouse gas reduction pledges are contributing significantly to           Phosphorus is a critical nutrient for food production. Further
     the emission reductions required to keep the temperature increase        insight is needed into the long-term availability of this essential
     during the 21st century below 2°C, scientists warn that there is still   plant nutrient and the environmental consequences of its
     a considerable ‘emission gap’ of 5 gigatonnes to be closed. The          use. Agricultural practices commonly include the application
     need to reduce emissions of black carbon and tropospheric ozone          of phosphorus fertilizers made from phosphate rock, a non-
     precursors has received comparatively little attention so far. New       renewable resource used increasingly since the late 19th century.
     science shows that reducing such air pollutants could go a long          While several countries have commercially exploitable amounts of
     way towards mitigating climate change in the short term, while           phosphate rock, those countries with no domestic reserves could
     also improving human health and food security.                           be especially vulnerable to global shortfalls.
          A global dialogue on greening the economy has begun,                    Over four times as much phosphorus flows through the
     driven by environmental concerns and economic opportunities.             environment today as before phosphorus fertilizer began to
     While countries have renewed their commitments to work                   be used in agriculture, yet only small amounts are recovered
     towards environmental sustainability, and have agreed on global          and recycled from waste streams. Optimization of agricultural
     strategies for doing so, the private sector is responding to new         practices, erosion control and the exploration of innovative
     business opportunities and signals that threats to ecosystems            approaches, such as phosphorus recovery from water treatment
     could undermine their operations. The rapid expansion of                 installations, would reduce environmental pressures and enhance
     mobile technology is creating new possibilities to further engage        long-term phosphorus supply.
     citizens in environmental decision making. Citizen science can               Our knowledge and understanding of biodiversity have never
     help to address important data gaps, especially with respect to          been greater than they are today. But neither have the pressures
     biodiversity monitoring.                                                 on biodiversity ever been greater. Loss of forest biodiversity
          Today the human footprint extends to the remotest parts of          can reduce the resilience of forests and leave them increasingly
     the ocean. Even there, plastic can be found. The ocean has become        vulnerable to mounting pressures, as shown in the example
     a global repository for much of the waste we generate. Every year        of the mountain pine beetle outbreak presented in the Year
     large amounts of plastic debris enter the marine environment,            Book. Strongly focusing on forests as the key to managing the
     where it slowly fragments and accumulates in convergence zones.          world’s carbon stocks—while disregarding the important role
     In particular, scientists are looking at the potential impacts of        of biodiversity in building forest resilience—may lead to major
     small plastic fragments, or microplastics. The role of plastics as a     investments in systems that are vulnerable to fire or pest outbreaks,
     vector for transporting chemicals and species in the ocean is as yet     which could nullify gains made in carbon sequestration.
     poorly understood, but it poses a potential threat to ecosystems             Conservation of forest biodiversity is fundamental to
     and human health. A number of scientists are concerned about             sustaining forests and people in a world that is adapting to climate
     releases of persistent, bio-accumulating and toxic compounds             change. Ecosystem-based approaches recognize the importance

vi   UNEP YEAR BOOK 2011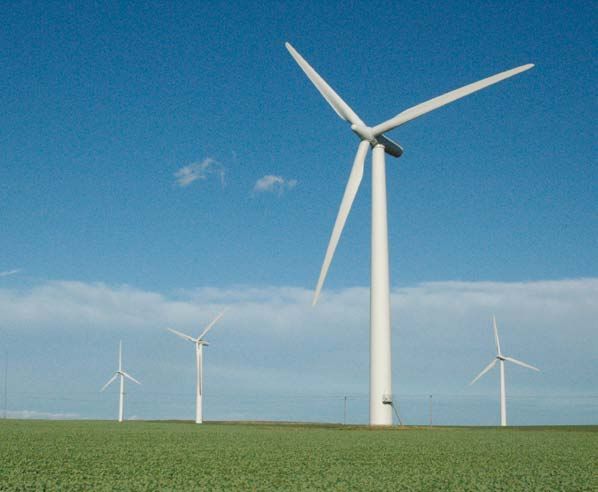
of biodiversity and the need for broad stakeholder participation
in forest-related decision making in order to arrive at more
effective conservation outcomes. New approaches to biodiversity

                                                                    Credit: Vera Kratochvil
conservation are promising, but they need to be matched by more
effective governance and greater financial investments.
    Environmental indicators such as those in the Year Book can
help assess the impacts of complex interactions between people
and the environment. The latest available data and trends show
progress in addressing stratospheric ozone depletion, the need
for more renewable energy and the need for environmental
certification schemes. Global carbon dioxide emissions are still
increasing and pressures on ecosystems from the use of natural
resources continue, with notable impacts in terms of biodiversity

                                                                    Credit: Project Kaisei
loss. Poor availability of environmental data—especially from
developing countries—remains a major constraint on identifying
and following global environmental trends.
    The Year Book gives numerous examples of practical measures
that can be taken to prevent further pollution and resource
depletion. However, the persistence of environmental problems
tracked over time also shows that there is still much room to
improve the effectiveness of environmental governance.
    As countries prepare for the World Summit in 2012 in Brazil

                                                                    Credit: D.M.G. de Sousa
(Rio+20), it is important to signal emerging challenges that
could undermine sustainable development efforts -  alongside
promising signs that countries, companies and communities are
starting to embrace the transition to a low-carbon, resource-
efficient economy.

UNEP welcomes your feedback. Readers are invited to use the
questionnaire form available at www.unep.org/yearbook/2011/
                                                                    Credit: José Badelles
                                                                    Credit: Edward Obi-Akpere

                                                                                                UNEP YEAR BOOK 2011   vii
On 140 acres of unused land at Nellis Air Force Base, Nevada, United States, 70 000 solar panels are part of a solar photovoltaic array that will
generate15 megawatts of solar power for the base. Credit: Nadine Y. Barclay/USAF

UNEP YEAR BOOK 2011
Events and Developments
Driven by environmental concerns and economic opportunities, a global dialogue on greening the
economy has begun. Countries have renewed their commitments to work towards environmental
sustainability at various international fora, and some have initiated national actions. The private sector
is responding not only to clean technology and green investment opportunities, but also to signals that
threats to ecosystems could have serious impacts on business operations. At the same time, scientists
and others point out multiple approaches and technologies available for the reduction of greenhouse
gas emissions. These international events and developments—together with a series of extreme weather
events—continue to urge us to achieve results in international climate change processes.

                                                                  1
Environmental events and developments during the past year             Sustainable development and a green economy
present a mixed picture. A review of the status of the achievement
of the Millennium Development Goals (MDGs) in September                While the world is slowly recovering from economic and financial
showed that many countries, including some of the poorest,             crises, a global dialogue on natural capital and greening the
have made good progress. However, more efforts are required in         economy has begun in countries, communities and companies.
regard to Goal 7 on ensuring environmental sustainability. Rapid       The need for urgent action to address climate change in the first
biodiversity loss has not been halted, but in October governments      half of the 21st century is fostering this dialogue, which is also
agreed on new targets. They also agreed to establish a new body        stimulated by abundant potential economic opportunities for
to provide the science-policy interface for biodiversity. The latest   those who undertake the transition to a green economy.
round of climate negotiations, held in December in Cancún,                 A decade after the 2000 Millennium Summit, governments
Mexico, put the world’s efforts on climate change back on track.       met at the High-level Plenary Meeting of the 65th Session of the
The package of decisions agreed succeeded in ‘anchoring’ the           UN General Assembly to review progress on achieving the MDGs
national targets and actions governments had put forward in            and to renew their commitment to achieve the targets for 2015.
and after the 2009 climate conference in Copenhagen, Denmark.          Developing countries have made major progress on the health
Nevertheless, a significant emissions gap exists between what          and education targets, but global progress has been slow on other
is being promised by countries and what is needed to keep the          goals, including ensuring environmental sustainability (IISD 2010,
rise in global temperature below 2°C. Agreeing a process to close      UNGA 2010). Key areas where progress on this goal could be
this gap will be one of the major challenges at the global climate     accelerated include:
negotiations in 2011 in Durban, South Africa.                              implementation of the three UN Conventions on combating
    2010 was a year of extreme weather. The World Meteorological           desertification, biological diversity and climate change, as
Organization (WMO) reported that it tied with 1998 and 2005                well as the global objectives on forests and sustainable forest
as the warmest years on record (WMO 2011). There were                      management;
950 major natural disasters in 2010 compared to 785 in 2009.               new and renewable energy sources, low-emission
The heat wave in the Russian Federation and in particular the              technologies, more efficient energy use, greater reliance
flooding in Pakistan resulting from an unusual stagnant jet                on advanced energy technologies, and sustainable use of
stream, caused the loss of many lives (Red Cross 2011). Still              traditional energy sources;
unclear are the environmental impacts stemming from the                    sustainable access to safe drinking water and basic sanitation;
months-long discharge of crude oil into the Gulf of Mexico that            integrated waste management systems;
will go on record as one of history’s worst oil spill disasters. The       sustainable management of marine biodiversity and
environmental impacts will be monitored over the next few                  ecosystems, and preservation of fragile mountain ecosystems;
years and are continuously evaluated.                                      sustainable consumption and production patterns.

                                                                                                             EVENTS AND DEVELOPMENTS         1
Calendar of events 2010
JANUARY 18-19 March 24-28 May
12 January Fourth meeting of UN-REDD Programme Fourth Global Environment Facility (GEF)
Magnitude 7.0 earthquake kills some Policy Board approves US$14.7 million Assembly at Punta del Este, Uruguay,
230 000 people and leaves 1.5 million in funding for national climate change agrees on basic financing framework,
homeless in the region around Haiti’s mitigation programmes in Bolivia, the and a replenishment of US$4.2 billion.
capital, Port-au-Prince. Cholera outbreak Democratic Republic of the Congo and Contributing to the GEF Trust Fund is one
in October claims more than 1 200 lives, as Zambia. US$15.2 million approved in way for governments to comply with
tens of thousands of Haitians are still living November for programmes in Cambodia, their commitments under multilateral
in crowded tent cities with poor sanitation Papua New Guinea, Paraguay, the environmental agreements.
and little access to clean drinking water. Philippines and the Solomon Islands.
JUNE
FEBRUARY APRIL 5 June
24-26 February 14-20 April World Environment Day celebrations in
Eleventh Special Session of UNEP Ash covers large areas of northern Europe Rwanda culminate in traditional gorilla-
Credit: Daniel Beltrá
Governing Council/Global Ministerial when Iceland’s Eyjafjallajoekull volcano naming ceremony in Volcanoes National
Environment Forum delivers first landmark erupts. About 20 countries close their Park, attended by 30 000 people.
Declaration issued by ministers of the airspace, affecting hundreds of thousands Rwandan President Paul Kagame, actor
environment in a decade, pledging of travellers worldwide. The grounding and UNEP Goodwill Ambassador Don
to step up global response to major of European flights avoided an estimated Cheadle, and UNEP Executive Director
environmental and sustainability 344 109 tonnes of CO2 emissions per day Achim Steiner are among the guests
challenges. Governments also agree on co- while the volcano emitted about 150 000 invited to name baby gorillas.
operative action by the Basel, Rotterdam tonnes of CO2 per day. MAY
and Stockholm Conventions. 3-14 May
Eighteenth session of United Nations
27 February Commission on Sustainable Development
Earthquake in central Chile measuring 8.8 (CSD) focuses on the thematic cluster of
kills more than 700 and causes widespread transport, chemicals, waste management,
damage in many parts of the country, mining, and sustainable consumption
Credit: www.wildlifedirect.org
particularly near Concepción, the second and production patterns. Ways to advance
largest metropolitan area. Around half implementation of decisions of the
a million homes are seriously damaged. Commission are discussed.
Losses to Chile’s economy are estimated at
US$15-30 billion. 12 May
Abu Dhabi, United Arab Emirates, wins
Arab world’s top ‘green city’ and ‘most
environmentally friendly city’ awards.
Credit: Pan-African News Wire File
This double recognition is announced
at a ceremony for Arab cities leading in 20-25 June
environment, greening and landscaping, Thirteenth session of the African
technology and architecture. Ministerial Conference on the
Environment (AMCEN) in Mali adopts
20 May the Bamako Declaration, a new road
Scientists develop first living cell controlled map for sustainable development in
Credit: Eyjólfur Magnússon
Photos
by a synthetic genome. They hope this Africa and a basis for strengthening the
method can be used to engineer bacteria common negotiating position on
designed to solve environmental or energy climate change and biological
problems, for example algae that capture diversity.
MARCH CO2 and make new hydrocarbons that could
13-25 March be used in refineries.
Fifteenth Conference of the Parties to
17-19 May JULY
Convention on International Trade in July-August
Endangered Species of Wild Fauna and Flora 20 April First session of Preparatory Committee
Heaviest monsoon rains in over
(CITES) adopts decisions on strengthening Oil rig ‘Deepwater Horizon’ explodes in (PrepCom) for 2012 United Nations
80 years produce the worst floods in
wildlife management for several reptiles, the Gulf of Mexico, resulting in the largest Conference on Sustainable Development
Pakistan’s history, destroying homes and
combating illegal tiger and rhinoceros accidental marine oil spill in the petroleum assesses gaps in implementing outcomes of
farmland and affecting an estimated
trafficking, and updating trade rules for a industry’s history and causing damage to major summits on sustainable development
3.2 million people. The number of
wide range of plants and animals. wildlife and marine habitats, and to the and emerging challenges, and agrees
livestock lost is around 80 000, while
fishing and tourism industries. Five million on ‘open-ended informal intersessional
2 million hectares of farmland are
barrels flow into the Gulf before the well is meetings’ of not more than six days in
underwater.
permanently sealed on 19 September. length.
2 UNEP YEAR BOOK 2011OCTOBER NOVEMBER 29 November-10 December
5 October 8-12 November Cancún Climate Change Conference in
In Hungary, toxic red sludge from an Twenty-second session of the Meeting Mexico sets governments on a path towards
alumina plant floods nearby villages. Ten of the Parties to the Montreal Protocol a low-emissions future and enhanced
people are killed and 120 injured. Some on Substances that Deplete the Ozone action on climate change in the developing
600 000 to 700 000 cubic metres of sludge Layer adopts 16 decisions, including on world. Parties to the Kyoto Protocol agree
escapes. It is estimated that the clean-up the terms of reference for evaluating the to continue negotiations, with the aim of
will take more than a year and cost tens of financial mechanism. It is unable to make ensuring that there is no gap between its
millions of dollars. progress on low global warming potential commitment periods.
alternatives or the destruction of ozone
Credit: Ax Grift
destroying substances.
DECEMBER
10-11 November
Credit: Varga György/MTI Fotó
3 December
In Seoul, Republic of Korea, for the first time Ten European countries agree to develop
at a G-20 meeting, more than 100 Chief an offshore electricity grid in the North Sea
AUGUST Executive Officers (CEOs) meet to review costing up to US$40 billion. The ultimate
4 August strategies for a greener global economy. vision is a European ‘supergrid’ providing
Giant chunk of ice breaks off Petermann Corporate leaders from 34 countries renewable energy supplies throughout
glacier in northwest Greenland, forming the urge the G-20 to facilitate green growth, Europe by tapping into vast solar resources
largest iceberg in the northern hemisphere. including improvements in energy from the Mediterranean and wind from
Measuring about 30 by 14 kilometres, efficiency and creation of ‘green jobs’. the north.
it covers an area of some 245 square
kilometres. The Petermann glacier, one of 12-15 October 21-23 November
Greenland’s largest, regularly advances Seventh African Development Forum At its second meeting in Helsinki, Finland,
towards the ocean at about 1 kilometre convenes with the theme ‘Acting on Climate the Consultative Group of Ministers or
per year. Change for Sustainable Development High-level Representatives on International
in Africa’. Among the outcomes is the Governance identifies potential system-
establishment of a partnership on ‘Africa’s wide responses to the challenges of
options for a Green Economy’. international environmental governance.
Credit: UNEP
They include strengthening the science-
18-29 October policy interface and developing a system-
At the Biodiversity Summit in Nagoya, wide strategy for environment in the United
Japan, participants representing the Nations system.
Credit: NASA Earth Observatory
193 Parties to the Convention on Biological
Diversity (CBD) adopt a new ten-year 21-24 November 21 December
Strategic Plan to guide efforts to save Heads of governments of 13 Tiger Range United Nations General Assembly adopts
biodiversity and the Nagoya Protocol on Countries at the International Tiger the creation of the Intergovernmental
Access to Genetic Resources and the Fair Conservation Forum in St Petersburg, Platform on Biodiversity and Ecosystem
and Equitable Sharing of Benefits Arising Russia, agree to save wild tigers from Services (IPBES) after governments gave a
from their Utilization. extinction and double their number by green light in June at a meeting in Busan,
2022. Worldwide, the population of tigers in Republic of Korea. The body will carry out
the wild fell from 100 000 to just over 3 000 high-quality peer reviews of new science
during the past century. on biodiversity and ecosystems and outline
1-26 August policy responses.
Wildfires sweeping across Russia destroy
more than 300 000 hectares of forest, 31 December-January
for Sustainable Development
Credit: International Institute
vegetation and peatland. At least More than 200 000 people are affected by
53 people are killed and thousands are flooding in Queensland state, northeast
evacuated. In Bolivia, wildfires ravage Australia, with the flood zone stretching
1.5 million hectares of forests and over an area bigger than France and
grasslands. Germany combined. Thousands of people
are evacuated from their homes. Cleanup
efforts are expected to cost billions of
SEPTEMBER dollars.
20-22 September
United Nations Summit on the Millennium 26 October
Hunters’ reports lead scientists to discover
Credit: Valerie Abbott
Development Goals (MDGs) concludes
with the adoption of a global action plan a new primate species, the Myanmar snub-
to achieve the eight MDGs by their 2015 nosed monkey (Rhinopithecus strykeri), in
target. Major new commitments and the country’s northern forests. Local people
report that it is easy to find the monkey, Sources: Please go to
initiatives are announced, including on
which sneezes when it rains. www.unep.org/yearbook/2011/
ensuring environmental sustainability.
EVENTS AND DEVELOPMENTS 3Also emphasized at the summit were the need for greater first year that new low-carbon energy capacity exceeds new
co-ordination among local and national institutions responsible fossil-fuel capacity (UNEP and Bloomberg New Energy Finance
for economic and social development and environmental 2010). This is supported by other signs of a more permanent
protection, and the need to encourage investments in sustainable shift towards sustainable energy, such as an accelerating energy
development (UNGA 2010). efficiency improvement rate; growth in public investment in low-
The challenge of promoting sustainable development while carbon technology research, development and demonstration;
achieving economic growth is motivating decision makers to and further development of hybrid and fully electric vehicles by
take a serious look at policy measures oriented towards green leading companies (IEA 2010a).
growth and innovation (G20 Seoul Summit 2010). For example, The latest available data show that in 2009, for the second year
the Republic of Korea spends the equivalent of more than 3 per in a row, both Europe and the United States added more power
cent of its annual GDP on green technology (Barbier 2009). capacity from renewable sources such as wind and solar than
The development and uptake of renewable energy from conventional sources like coal, gas and nuclear. Renewables
technologies is rapidly gaining momentum, creating millions accounted for 60 per cent of newly installed capacity in Europe
of jobs. More opportunities to create ‘green jobs’ are emerging and more than 50 per cent of that in the United States in 2009.
in natural resource management, sustainable food production, By 2010 or 2011, experts predict that the world as a whole will
waste processing and other fields. add more capacity to the electricity supply from renewable than
non-renewable sources (REN 21 2010, UNEP and Bloomberg New
Energy Finance 2010). Demand for renewable energy is expected
to triple over the next decades, with its share in electricity supply
increasing from one-fifth to one-third (Figure 1).
To achieve a low-carbon future, increased energy efficiency
is essential. Low-cost options for reducing energy consumption
in buildings can contribute significantly to cuts in CO2 emissions
(Box 1). Around 10 per cent of global CO2 emissions come directly
from buildings; when indirect emissions from their electricity use
are included, this share increases to almost 30 per cent (IEA 2010a).
The green economy promises to create more ‘green jobs’ in the future. Credit: OECD Pacific 2008
Sam Hummel 2035
Africa
2
India
Renewable energy Brazil
Climate change, pollution, resource depletion, and the desire for China
energy security are persuading countries to make the transition
United States
from energy supply based on fossil fuels alone to greater energy
efficiency and the use of renewable energy sources—thereby European Union
contributing to the transition to a green economy (Brown 2009).
While China overtook the United States in 2010 as the world’s 0 100 200 300 400 500
largest energy user, it has also become a renewable energy million tonnes of oil equivalent
leader, especially for wind and solar power (IEA 2010a). Global
Figure 1: Projected renewable energy demand, 2008-2035. The share of
new investment in sustainable energy reached US$162 billion
renewables in global electricity generation is projected to increase from 19
in 2009, adding an estimated 50 gigawatts (GW) of renewable to 32 per cent between 2008 and 2035, mainly due to increases in wind
energy generation capacity in addition to 28 GW of new large and hydropower. Source: IEA (2010b)
hydroelectric capacity. If the trend continues, 2011 could be the
4 UNEP YEAR BOOK 20113
Keeping the climate momentum going
At the end of 2010, governments reaffirmed their commitment
to combat climate change at the UN Climate Change Conference
in Cancún, Mexico. They agreed to a process to design a
Green Climate Fund; a new Adaptation Framework to allow
better planning and implementation of adaptation projects;
and a technology mechanism with a Technology Executive
Committee and Climate Technology Centre and Network to
increase technology co-operation in support of action on
adaptation and mitigation. They also agreed to boost action to
curb emissions from deforestation and forest degradation in
developing countries with technological and financial support,
and reaffirmed the goal set in Copenhagen in 2009 to provide
US$100 billion annually in aid for poor countries up to 2020
(UNEP 2010a).
Alongside the formal discussions in Cancún, a series of events
brought together heads of state and representatives of regional
and local governments, business and civil society, showcasing
how some sectors, communities and individuals are rapidly
moving ahead to make the transition to a low-carbon future.
National strategies are being developed in many countries,
including Mexico and Uruguay. This momentum is essential to
the campaign to combat climate change.
In the lead-up to Cancún, UNEP and climate scientists
published a report showing that a significant emissions gap exists
between what is being promised by countries and what is needed
to keep a global temperature rise below 2°C in the twenty-first
century. That gap remains post Cancún. The report estimated
Leading by example within the United Nations System: UNEP and that, to have a likely chance of staying below 2°C, global emissions
UN-Habitat move to energy-efficient offices in Nairobi, Kenya. Credit: need to peak at around 44 gigatonnes (Gt) of CO2 equivalent in
Márton Bálint
2020. Fully implementing the pledges and intentions associated
with the Copenhagen Accord and now reflected in the Cancún
Box 1: Energy saving in buildings
Agreements (Figure 2), could in the best case identified by the
Many consumers in the future may have smart meters in their homes report, cut emissions to around 49 Gt of CO2 equivalent by 2020.
to track and manage energy use, although practical applications of This would leave a gap of around 5 Gt of CO2 equivalent that
this technology are still being assessed. About 20 per cent of the needs to be bridged over the coming decade—an amount equal
energy used in buildings could potentially be saved through correcting to the emissions of all the world’s cars, buses and trucks in 2005
mechanical faults and malfunctions and reducing unnecessary
operation. Initial deployments of advanced control systems currently (UNEP 2010b).
under development suggest that such systems could save an additional Investments of more than US$2 trillion per year in
10 to 20 per cent. It is possible to reduce real-time energy use and save infrastructure alone between 2010 and 2030 are necessary to
energy by allowing electricity providers to manage loads, for example achieve the 2°C goal. The UNFCCC Secretariat has estimated that
through the use of internet-based intelligent infrastructure that works 86 per cent of the funding required for investments in developing
with a ‘smart grid’ to switch off air conditioning equipment during peak
countries will come from the private sector (UNFCCC 2007).
demand periods. In the United States, buildings use 40 per cent of all
primary energy supplied (and more than 70 per cent of all electricity Companies are willing to consider this type of investment if
generated), predominantly for heating, cooling and lighting (Gershenfeld it makes strategic business sense in the long term and offers
and others 2010). adequate risk-adjusted financial returns (WBCSD 2010). A
recent analysis of major international companies supports this
EVENTS AND DEVELOPMENTS 5Belarus
Croatia 5 10
Iceland Norway 5 5
15 30 30 40 Russian Federation
Canada 15 25
- 17 European Union
20 30 Ukraine
20 20 Kazakhastan
Switzerland 15 15
United States 20 30 Japan
- 17 Moldova China - 25
25 25 40-45 40-45
Israel Republic of Korea
Mexico 20 20 India 30 30
- 30 20-25 20-25
Annex I country Indonesia
Brazil 26 41
Non-Annex I country 36-39 36-39
Countries without reported
emission pledges
Australia
Unconditional pledge - percentage 5 25
reduction in emissions by 2020 without South Africa
conditions attached - 34
New Zealand
Conditional pledge - percentage
10 20
reduction in emissions by 2020
contigent on other actions and support
Figure 2: More than 22 Annex I and Non-Annex I countries (industrialized and developing countries, respectively), together with the European Union, have
pledged to reduce their greenhouse gas (GHG) emissions, in CO2 equivalent, by 2020. The map shows the status as of 31 December 2010. Not shown
are Costa Rica (which expects to become carbon neutral by 2021) and Papua New Guinea (which plans to decrease its GHG emissions by at least
50 per cent before 2030 and become carbon neutral before 2050). Source: UNEP (2010b)
assessment, showing that companies that lead in climate-related Protocol has already prevented 135 Gt of CO2 equivalent in
innovation also have higher economic performance. Innovation greenhouse gas emissions over the past two decades (Velders et
and development of new technologies, marketing strategies and al. 2007). However, hydrochlorofluorocarbons (HCFCs) and their
partnerships position these companies to seize opportunities replacement hydrofluorocarbons (HFCs) are both greenhouse
and achieve sustained growth in a carbon-constrained future gases and the ultimate significance of the climate benefits will
business environment (Maplecroft 2010a). depend on which replacement technologies are adopted by
The scientific focus has recently been shifting towards countries. Further phase down of HFCs, accelerated phasing out
measures to avoid dangerous warming by reducing emissions of HCFCs, and the recovery and destruction of ozone depleting
other than those of carbon dioxide. Reduced emissions of air substances in waste products are additional regulatory strategies
pollutants such as black carbon, tropospheric ozone and ozone that could be implemented in the near term (Molina et al.
precursors, including methane, not only help to mitigate climate 2010). Recent work by scientists and other experts are drawing
change, but also benefit human health by improving air quality attention to climate change mitigation opportunities emerging
(Box 2). As most substances that deplete the stratospheric ozone from reducing non-carbon dioxide greenhouse gases, such as
layer are also greenhouse gases, regulation under the Montreal black carbon and tropospheric ozone.
6 UNEP YEAR BOOK 20114
Box 2: Reducing black carbon and tropospheric ozone
Limiting climate change and improving air quality are two of the most
pressing environmental challenges. They are also closely linked. There is
Aerosols are collections of airborne solid or liquid particles
a broad consensus that action is required to address near-term climate
(other than pure water) that reside in the atmosphere for at
change in the first half of this century, as well as to protect the climate
least several hours. They may be natural or anthropogenic in
in the long-term. Efforts to reduce CO2 emissions in order to protect the
origin.
long-term climate need to start now, even though they will not significantly
Black carbon refers to black carbon-containing aerosols affect near-term climate change. However, these efforts will be most
formed through incomplete combustion of fossil fuels, effective if emissions of the 'short-lived climate forcers' (SLCFs) are reduced,
biofuels and biomass. Primary sources include emissions from especially those of black carbon, tropospheric ozone, and the tropospheric
diesel engines, cooking stoves and forest fires. Although black ozone precursors methane (CH4) and carbon monoxide (CO). Since these
carbon remains in the atmosphere for only days to weeks, it substances are also harmful air pollutants, air quality measures that address
has recently emerged as an important contributor to climate them might have climate co-benefits.
change. Scientific evidence and new analyses, including a new assessment by UNEP
and the World Meteorological Organization (WMO) (UNEP/WMO 2011),
Methane (CH4) is a greenhouse gas more than 25 times as
show that controlling black carbon and tropospheric ozone emissions
effective in trapping heat in the atmosphere as carbon dioxide
through the rapid implementation of proven emission reduction measures
(CO2) over a 100-year period. It is emitted from both natural
would have immediate and multiple benefits for human well-being. In
and human-influenced sources. The latter include landfills,
addition to limiting climate change, reducing SLCF emissions can directly
natural gas and petroleum systems, agricultural activities,
improve human health, food production and the provision of ecosystem
coal mining, wastewater treatment and certain industrial services.
processes. Methane is also a tropospheric ozone precursor.
Black carbon and tropospheric ozone are two substances that have
Ozone (O3) is a gaseous atmospheric constituent. In the contributed considerably to warming and regional climate disruption, as
troposphere, the lowest part of the atmosphere (within well as directly damaging health and crops. However, these substances
8-15 km of the Earth’s surface) where clouds and weather have not been given priority during the climate change negotiations.
phenomena occur, ozone is created by photochemical One of the key properties of black carbon and tropospheric ozone, as
reactions involving gases that result from both natural and well as of methane (an important greenhouse gas that is also an ozone
human activities. In high concentrations, tropospheric ozone precursor), is that they have short lifetimes in the atmosphere. The
can be harmful to a wide range of living organisms. It also benefits of reducing their concentrations can therefore be achieved in
acts as a greenhouse gas. Ozone in the stratosphere protects the near term for both climate and air quality-related impacts.
against ultraviolet (UV) radiation. The above mentioned UNEP/WMO assessment provides an overview of
Ozone precursors are chemical compounds which, in the state of science on these two substances. It has also undertaken new
the presence of solar radiation, react with other chemical analyses to evaluate the benefits of a set of measures identified in the
compounds to form ozone in the troposphere. assessment that make use of existing technology. These measures focus
on reducing black carbon and ozone precursor emissions (Table 1). In
Particulate matter consists of very small pieces of solid or evaluating the benefits of their implementation, it is important to take into
liquid matter such as particles of soot (black carbon), dust, account their effects on all emissions. The measures in the assessment were
fumes, mists or aerosols. identified as those providing ‘win-win’ benefits for climate as well as for
health and crop yields. The assessment finds that if the measures listed in
Radiative forcing is a measure of how the energy balance of
Table 1 were fully implemented globally, they would substantially mitigate
the Earth-atmosphere system with space is influenced when
near-term global warming, increase world food production, and reduce
factors that affect the climate are altered. The influence of a
premature mortality due to outdoor air pollution.
factor that can cause climate change, such as a greenhouse
gas, is often evaluated in terms of its radiative forcing. The In combination with CO2 control measures aimed at stabilizing
word ‘radiative’ arises because these factors change the atmospheric greenhouse gas concentrations at 450 parts per million (ppm)
balance between incoming solar radiation and outgoing CO2 equivalent, these measures substantially reduce the risk that warming
infrared radiation within the Earth’s atmosphere. This radiative will exceed the 2°C goal agreed at COP 16 in Cancún (Figure 3). Keeping
balance controls the Earth’s surface temperature. below the 2°C level of warming is extremely unlikely without near-term
measures to control emissions of both short-lived pollutants and long-lived
Source: Adapted from IPCC (2007) and US EPA (2011) greenhouse gases, primarily CO2. Even with all these emission control
EVENTS AND DEVELOPMENTS 7Table 1: Identified measures with the potential to significantly reduce near-
term climate change and improve air quality
3
Reference
Measure Sector
Temperature (˚C) relative to 1890-1910
CO2 measures
BC measures (affecting black carbon and other co-emitted compounds)
Diesel particle filters for road and off-road vehicles Transport 2
CH4 and BC Measures
Elimination of high-emitting vehicles in road and off-road transport
Replacing coal by coal briquettes in cooking and heating stoves Residential
Pellet stoves and boilers, using fuel made from recycled wood waste or
1 CO2, CH4 and
sawdust, to replace current wood-burning technologies in the residential BC Measures
sector in industrialized countries
Introduction of clean-burning biomass stoves for cooking and heating in
developing countries
0
Substitution of clean-burning cooking stoves using modern fuels for traditional
biomass cooking stoves in developing countries
Replacing traditional brick kilns with vertical shaft kilns and with Hoffman Industry 1900 1950 2000 2050
kilns
Replacing traditional coke ovens with modern recovery ovens, including the Figure 3: Observed temperatures through 2009 and projected temperatures
improvement of end-of-pipe abatement measures in developing countries thereafter under various scenarios, all relative to the 1890-1910 mean.
Ban of open burning of agricultural waste Agriculture Light and dark green backgrounds indicate zones where projected
temperatures are greater than 1.5°C and 2°C, respectively.
CH4 measures
Notes: Actual mean temperature observations through 2009, and projected
Extended pre-mine degasification and recovery and oxidation of CH4 from Extraction and transport of fossil
under various scenarios thereafter, are shown relative to the 1890-1910
ventilation air from coal mines fuel
mean temperature. Estimated ranges for 2070 are shown in the bars on
Extended recovery and utilization, rather than venting, of associated gas and the right. A portion of the uncertainty is common to all scenarios, so that
improved control of unintended fugitive emissions from the production of oil
overlapping ranges do not mean there is no difference. For example,
and natural gas
if climate sensitivity is large, it is large regardless of the scenario; so
Reduced gas leakage from long-distance transmission pipelines temperatures in all scenarios would be towards the high end of their ranges.
Separation and treatment of biodegradable municipal waste through Waste management Source: UNEP/WMO (2011)
recycling, composting and anaerobic digestion as well as landfill gas collection
with combustion/utilization
Upgrading primary wastewater treatment to secondary/tertiary treatment
with gas recovery and overflow control in the lower atmosphere also have other major regional climate impacts. For
Control of CH4 emissions from livestock, mainly through farm-scale anaerobic Agriculture example, they disturb tropical rainfall and regional circulation patterns, such
digestion of manure from cattle and pigs as the Asian monsoon, affecting the livelihoods of millions of people.
Intermittent aeration of continuously flooded rice paddies Full implementation of the identified measures could avoid 2.4 million
Source: UNEP/WMO (2011) premature deaths (within a range of 0.7-4.6 million) and the loss of
52 million tonnes, or 1-4 per cent, of global production of maize, rice,
soybean and wheat each year (within a range of 30-140 million tonnes)
(Figure 4). The greatest benefits will be felt immediately in or near the
measures in place, global mean temperatures would still have a substantial regions where actions are taken to reduce emissions, with the greatest
chance of exceeding 2°C towards the end of the century. Thus, further health and crop benefits expected in Asia. Over 80 per cent of the reduction
emission reductions could be required if that target, or a more stringent in mortality due to implementing all the measures will benefit people on
one of 1.5°C, are not to be exceeded. that continent.
Warming experienced in different regions varies. Black carbon and The benefits of avoided crop yield loss can be attributed equally to
tropospheric ozone have made larger contributions to the warming of measures to reduce methane emissions and measures to reduce those
Arctic surface temperatures since 1890 than they have to the global average. of black carbon. This is because implementing measures to reduce black
The identified measures could reduce Arctic warming by about 0.7°C (with carbon results in a reduction of ozone precursor emissions that are
a range of 0.2-1.3°C) in 2040. This is nearly two-thirds of the estimated 1.1°C co-emitted with black carbon. The identified measures in Table 1 are all
warming (with a range of 0.7-1.7°C) projected for the Arctic under the currently in use in different regions around the world to achieve a variety
assessment’s reference scenario and should substantially decrease the risk of environment and development objectives. Much wider and more rapid
of global impacts from changes in this sensitive region, such as sea ice loss implementation is required, however, to realize the full benefits identified
(which affects global albedo) and permafrost melt. Black carbon and ozone in the UNEP/WMO assessment.
8 UNEP YEAR BOOK 2011Climate change Human health Food security
CH4 CH4 and BC CH4 CH4 and BC CH4 CH4 and BC
measures measures measures measures measures measures
0 0 0
0.5
0.1
25
1
0.2 1.5
50
Figure 4: Global impacts of identified emission control
2
0.3 measures focusing on methane (CH4) and black carbon
2.5 75
(BC), calculated by taking the average result from running
0.4
two global climate-composition models, GISS and
3 ECHAM. Benefits are shown with increasing values moving
100 downward, to emphasize that these are reductions in
0.5 3.5
damages.
4 Notes: The lines on each bar show the range of estimates.
125
0.6
4.5
They include: for climate change, the range of uncertainty
in radiative forcing and climate sensitivity; for human
0.7 5 150 health, uncertainty in concentration-response relationships
Global mean Annually avoided Annually avoided
(for PM2.5 and ozone) and in the use of results from different
avoided premature crop yield losses models; and for food security, the range of impacts
warming in 2050 deaths (total maize, calculated using ozone changes from different models and
(˚C) (millions) rice, soybean uncertainty in exposure-response relationship. Avoided crop
and wheat, yield losses are summed values for the impact of reduced
million tonnes) ozone concentrations on wheat, rice, soybean and maize.
Source: UNEP/WMO (2011)
5
Emerging connections between air pollution and human health
Air pollution has long been known to have widespread effects emerging evidence that it may also affect other body systems and
on human health. Poor air quality is associated with increased is a potential contributor to the increase in autoimmune diseases
morbidity and mortality. While it is well established that exposure such as type 1 diabetes, multiple sclerosis and rheumatoid arthritis
to atmospheric pollutants can damage the lungs, there is (Ritz 2010) (Figure 5).
Autoimmune diseases are commonly characterized as a Nitrogen dioxide (NO2) is emitted by motor vehicles,
group of disorders that target tissues and organs, causing the industrial activities, nitrogen fertilizers, fuel and biomass
immune system to be inappropriately activated and to produce combustion, and aerobic decomposition of organic matter in
destructive responses against self-antigens (that is, constituents soils and oceans.
of the body’s own tissues capable of stimulating autoimmunity).
WHO AQG: annual mean concentrations below 40 μg/m3.
Particulate matter consists of suspended particulates, the
Sulphur dioxide (SO2 ) is an air pollutant produced when
smaller of which are capable of penetrating deep into the
fossil fuels containing sulphur are burned. SO2 and NO2
respiratory tract and causing significant health damage.
emissions lead to deposition of acid rain and other acidic
Particulates and SO2 can be emitted from coal-fired power
compounds over long distances, which in turn can lead to
plants without effective emission controls, steel mills, industrial
leaching of trace minerals and nutrients critical to trees and
boilers, domestic heating and fossil fuel combustion.
plants.
WHO Air Quality Guideline (AQG): annual mean concentrations
WHO AQG: daily mean concentrations of 20 μg/m3.
of no more than 20 μg/m3 for PM10 and 10 μg/m3 for PM2.5.
EVENTS AND DEVELOPMENTS 9Toronto Montréal
20 17 43 17 10 42
New York
20 26 79
Los Angeles
32 9 74
Havana
Mexico City 20 1 5
48 74 130
Caracas
16 33 57
Quito Bogotá
30 22 30
Rio de Janeiro
29 129
São Paulo
34 43 83
Córdoba
Santiago 55 97
54 29 81
Urban air pollution:
Particulate matter PM10 (µg/m3)
Nitrogen dioxide (µg/m3)
Sulphur dioxide (µg/m3)
Global air pollution: fine particulate matter PM2.5 (µg/m3)
0 5 10
Figure 5: Global and urban airpollution. Source: Adapted from van Donkelaar et al. (2010) and World Bank (2010)
The global map shows concentrations of fine particulate They exceed 35 micrograms per cubic metre (µg/m3) for 40-50
matter 2.5 micrometers or less in diameter (PM2.5 ). It was created per cent of the population in that region. Concentrations at this
by combining aerosol measurements from satellite observations level and higher are associated with an increased risk of mortality
between 2001 and 2006 with information about the vertical of approximately 15 per cent, according to WHO’s air quality
distribution of aerosols from a computer model. Particularly guidelines (WHO 2006, van Donkelaar et al. 2010).
high PM2.5 concentrations are shown in central and eastern Asia.
10 UNEP YEAR BOOK 2011Moscow
19 109
London Berlin
19 25 77 21 18 26
Paris
11 14 57
Rome Istanbul
Madrid 29 46 120 Ankara Beijing Seoul
29 24 66 39 55 46 90 90 122 37 44 60
Athens Tehran Tokyo
38 34 64 50 209 Taiyuan
89 211 55 Shanghai 38 18 68
Cairo Delhi 74 53 73 Osaka-Kobe
149 69 136 24 41 33 19 63
Kolkata Guangzhou
116 49 34 64 57 136
Mumbai
57 33 39 Manila
Bangkok
76 11 23 28 33
Accra
33 Kuala Lumpur
23 24 Singapore
Nairobi 41 20 30
40
Jakarta
84
Johannesburg
26 19 31
Sydney
Cape Town 19 28 81
13 21 72 Auckland
Melbourne
12 30 13 3 20
15 20 50 80 110
Source: van Donkelaar et al. (2010), World Bank (2010)
Air pollution estimates can also represent resident’s average on particulate matter are often estimated as average annual
annual level of exposure to additional pollutants such as outdoor concentrations in residential areas, away from air pollution
particulate matter less than 10 micrometers in diameter (PM10), ‘hotspots’ such as industrial districts and transport corridors. The
sulphur dioxide (SO2) and nitrogen dioxide (NO2). The urban SO2 and NO2 concentration data are based on average observed
pollutant concentrations shown in the map are sensitive to concentrations at urban monitoring sites (World Bank 2010).
local conditions and can differ within the same urban area. Data
EVENTS AND DEVELOPMENTS 116
Warming lakes inland waters and 10 per cent of coastal and marine areas by 2020.
Water in many of the world’s largest lakes is warming as a result of Currently, 13 per cent of land and less than 1 per cent of oceans
climate change (Figure 6). This is the outcome of a 25-year survey are protected for conservation. The meeting also agreed on the
of the surface water temperatures of 167 of the largest lakes Nagoya Protocol on access to and sharing of benefits from the
using satellite data (Schneider and Hook 2010). In each decade use of the planet’s genetic resources. This international protocol
temperatures have increased by 0.45°C on average. In some lakes provides a framework for access to genetic resources based on
they rose by 1°C. Although this may seem a modest upward trend, prior informed consent and mutually agreed terms, with fair and
even small increases in temperature can have dramatic effects equitable sharing of benefits and in consideration of traditional
on water quality and ecosystems in lakes. For example, they can knowledge. The protocol is expected to enter into force by 2012
induce algal blooms, enhance the risk that invasive species will (CBD 2010).
become established, or cause shifts in plant and fish populations. Monitoring data confirm that biodiversity is more than ever
Since much aquatic life is confined within the boundaries of under threat. According to a recent report, over 22 per cent of the
lakes, options to migrate to other, cooler habitats are limited. world’s plants are at risk of extinction, in large part due to loss of
Further warming could therefore result in rapid biodiversity loss habitats through conversion of natural areas for agricultural use,
in freshwater ecosystems. including food and biofuel production. Regions where plants are
Most scientists have used air temperature mainly to monitor under the greatest threat include South East Asia, Brazil (Mata
climate change. Monitoring warming trends in lakes may be a new Atlântica), Australasia, Madagascar and Europe (IUCN 2010).
way to assess the impacts of global climate change on Earth. A survey by the Global Environment Facility (GEF) shows that
biodiversity conservation is one of countries’ key environmental
concerns. It also identifies lack of comprehensive and adequate
environmental policies and weak legislative and regulatory
instruments as reasons for limited improvement in environmental
management (GEF 2010) (Figure 7).
New policy responses to the need for biodiversity conservation
aim to make biodiversity values increasingly visible, thus
encouraging more efficient use as well as conservation. Society’s
willingness to pay to conserve particular species or landscapes, for
example for food or wood production, have traditionally informed
economic valuations of nature. Intangible values, which are often
July, August, September trend (p0.05) circumstances and social, economic and cultural contexts.
January, February, March trend (p0.05)
and other stakeholders will regard ecosystem conservation and
Figure 6: Worldwide trends in nighttime lake surface temperature derived
7
restoration as a viable investment option that can support a range
from satellite data. Source: Schneider and Hook (2010)
of policy goals including food security, urban development, water
purification and wastewater treatment, regional development,
Biodiversity under threat—time to act and climate change mitigation and adaptation (TEEB 2010).
2010 was the International Year of Biodiversity. A significant Brazil, India and Japan are three countries that are taking steps
intergovernmental agreement was reached in Nagoya, Japan, in to incorporate an ecosystem service approach which can identify
October at the Conference of the Parties to the Convention on both the benefits and costs of conserving or restoring nature.
Biological Diversity (COP 10), when governments agreed to renew India has already announced plans to develop and implement a
their pledge to reduce the global rate of biodiversity loss. The new framework for green national accounts by 2015.
ten-year Strategic Plan, which replaces the previous, unachieved Engaging citizens in biodiversity programmes can foster
target of halting biodiversity loss by 2010, will guide international awareness and enhance the policy process. With 2 billion people
and national efforts. Among its targets is at least halving and, online and 90 per cent of the world population using mobile
where feasible, bringing close to zero the rate of loss of natural phones (ITU 2010), new opportunities to participate in biodiversity
habitats, including forests, and protecting 17 per cent of land and conservation efforts are arising.
12 UNEP YEAR BOOK 2011You can also read


