JRC TECHNICAL REPORT Droughts in Europe and Worldwide 2019-2020
←
→
Page content transcription
If your browser does not render page correctly, please read the page content below
JRC TECHNICAL REPORT

Droughts in Europe and Worldwide
2019-2020
           Barbosa P., Masante D., Arias Muñoz C., Cammalleri C., De Jager, A., Magni
           D., Mazzeschi M., McCormick N., Naumann G., Spinoni, J., Vogt, J

                                                                            EUR 30719 EN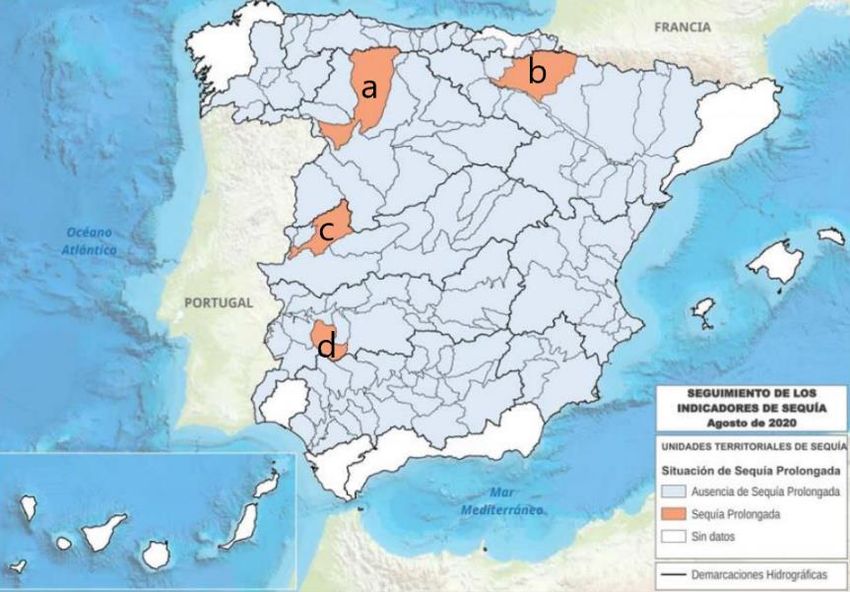
This publication is a Technical report by the Joint Research Centre (JRC), the European Commission’s science and knowledge service. It
aims to provide evidence-based scientific support to the European policymaking process. The scientific output expressed does not imply a
policy position of the European Commission. Neither the European Commission nor any person acting on behalf of the Commission is
responsible for the use that might be made of this publication. For information on the methodology and quality underlying the data used
in this publication for which the source is neither Eurostat nor other Commission services, users should contact the referenced source. The
designations employed and the presentation of material on the maps do not imply the expression of any opinion whatsoever on the part
of the European Union concerning the legal status of any country, territory, city or area or of its authorities, or concerning the delimitation
of its frontiers or boundaries.

Contact information
Name: Paulo Barbosa
Address: Via Fermi 2749, 21027, Ispra (VA) Italy
Email: paulo.barbosa@ec.europa.eu

EU Science Hub
https://ec.europa.eu/jrc

JRC125320
EUR 30719 EN

 PDF           ISBN 978-92-76-38040-5                ISSN 1831-9424             doi:10.2760/415204

Luxembourg: Publications Office of the European Union, 2021

© European Union, 2021

The reuse policy of the European Commission is implemented by the Commission Decision 2011/833/EU of 12 December 2011 on the
reuse of Commission documents (OJ L 330, 14.12.2011, p. 39). Except otherwise noted, the reuse of this document is authorised under
the Creative Commons Attribution 4.0 International (CC BY 4.0) licence (https://creativecommons.org/licenses/by/4.0/). This means that
reuse is allowed provided appropriate credit is given and any changes are indicated. For any use or reproduction of photos or other
material that is not owned by the EU, permission must be sought directly from the copyright holders.

All content © European Union, 2021, except: cover page, WorldMap image: © ALF photo - stock.adobe.com and Drought Image: © r_tee -
stock.adobe.com

How to cite this report: Barbosa P., Masante D., Arias Muñoz C., Cammalleri C., De Jager, A., Magni D., Mazzeschi M., McCormick N.,
Naumann G., Spinoni, J., Vogt, J, Droughts in Europe and Worldwide 2019-2020, EUR 30719 EN, Publications Office of the European
Union, Luxembourg, 2021, ISBN 978-92-76-38040-5, doi:10.2760/415204 , JRC125320.
Acknowledgements .......................................................................................................................................................................................................................................... 1
Abstract ....................................................................................................................................................................................................................................................................... 2
Executive summary .......................................................................................................................................................................................................................................... 3
1 Main drought events worldwide October 2019 – September 2020 ........................................................................................................ 5
1.1 The CEMS Drought Observatories ............................................................................................................................................................................... 6
1.1.1 Europe and Mediterranean............................................................................................................................................................................... 6
1.1.2 Sub-Saharan Africa ................................................................................................................................................................................................. 7
1.1.3 South America .............................................................................................................................................................................................................. 8
1.1.4 North and Central America and Caribbean ....................................................................................................................................... 9
1.1.5 Central and Eastern Asia.................................................................................................................................................................................10
1.1.6 Southern and Southeast Asia .....................................................................................................................................................................10
1.1.7 Oceania ............................................................................................................................................................................................................................12
1.2 Droughts on the Global Disaster Alerting Coordination System (GDACS) .........................................................................13
2 Analysis of main drivers of drought events in 2019/2020 ...........................................................................................................................16
2.1 Anomalies of precipitation...............................................................................................................................................................................................16
2.2 El Niño Southern Oscillation (ENSO) ......................................................................................................................................................................19
2.3 Soil moisture .................................................................................................................................................................................................................................20
2.4 Groundwater .................................................................................................................................................................................................................................21
2.5 Hydrological highs and lows ..........................................................................................................................................................................................22
2.6 Temperatures ...............................................................................................................................................................................................................................23
3 European and Global Drought Observatories .............................................................................................................................................................25
3.1 Global database of meteorological drought events: updates to 2019 and 2020 .....................................................26
3.2 A new system to compare meteorological droughts with historical events ....................................................................28
4 Drought case studies by partners in Europe and South America ............................................................................................................30
4.1 The Complex Agricultural Risk Management System (Hungary) .................................................................................................30
4.2 Drought in mainland Portugal during the hydrological year 2019/20 ..................................................................................32
4.3 Meteorological drought indexes for State managed Spanish basins .....................................................................................34
4.3.1 Duero..................................................................................................................................................................................................................................36
4.3.2 Guadiana ........................................................................................................................................................................................................................36
4.3.3 Tajo ......................................................................................................................................................................................................................................36
4.3.4 Ebro .....................................................................................................................................................................................................................................36
4.4 Hydrogeological drought forecasting in France ..........................................................................................................................................36
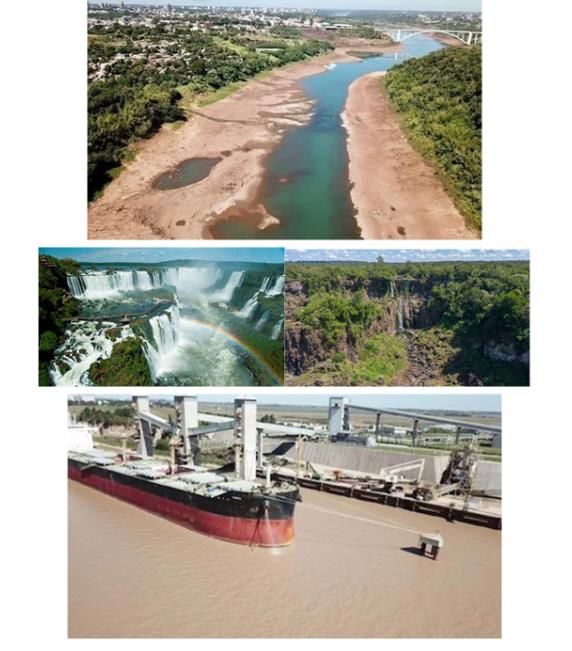
4.5 Río de La Plata Basin and Waterway Transportation ............................................................................................................................38
4.6 Drought patterns across western South America in 2020 ...............................................................................................................42
4.6.1 Chile ....................................................................................................................................................................................................................................42
4.6.2 Bolivia ................................................................................................................................................................................................................................42
4.6.3 Peru .....................................................................................................................................................................................................................................43
4.6.4 Colombia.........................................................................................................................................................................................................................43
4.6.5 Ecuador ............................................................................................................................................................................................................................43
i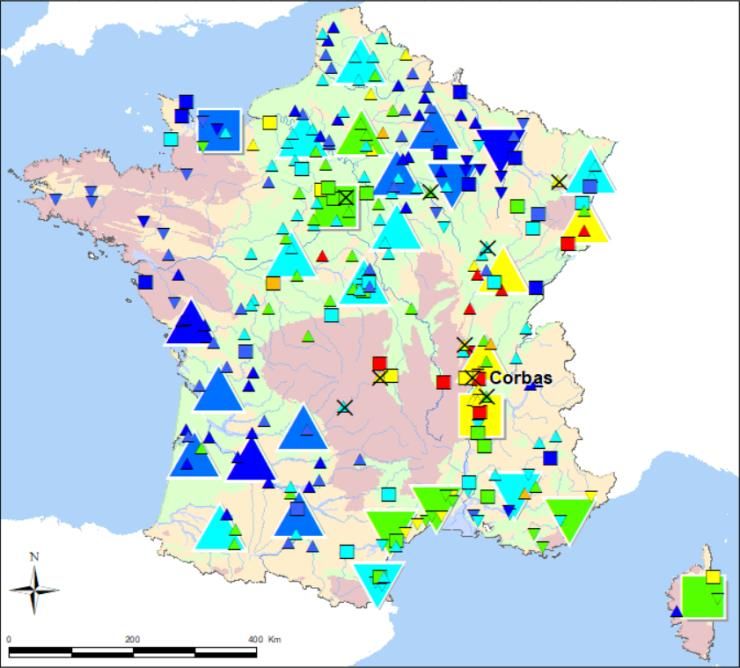
References .............................................................................................................................................................................................................................................................44
List of abbreviations and definitions ...........................................................................................................................................................................................45
List of figures .....................................................................................................................................................................................................................................................46
List of tables ........................................................................................................................................................................................................................................................48
Annex 1. IPCC Macro regions ...............................................................................................................................................................................................................49

ii
Acknowledgements
This report is made with the contribution of several colleagues in the field of drought monitoring around the
world. In particularly we want to thank: B. Violaine, G. P. Podestá, J. L. Fraile, M. Lakatos, P. Maquilón, and V.
Cabrinha Pires.

1
Abstract
This report summarizes a year of drought events through the monitoring and forecasting activity of European
(EDO) and Global (GDO) Drought Observatories, as part of the Copernicus Emergency Management Service
(CEMS). The period of interest spans from October 2019 to September 2020, during which several drought
events of relevance and other minor events or intense dry spells were observed.

2
Executive summary
This report summarizes a year of drought events through the monitoring and forecasting activity of European
(EDO) and Global (GDO) Drought Observatories, as part of the Copernicus Emergency Management Service
(CEMS). The period of interest spans from October 2019 to September 2020, during which several drought
events of relevance and other minor events or intense dry spells were observed.
For the third consecutive year, unexpectedly dry conditions affected most of Europe. Central and north-
western European countries faced a robust dry spell during April and May (Germany, Belgium, the
Netherlands, Ireland and most of the UK, the latter two recovered by August). Earlier in the spring, drier than
usual conditions were observed across central and eastern Europe as well (Austria, Croatia, Slovenia, Hungary,
Serbia, Bosnia), but mostly recovered by mid-July. However, increasing soil moisture deficits appeared around
the western Black Sea coast since. July was much drier than usual in France, Belgium and southern Germany.
Since August, central Scandinavia and Iceland showed dry conditions too. Impacts were mild overall, with
slightly reduced crop yields in central and eastern Europe, while several local authorities ordered preventive
measures. River flows were lower than normal at different times in several water basins (e.g., lower Danube,
Warta and tributaries of Elbe, Seine and Meuse). Water supply issues were reported for both consumption and
industrial cooling In France. Groundwater levels remained lower than normal across most of the continent for
the whole summer 2020.
On the southern Mediterranean coast, Algeria and Morocco experienced drought during late 2019 and early
2020. Across southern Africa, coming from long-lasting dry conditions, a suboptimal start of the rainy season
2019/20 made the situation critical over wide areas of Namibia, Angola, Zimbabwe, Zambia, South Africa,
Lesotho, and southern Mozambique. Food insecurity spread mainly when drought was combined with other
events, such as floods and economic downturns (Zimbabwe, Mozambique). Northern Mozambique,
surroundings of Lake Malawi and western Madagascar were also affected later, in mid-2020, with half a
million people facing food insecurity in Madagascar as of July 2020.
On the other side of the Atlantic, the United States of America experienced intense drought over most of its
western half during 2020. Widespread drought conditions were also present in the northwest of Mexico since
at least July 2020. Crops were affected to the point that government intervention was deemed necessary.
During 2018 and 2019 a long-lasting drought unfolded across the “Dry corridor” of Central America, with
some improvement being observed from October 2019. Still, Honduras, El Salvador, Nicaragua, and
Guatemala experienced food insecurity and water supply issues. Further south, Chile faced one of its worst
drought crises in history. The very wide regions of Great Chaco, Pantanal and Paraná basin (northern
Argentina, Bolivia, Paraguay, Mato Grosso and Mato Grosso do Sul in Brazil) had intense dryness, with wide
ranging impacts on natural ecosystems (wildfires), agriculture, transportation and power generation. As of
autumn 2020 the drought persisted.
In September 2020, increasing drought conditions were present north of the Black Sea and Caucasus range
(Ukraine and southern Russia). The whole Caucasus area suffered strong precipitation and soil moisture
deficits since March 2020. Kazakhstan faced a few dry spells at different times and locations. In southern
Asia, Sri Lanka suffered of anomalous dryness from March to May. The drought over mainland Southeast Asia
continued through 2020, with multifold impacts and substantial support needed from governments. Java and
southern Sumatra (Indonesia) were affected in mid 2019 and a potential of 50 million people were exposed
towards the end of the year, including Jakarta, but due to abundant rainfall during 2020, severe impacts were
avoided. Eastern China and parts of the Korean peninsula went through drought between May 2019 and the
end of the year, long enough to cause crop losses and water supply issues.
Distribution of cumulative precipitation in the midterm highlights the regions with the most enduring rainfall
deficits: central Chile and neighbouring regions of Argentina, inner and southern states of Brazil, Paraguay,
spots of central America, central USA, Caucasus and southern Russia, continental south-east Asia, western
Australia, north of New Zealand. Groundwater deficits worsened in south-west USA, northern Mexico,
Colombia and most of Europe. Middle East, central Asia, mainland Southeast Asia and Australia retained
stable dry conditions as of August 2020.
The ENSO (El Niño), closely related to intense droughts in some regions of the world, was neutral from the
end of 2019 until mid-2020 and can’t be linked directly to any of the droughts of the period. Moreover, La
Niña conditions developed from July 2020. Concerning temperatures, the heat exacerbates or even drives
drought: above average temperatures were recorded almost everywhere in the world. Among others, western
Australia suffered temperature extremes under drought conditions.

3
4
1    Main drought events worldwide October 2019 – September 2020
In this chapter, a brief description of the main drought events between late 2019 and late 2020 is provided.
Information is derived from the periodical reports published on the Copernicus Emergency Management
Service (CEMS) European and Global Drought Observatories (EDO, GDO1), focusing each on a specific drought,
as well as from the monitoring activity performed for the Global Disaster Alert Coordination System (GDACS2).
We divide the chapter into broad geographical domains: North and Central America and Caribbean, South
America, Sub-Saharan Africa, Europe and Mediterranean, central Asia (including Middle East) and eastern Asia,
southern and Southeast Asia, Oceania. Within each domain, the significant drought events are mentioned
individually, with hints on drivers, severity and reported impacts.
Despite impacts represent perhaps the most important piece of information when reporting on natural
disasters, there are no near real-time sources of information for drought impacts at global scale.
Nevertheless, information is collected by GDO from governmental or other institutional sources when
available, or from media news otherwise, sourced from the European Media Monitor (EMM3).
Since the drought events presented were reported during the year as they unfolded through more specific
drought reports, this summary provides additional insight into their outcome as of September 2020. Several
droughts are ongoing at the time of writing, therefore the meteorological outlook into the following three
months is provided (October to December 2020), as elaborated by GDO based on ECMWF S5 ensemble
forecasts (Johnson et al., 2019) and displayed in . Events of 2019 or earlier are mentioned when they were
still relevant as of October 2019.
It is important to specify the operational definitions of drought that will be used through this report. Drought
is a recurrent feature of the climate that results from a shortfall in precipitation over an extended period, its
inadequate timing compared to the needs of the vegetation cover, or a negative water balance due to an
increased potential evapo-transpiration caused by high temperatures. These conditions may be exacerbated
by strong winds, atmospheric blocking patterns and antecedent conditions in soil moisture, reservoirs and
aquifers, for example. If this situation leads to an unusual and temporary deficit in water availability, it is
termed a drought. Droughts are to be distinguished from aridity, a permanent climatic feature, and from
water scarcity, a situation where the climatologically available water resources are insufficient to satisfy
long-term average water requirements.
The exact definition of a drought depends on several factors, such as the prevailing effects on the
hydrological system, the economic, environmental, or social sector analysed, and the related processes and
impacts. Droughts are commonly grouped into three basic types. A meteorological drought is generally
defined as a period with an abnormal precipitation deficit, in relation to the long-term average conditions for
a region. When a meteorological drought leads to a soil moisture deficit that limits water availability for
natural vegetation and crops, the result is a soil moisture or agricultural drought. A hydrological drought is
associated with the effects of periods of shortfalls of precipitation (including snowfall), on surface or sub-
surface water supply (i.e., streamflow, reservoir and lake levels, and groundwater). A fourth type of drought –
socioeconomic drought – is sometimes defined, when the demand for some economic goods and services
(e.g., water, animal fodder, food grains, fish, hydro-electric power) exceeds supply as a result of a weather-
related shortfall in water availability. Environmental drought (also known as ecological drought) is an episodic
deficit in water availability that drives ecosystems beyond thresholds of vulnerability, impacts ecosystem
services, and triggers feedbacks in natural and/or human systems (Crausbay et al. 2017). Drought has
noticeable effects on vegetation, air, soil, fauna; it increases forest fires danger and land degradation
processes, and may cause forest mortality, reduce primary production and alter biodiversity (Vicente-Serrano
et al. 2020).
Due to the different types of drought, its monitoring is based on the analysis of a series of drought indicators,
representing different components of the hydrological cycle (e.g., precipitation, soil moisture, reservoir levels,
river flow, groundwater levels) or impacts (e.g., vegetation water stress). Usually, indicators represent
statistical anomalies of the current situation with respect to the long-term climatology at a given location and
time interval. As such they are a measure of the probabilistic severity of a given event.

1
    https://edo.jrc.ec.europa.eu/europe/ and https://edo.jrc.ec.europa.eu/world
2
    https://www.gdacs.org/
3
    https://emm.newsbrief.eu/

5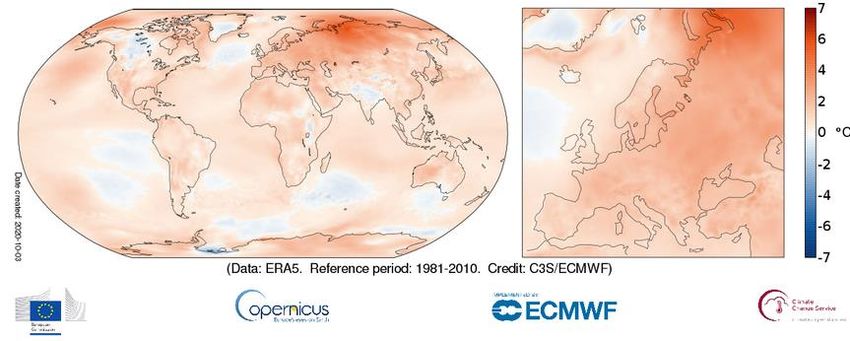
1.1 The CEMS Drought Observatories
1.1.1 Europe and Mediterranean
For the third consecutive year, unusual dry conditions affected central Europe (Figure 1). Some of the central
and north-western European regions faced a robust dry spell after poor rainfall during April and May 2020
(Germany, Belgium, the Netherlands, Ireland and most of the UK)4. Earlier in the spring, drier than usual
conditions were already observed across central and eastern Europe (Austria, Croatia, Slovenia, Hungary,
Serbia, Bosnia) and in Italy. July was again much drier than usual in France, Belgium and southern
Germany and soil moisture deficits persisted5. Since August, central Scandinavia and Iceland showed dry
conditions too. The levels of some of the major rivers were lower than normal, particularly the lower Danube,
Warta and tributaries of Elbe, which recovered later, and north-east France and surroundings (rivers Seine
and Meuse)6.
Ireland and the UK recovered from the dry spell by August, as well as southern Europe and the western
Balkans by mid-July. Significant improvements started in France at the end of September. In mid-summer,
increasing soil moisture deficits appeared and intensified around the western Black Sea coast and later
extended north of the Black Sea and Caucasus range (Ukraine and southern Russia). The whole Caucasus
area suffered strong precipitation and soil moisture deficits since March 2020, but there is severe lack of
information on impacts.
For the rest of Europe, at the end of June 2020 impacts were mild overall, with slightly reduced crop yields in
central and eastern Europe 7, while several local authorities ordered preventive measures8 9. Indeed,
exceptional precipitation during February in north-western Europe allowed reservoirs to fill at full capacity,
and more generally mitigated against the evolution towards a full-scale agricultural or hydrological drought
at the end of the spring. The recurring dryness in central Europe determined a reduction of crop yield
prospects10. Water supply issues were reported for both consumption and industrial cooling in France 11, and
forests were reported as under marked water stress12 13.
On the southern Mediterranean coast, Algeria and Morocco (including the Atlantic coast) experienced
drought during late 2019 and early 2020. The drought impacted small farmers, herders and cereal crops in
general14 15. Precipitation deficit mostly recovered before the summer of 2020, but groundwaters remained
strained and long-term issues of water supply loom over these regions.
4
JRC EDO Report - Drought in Europe, June 2020. https://edo.jrc.ec.europa.eu/documents/news/EDODroughtNews202006_Europe.pdf
5
JRC EDO Report - Drought in Europe, September 2020.
https://edo.jrc.ec.europa.eu/documents/news/EDODroughtNews202009_Europe.pdf
6
See section 4.4 for insights on the hydrological conditions in France.
7
JRC MARS Bulletin – Crop monitoring in Europe, Vol. 28 No. 6, 15 Jun. 2020, https://ec.europa.eu/jrc/sites/jrcsh/files/jrc-mars-
bulletin-vol28-no6.pdf
8
“Sécheresse : 78 départements concernés par les mesures de restriction d’eau”, 0uest-France, 18 Aug. 2020, https://www.ouest-
france.fr/meteo/secheresse/secheresse-78-departements-concernes-par-les-mesures-de-restriction-d-eau-6941136
9
Power J., “Six-week hosepipe ban to come into force from Tuesday”, The Irish Times, 8 Jun. 2020,
https://www.irishtimes.com/news/environment/six-week-hosepipe-ban-to-come-into-force-from-tuesday-1.4273066
10
https://ec.europa.eu/jrc/sites/jrcsh/files/jrc-mars-bulletin-vol28-no8.pdf
11
Woods M., “Drought provokes shutdown of nuclear reactors in northeast France”, RFI, 25 Aug. 2020,
https://www.rfi.fr/en/france/20200825-drought-provokes-shutdown-nuclear-reactors-northeast-france-belgium-ardennes-chooz-
meuse
12
Kramer H., “Das Potsdamer Katharinenholz leidet unter der Trockenheit”, Potsdamer Neueste Nachrichten, 15 Sep. 2020,
https://www.pnn.de/potsdam/folgen-des-klimawandels-das-potsdamer-katharinenholz-leidet-unter-der-trockenheit/26181892.html
13
“Sécheresse : "Des forêts commencent à mourir" en France, alerte une hydroclimatologue”, Franceinfo, 5 Sep. 2020,
https://www.francetvinfo.fr/meteo/secheresse/secheresse-des-forets-commencent-a-mourir-en-france-alerte-une-
hydroclimatologue_4095725.html
14
“Mauvaise campagne agricole à cause de la sécheresse au Maroc?”, AgriMaroc.ma, 10 Mar. 2020,
https://www.agrimaroc.ma/mauvaise-campagne-agricole-secheresse/
15
JRC MARS Bulletin – Crop monitoring in European Neighbourhood, 27 Apr. 2020 https://ec.europa.eu/jrc/sites/jrcsh/files/jrc-mars-
bulletin_north_africa-april_2020.pdf
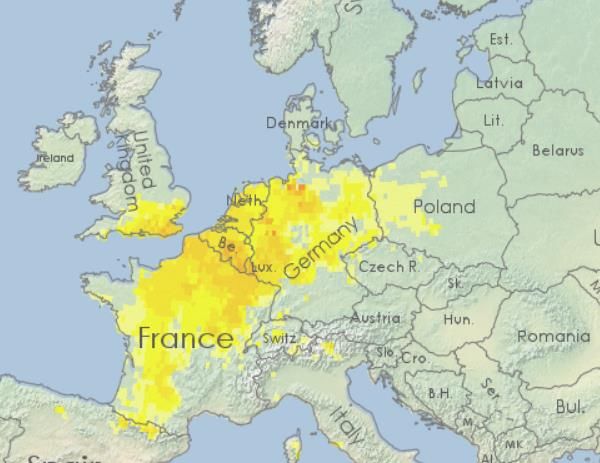
6Figure 1. Combined Drought Indicator for three selected ten-days intervals through 2020. From left to right: early May,
mid of June, early August.
Watch: rainfall deficit | Warning: soil moisture deficit | Alert: vegetation stress following rainfall / soil moisture
deficit | Partial recovery of vegetation | Full recovery of vegetation to normal conditions
Source: European Drought Observatory.
1.1.2 Sub-Saharan Africa
Nor Sahel neither the Horn of Africa suffered from droughts between the end of 2019 and 2020, despite
being very vulnerable to drought and constantly under food insecurity. Equatorial Africa had no drought
events of relevance either.
Conversely, large areas of southern Africa faced drought conditions at different stages (Figure 2). Dry
conditions were already present in 2018 and the rainy season of 2018/19 was poor, providing insufficient
water to buffer the long dry season ahead. Consequently, drought persisted or worsened almost everywhere
in the western half of southern Africa throughout 2019, as well as in Zimbabwe 16. Moreover, a suboptimal
start of the rainy season 2019/20 made the situation further difficult over wide areas of South Africa,
Lesotho, Namibia, Angola, Zimbabwe, Zambia and southern Mozambique. Indeed, as of January 2020,
some areas received only 20% of the total precipitation expected in the year, with many more at a mere 50%.
Food security concerns were widespread to most of countries involved, with some open crisis where drought
combined with other issues, such as floods and economic downturns (e.g., Zimbabwe, Mozambique). Crops
were affected and the 2020 harvest was under expectations in both Zimbabwe and Zambia, with consequent
price increase for staple food. Zimbabwe started consuming its limited grain reserve, while Zambia diverted
funds to mitigate impacts. Water supply was intermittent and unsafe. Major damages to the economy of the
involved countries were reported, also in relation to the low water level at the Kariba dam, threatening power
supply to both Zambia and Zimbabwe17. As of September 2020, neither of the meteorological and
humanitarian situations improved significantly, with the additional burden of COVID-19 pandemic.
The second half of the wet season (February-April 2020) brought less rainfall than average in northern
Mozambique, surroundings of Lake Malawi and western Madagascar. No major impacts were reported in
relation to this specific event up until May 2020, mostly thanks to the late onset of the drought in crops cycle.
However, mild to severe food insecurity affects endemically the countries involved, and severe natural
disasters are frequent in that part of Africa. Indeed, 2019 brought one historical cyclone (Idai) and a dry spell,
so even minor events may cause distress during a difficult recovery phase. Concerning southern Madagascar,
554,500 people were estimated to be severely food insecure in July 2020, with food assistance schemes fully
deployed18.
16
JRC GDO Report - Drought in southern Africa, December 2019.
https://edo.jrc.ec.europa.eu/documents/news/GDODroughtNews201912_Southern_Africa.pdf
17
JRC GDO Report - Drought in Zimbabwe, Zambia and south Mozambique, February 2020.
https://edo.jrc.ec.europa.eu/documents/news/GDODroughtNews202002_Zimbabwe_Zambia_Mozambique.pdf
18
"Madagascar humanitarian snapshot", OCHA, BNGRC, Humanitarian partners, Ministry of Health, WHO, CCO, CHS, GEGIS, IP, 30 Jun.
2020 https://reliefweb.int/report/madagascar/madagascar-humanitarian-snapshot-june-2020
7Figure 2. Risk of Drought Index for Agriculture for mid-January 2020 (left) and early June (right).
Source: Global Drought Observatory.
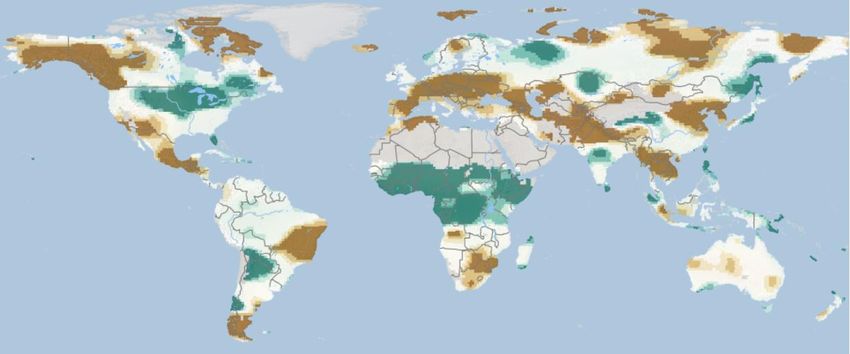
1.1.3 South America
During the interval October 2019 to September 2020, widespread precipitation deficits were recorded across
the continent (Figure 3).
The north of Colombia and Venezuela experienced drought conditions in early 2020. Severe water supply
issues were reported locally, as well as high fire hazard. Affected regions of Colombia mostly recovered
during the wet season of mid-2020, while conditions in Venezuela were uncertain. Northern coasts of Peru
suffered a dry spell between February and April 2020, which entailed low river flows and shrinking reservoirs,
but no widespread and severe consequences on crops19. Drought affected a wide cross boundary region
corresponding to central and northern Great Chaco (Paraguay, Bolivia, Argentina) and fringes of Pantanal
(Brazil, Bolivia), between the end of 2019 and mid-2020. Both 2019 and 2020 wettest seasons were well
below average. Dry conditions were recorded further east as well, between Paraguay and Paraná rivers,
whose levels decreased markedly. Hydrological drought extended downstream in the lower basin. In Brazil,
drought conditions spread further during 2020 across States of Mato Grosso, Mato Grosso do Sul and, during
the third quarter of 2020, the south-east of the Country (e.g. Paraná, São Paulo). Paraguay was drier than
usual all year around, despite the different rainfall pattern from east to west. Combined with high
temperatures and low rainfall in the upstream river basins (e.g. Pantanal), the Country faced a drought of rare
severity, which lasted for the whole of 2020. Like Paraguay, Argentina faced low river levels, in the north
east. In general, the northern half of the country underwent a deficit of precipitation since March 2020, and
temperatures were above average over the twelve-month period up to September 2020. Both conditions
favoured the widespread decrease of soil moisture, a key element of hazard for agriculture. Central Chile was
affected by one of its worst droughts on record between the end of 2019 and early 2020, following very little
precipitation during 2019. Dry conditions continued well into 2020 and extended southwards, with some relief
limited to June and July. More details on the drought patterns across western South America are provided in
section 4.6 of this report.
Impacts were different depending on location. Mainly livestock losses in the Great Chaco; transportations and
power supply issues concentrated east of Paraguay river and downstream; crops were hit in southern Brazil20.
Wider than usual fires affected both Great Chaco and Pantanal since the end of 2019, with great damage to
environment and ecosystems21 22. High fire hazard endured into the last quarter of 2020 for all of the regions
19
"Condiciones secas en costa y sierra norte del Perú (enero-agosto 2020)y perspectivas hasta el verano 2021", Servicio Nacional de
Meteorología e Hidrología del Perú -SENAMHI, 8 Sep. 2020, https://www.senamhi.gob.pe/load/file/02662SENA-6.pdf
20
"Monitoramento de Secas e Impactos no Brasil - Outubro 2020", Centro Nacional de Monitoramento e Alertas de Desastres Naturais
ligado (CEMADEN), 12 Nov. 2020, http://www.cemaden.gov.br/monitoramento-de-secas-e-impactos-no-brasil-outubro2020/
21
André Shalders, "Queimadas no Pantanal: multas do Ibama despencam apesar de recorde de incêndios", BBC News, 15 Sep. 2020,
https://www.bbc.com/portuguese/brasil-54159499
22
Agência Brasil, "Queimadas no Pantanal e estiagem causam preocupação no MT e MS", Diario de Pernambuco, 12 Sep. 2020,
https://www.diariodepernambuco.com.br/noticia/brasil/2020/09/queimadas-no-pantanal-e-estiagem-causam-preocupacao-no-mt-e-
ms.html
8and countries already affected. As of September 2020, the hydrological drought continued for both Paraguay
and Paraná rivers, hampering supply of goods into Paraguay, which is highly reliant on river transportation
for imports23. The Rosario Board of Trade (Argentina) estimated the aggregate value of all impacts related to
low flows and depths of the Paraguay-Paraná Waterway at about 244 million USD for the first four months
of 202024. Chilean agriculture and water supply were hit 25, including costs for mitigation and high fire hazard,
which persisted towards the end of 2020. The Country suffered already a multi-annual drought between
2010 and 2018 and hypothesis of a shift towards drier climate are brought forward (Garreaud et al., 2019).
Reservoir storage remained below average as of September26.
Figure 3. Risk of Drought Index for agriculture, for three selected ten-days intervals. From left to right: mid November
2019, late May 2020, end of September 2020.
Source: Global Drought Observatory.
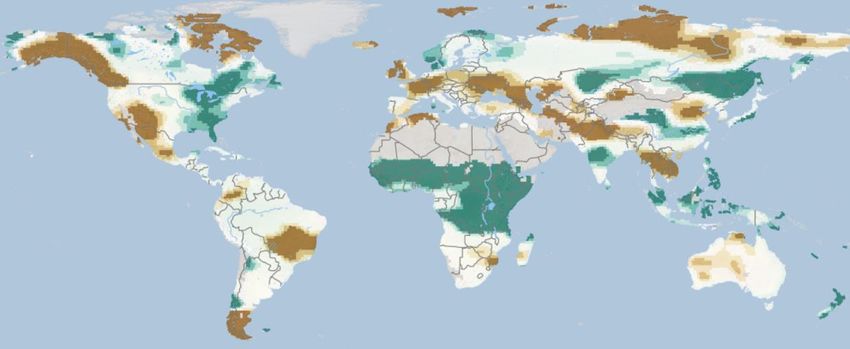
1.1.4 North and Central America and Caribbean
USA experienced intense drought over most of its western half during 2020 (especially Colorado, Wyoming,
Utah), with impacts to agriculture and rangelands, and high fire hazard. Poor precipitation affected North
Dakota (USA), southern Saskatchewan and eastern Quebec (Canada) as well. In both domains, wide deficits
were still present as of September 2020. Above-normal temperatures and limited moisture caused drought to
expand to the foothills of Canadian Alberta.
Widespread drought conditions were observed in the northwest of Mexico since at least July 2020 (Figure 4).
Crops were affected at a key stage of growth and feed for livestock were in jeopardy 27. The government
established mitigation measures accordingly. Earlier, the south-east of the country was hit by drought too
(e.g. Veracruz), as well as the rest of Central America. The poor precipitation during summer 2019, following
an already suboptimal beginning of the year, following the strong dry spell of mid-2018, determined
unfavourable conditions for agriculture and local water supply issues. Compared with the beginning of 2019,
later in October the drought eased or halted in the southernmost part of Central America (Costa Rica and
Panama), while intensified northwards, as far as central Mexico. There, it lasted for some more months before
regressing, past the drier months. Still, at the time food security was deemed at risk in the most vulnerable
23
Castedo A., "La histórica sequía del río Paraguay que tiene barcos sin poder navegar y amenaza a la economía del país", BBC News,
19 Oct. 2020, https://www.bbc.com/mundo/noticias-america-latina-54558777
24
see section 4.5 of this Technical Report for details.
25
Paúl F., "Megasequía en Chile: las catastróficas consecuencias de la mayor crisis del agua de los últimos 50 años”, BBC News, 11
Oct. 2019, https://www.bbc.com/mundo/noticias-america-latina-49825857
26
Chilean Water Authority (DGA), https://www.climatedatalibrary.cl/maproom/Monitoring/Hydrological/EmbalsesDGA.html
27
Esparza S. G., "En sequía el 79 % de los municipios de Chihuahua; piden declarar emergencia", Norte Digital, 29 Sep. 2020,
https://nortedigital.mx/en-sequia-el-79-de-los-municipios-de-chihuahua-piden-declarar-emergencia/
9countries of Central America28. Honduras, El Salvador, Nicaragua and Guatemala recovered slowly during
the rainy months of mid-2020.
Most Caribbean islands faced some dry spells during the first half of the year, partly in relation to longer-
term deficits (e.g. Dominican Republic, Haiti, eastern Cuba, Jamaica, Puerto Rico, eastern Antilles), but only
local or mild impacts were reported, primarily due to the short duration of spells. As of September, none of
the Caribbean islands were under drought conditions, following good rainfall in the third quarter of the 2020.
Figure 4. Risk of Drought Index for agriculture, mid October 2019 (left) and mid September 2020 (right).
Source: Global Drought Observatory.
1.1.5 Central and Eastern Asia
From the end of 2019 until September 2020 there were no major drought across Central Asia, and no
relevant impacts were recorded, due in part to the sparse population. Kazakhstan faced dry spells at
different times and locations, combined with high temperatures, mostly in the north and west. The
intermittent pattern of dryness did not allow for widespread impacts to unfold, apart from reduced yield
prospects for spring cereals29 and increased risk of wildfires. The lack of precipitation and anomalous heat in
parts of Siberia (Russia) did not yield relevant impacts on population either, but exposed forests to
widespread wildfires30.
The Middle East and eastwards countries (Iran, Afghanistan, Turkmenistan) did not experience drought during
the year, whereas the arid or semiarid climates may suggest otherwise.
Most of eastern Asia received above normal precipitation in the wettest period of the year and did not carry
significant deficit from the previous year. Eastern China and parts of the Korean Peninsula suffered drought,
starting from May 2019 and until the end of the year. The drought faded away in early 2020, but lasted long
enough to cause crop losses, water supply issues and low river flows31.
1.1.6 Southern and Southeast Asia
In 2020 the Indian monsoon was at or above average and India did not experience any significant droughts,
unlike the two previous years. Sri Lanka did suffer from a dry spell: starting from March 2020 about three to
five hundred thousand of people faced a water supply crisis, due to lack of precipitation and sea water
28
"IPC Acute Food Insecurity Analysis - Honduras, November 2019 – June 2020", IPC and Technical Unit for Food and Nutritional
Security Honduras (UTSAN), 1 Dec. 2020,
https://reliefweb.int/sites/reliefweb.int/files/resources/IPC_Honduras_AcuteFoodSec_2019Nov2020June_English.pdf
29
JRC MARS Bulletin – Crop monitoring European neighbourhood: Kazakhstan. Oct. 2020 https://ec.europa.eu/jrc/sites/jrcsh/files/jrc-
mars-bulletin_kazakhstan-october_2020.pdf
30
Patel K., “Another Intense Summer of Fires in Siberia”. Earth Observatory NASA, 6 Aug. 2020.
https://earthobservatory.nasa.gov/images/147083/another-intense-summer-of-fires-in-siberia
31
“Drought affects crops, drinking water in east China “. Xinhua, 01 Nov. 2019. http://www.xinhuanet.com/english/2019-
11/01/c_138521132.htm
10intrusion32. Despite the prolonged consequences of drought, the precipitation gap was filled from May
onwards.
Continental Southeast Asia suffered drought during 2020, up until October (Figure 5). Despite a wet climate,
underperforming precipitation since at least mid-2019 hampered the yearly water balance, both in terms of
precipitation per se and downstream river flows. In March 2020, most of the Mekong river basin and
neighbouring regions of the peninsula were experiencing relatively dry conditions, involving most of mainland
Thailand and parts of Cambodia, Laos and Vietnam. Impacts on crops and water supply were reported,
mostly in the lower Mekong basin and in relation to saline intrusion from the river delta. Tensions with upper-
Mekong countries increased on allegations of water mismanagement 33. At the time, reservoirs were lower
than average for the period, but generally not critically low. Substantial support was provided by local
governments. Later in the year, the drought extended north-west to Myanmar, after a poor start of the
monsoon 2020, and strong soil moisture deficit persisted, albeit with regional variations. The rivers within the
Mekong basin, and beyond, kept recording low levels for the period, and so did reservoirs. The main staple
crop under stress was rice. Fisheries, power production and water supply in general were at stake too 34, so the
Mekong River Commission advised all member countries to implement their drought plans in July 35.
Figure 5. Risk of Drought Index for agriculture, mid-January 2020.
Source: Global Drought Observatory.
Java and southern Sumatra (Indonesia) suffered from drought in mid-2019, lasting throughout the year.
Periodical fires were stronger than usual and water supply issues were reported 36 37. Potentially, 50 million
people were exposed to drought impacts, including Jakarta. Thanks to the abundant and unrelenting rainfall
that was recorded since January, the deficit was filled entirely during 2020.
After a having drought in 2019, the islands of Philippines experienced recurring dry spells at different
locations and time, with the most notable in Mindanao during early 2020, later faded. The seasonal rains of
2020 brought much less rain than expected in the northernmost areas of the Country, figuring under drought
threat in September 2020. Several locations across Philippines, like many other insular countries in the world,
suffer from recurrent water scarcity issues, even before accounting for drought, which may easily escalate
the existing water supply problems.
32
https://reliefweb.int/sites/reliefweb.int/files/resources/Drought_Situation_Report_on_2020__1588426512.pdf
33
Beech H., “China Limited the Mekong’s Flow. Other Countries Suffered a Drought.”. The New York Times, 13 Apr. 2020,
https://www.nytimes.com/2020/04/13/world/asia/china-mekong-drought.html
34
Osborne Z., “The great salt drought desiccating Vietnam’s Mekong Delta”, Al Jazeera, 22 Apr. 2020,
https://www.aljazeera.com/features/2020/4/22/the-great-salt-drought-desiccating-vietnams-mekong-delta
35
“Mekong countries urged to address low water flows”, Mekong River Commission, 7 Aug 2020, http://www.mrcmekong.org/news-
and-events/news/mekong-low-water-flows/
36
“Information bulletin – Indonesia: drought”, International Federation of Red Cross/Crescent (IFRC) and Palang Merah Indonesia, 17
Oct. 2019, https://www.ifrc.org/docs/Appeals/19/IBIDdr171019.pdf
37
“Indonesia emerges from devastating drought”, Climate Centre of IFRC, 24 Oct. 2019,
https://www.climatecentre.org/news/1211/indonesia-emerges-from-devastating-drought
111.1.7 Oceania
The main droughts from October 2019 were observed in south-east and south-west of Australia and in the
northern half of New Zealand (Figure 6). Tasmania suffered a dry spell too, towards the end of 2019.
The southern half of Australia faces a negative trend in precipitation, observed since around 1970, leading
to more frequent and long-lasting droughts (CSIRO & BoM 2007). This entails increasing impacts and
mitigation costs for communities and the Government. At the end of 2019, the wide, intense and long-lasting
drought that affected south-eastern Australia since early 2017 (primarily New South Wales and southern
Queensland) was still ongoing. The scant precipitation over the two years led to one of the worst droughts on
record for the region. Conditions did not improve throughout 2019 and rural communities struggled to keep
farming businesses viable. Government provided essential support through several assistance pathways, but
the economic impact on the primary sector alone was estimated in billions of dollars and triggered big
investments for mitigation38. Reservoir water volumes shrank to critical levels towards the end of 201939.
River ecosystems of the Murray-Darling basin were impacted40, while dryness fed wide and severe bushfires.
The meteorological drought across New South Wales faded away during early 2020 when short and mid-term
rainfall deficits fully recovered to normal conditions. However, the longer-term deficit resulting from multi-
annual drought persists.
The south-west (Western Australia) developed severe drought conditions progressively through 2020 and until
September. In 2019, only the coasts were affected (e.g. Perth), much like the east of the Country, but later, as
conditions on the coast improved, they worsened inland. At the beginning of 2020, reservoirs were strained,
and water supply had to be delivered by trucks in several coastal towns41. Impacts were still unfolding on
inland agriculture as the drought progressed towards the end of 2020.
Figure 6. Risk of Drought Impact for agriculture, mid of January 2020
Source: Global Drought Observatory.
New Zealand experienced a relatively short but intense drought in its northern half since February 2020,
peaking in May and ranking as one of the most extreme droughts in modern times 42. Auckland and the wider
region were subject to water restrictions43 while dam levels remained below average for the period. During
the austral winter the drought eased, and soil moisture fully recovered, but in September a regression to
drought was observed again.
38
https://www.agriculture.gov.au/ag-farm-food/drought/future-drought-fund
39
Regional Monthly Drought Report, WaterNSW (Australia), 13 Dec. 2019,
https://www.waternsw.com.au/__data/assets/pdf_file/0008/151892/Regional-Drought-Monthly-Report-December-2019.pdf
40
“Impact of drought on NSW river system to worsen this summer", 7news, 10 Sep. 2019, https://7news.com.au/news/nsw/impact-of-
drought-on-nsw-river-system-to-worsen-this-summer-c-445804
41
Daly J., Logan T., Loney G., “Drinking water to be trucked into more than a dozen West Australian towns due to 'unprecedented' dry”,
ABC News, 5 Feb. 2020, https://www.abc.net.au/news/2020-02-06/wa-water-minister-warns-of-unprecedented-
shortages/11934262
42
Noll B., “Auckland’s drought most extreme in modern times”, National Institute of Water and Atmospheric Research (NIWA), 22 May
2020, https://www.niwa.co.nz/news/aucklands-drought-most-extreme-in-modern-times
43
https://www.watercare.co.nz/Water-and-wastewater/Drought-response
121.2 Droughts on the Global Disaster Alerting Coordination System (GDACS)
GDACS is a cooperation framework between the United Nations, the European Commission and disaster
managers worldwide, to improve alerts, information exchange and coordination in the first phase after major
disasters.
Concerning droughts, the data supporting GDACS and its score attribution is extracted from the Global
Drought Observatory (GDO) and integrated with additional information from authoritative institutions, media
and scientific organizations. The purpose is to provide every ten days an overview of the droughts that are
having an impact on the ground. The map of Figure 7 highlights the areas withstanding a confirmed drought
for at least one month during the period from October 2019 to September 2020, including those that started
earlier. Since duration is not a measure of drought severity per se and given the differences in coping capacity
among countries, the magnitude of impacts are further specified with colors (Table 1). In most instances, a
drought has only mild impacts before fading away, either due to its relatively low intensity or the sufficient
coping capacity of people and assets affected.
Table 1. Description of the three main classes of drought events by impacts, from GDACS.
GDACS class (1) Description
Green A confirmed drought, but no evidence of impacts (2)
or mild/intermediate impacts associated to a high
coping capacity. No specific action would be
envisaged by international aid providers.
Orange A drought with relevant impacts to the economy,
assets or people, but not life threatening. National
government provides aid in some form and official
declarations of a drought/disaster are released. The
drought reaches international media outlets.
International humanitarian aid providers may be
alerted, or international cooperation triggered.
Red Like orange, plus very severe or life-threatening
impacts to people: migrations and internal
displacements, famine or starvation, violence
explicitly related to water resources conflicts.
International humanitarian aid is needed or has
been requested/dispatched.
(1) Sub-categories are detailed further at https://www.gdacs.org/Knowledge/models_dr.aspx
(2) The green class is sometimes attributed also to droughts of such magnitude by duration and extension that are
assumed to have at least some impacts, but there is lack of evidence.
Source: GDACS.
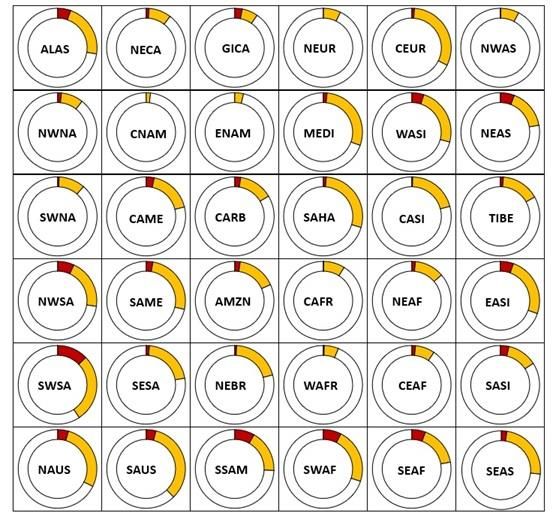
In total, GDO identified and monitored 40 droughts between October 2019 and September 2020 (Figure 8),
of which 1 in the red class of utmost urgency (southern Africa), 12 in the orange class, showing severe
impacts, and 27 as green, for those of mild or no impact (or lack of information).
The countries affected by these droughts at least to some extent were: Angola, Argentina, Australia, Belgium,
Belize, Bhutan, Bolivia, Botswana, Brazil, Bulgaria, Cambodia, Canada, China, Colombia, Czech Republic,
Dominican Republic, France, Germany, Guatemala, Haiti, Honduras, India, Indonesia, Iran, Iraq, Ireland, Italy,
Kazakhstan, Laos, Lesotho, Luxembourg, Madagascar, Malawi, Malaysia, Mexico, Moldova, Mongolia, Morocco,
Mozambique, Myanmar, Namibia, Netherlands, New Zealand, Nicaragua, Paraguay, Peru, Philippines, Poland,
Romania, Russia, South Africa, Sri Lanka, Switzerland, Thailand, Turkey, Ukraine, United States, Venezuela,
Vietnam, Zambia, Zimbabwe.
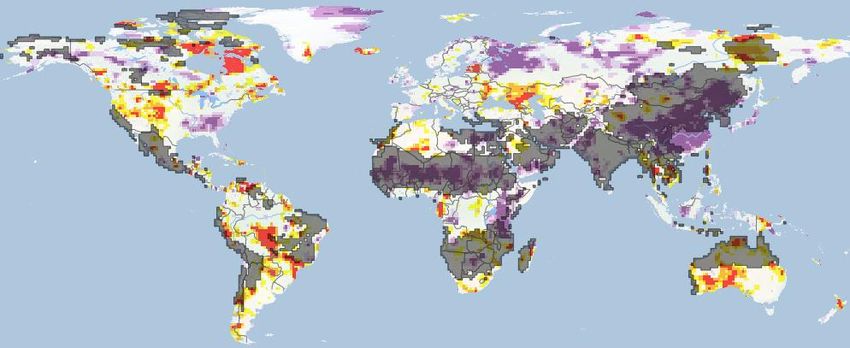
13Figure 7. Heatmap of active droughts in GDACS during the interval October 2019 to September 2020. Unit is a ten-day
interval (dekad); the colour gradient indicates the number of dekads recorded as under drought.
Source: Global Drought Observatory.
Figure 8. Map of drought events monitored by GDO for GDACS between October 2019 and September 2020.
Source: Global Disaster Alert Coordination System.
During the period considered, the longest lasting drought on GDACS affected peninsular Southeast Asia and
lasted about 270 days. Still active as of September 2020, it started about two years earlier. Other long-
lasting droughts were recorded, as showed by Figure 7: southern Africa, eastern Australia, southern Brazil and
Paraguay, central Argentina and Chile, Ukraine and central-west Europe. A few of them were over by
September 2020. The median duration of events appearing on GDACS stands at around five months, although
events may not show up on the map uninterruptedly over their whole duration. The shortest event to enter the
GDACS map viewer lasted 62 days (note, it is required a minimum of at least 30 days for the event to be
included).
The largest area under risks linked to drought at any given time during the year comprised a wide region
spanning from Argentina to Brazil and through Paraguay, affecting to some degree a surface of 560000
square kilometres, more than the size of continental France. Other wide events were in central America and
south-western US, China and Australia. Europe had a few separate events that collectively may reach the top
of this ranking. Median extent of events reported to GDACS is 126000 square kilometres.
Impacts of drought vary from one place to another, depending on the main economic activities, coping
capacity, the amount of people and assets exposed, etc. Table 2 summarizes the most frequent proxies of
impacts recorded, among those under observation. The data is structured in simple basic categories, generic
enough to be transposed across regions, regardless of local specificities. As more severe and diverse the
impacts become, the GDACS class rises accordingly. In the period considered, only the drought in southern
14Africa reached the red alert class and indeed, most of pathways of impacts occurred there. On the contrary,
during minor droughts the impacts tend to be smaller and less information is available, hence they are more
difficult to assess.
Table 2. Incidence of selected impact proxies by GDACS class (green, orange, red). In brackets is the number of events for
which information is unknown, out of the class total. Information are sourced from authoritative institutions, media and
scientific and humanitarian organizations.
Impact proxy Green - 25 events Orange - 14 events Red - 1 event
Crop damages 5 (13) 8 (6) 1 (0)
Food prices increase 0 (19) 3 (7) 1 (0)
Food insecurity 1 (11) 4 (4) 1 (0)
Migrations 0 (10) 1 (7) 0 (0)
Water supply issues 2 (16) 7 (7) 1 (0)
Reservoirs depleted 0 (19) 3 (8) 1 (0)
Low river flows 6 (16) 6 (8) 0 (1)
Livestock lack of feed 3 (18) 7 (6) 1 (0)
Impacts on the wider 0 (15) 0 (9) 1 (0)
economy
High fire hazard 9 (13) 8 (6) 1 (0)
15You can also read