Isotopic Evidence for Long-Distance Connections of the AD Thirteenth-Century Promontory Caves Occupants
←
→
Page content transcription
If your browser does not render page correctly, please read the page content below
Isotopic Evidence for Long-Distance Connections of the AD
                   Thirteenth-Century Promontory Caves Occupants

     Jessica Z. Metcalfe         , John W. Ives, Sabrina Shirazi, Kevin P. Gilmore, Jennifer Hallson,
                                Fiona Brock, Bonnie J. Clark, and Beth Shapiro

The Promontory caves (Utah) and Franktown Cave (Colorado) contain high-fidelity records of short-term occupations by
groups with material culture connections to the Subarctic/Northern Plains. This research uses Promontory and Franktown
bison dung, hair, hide, and bone collagen to establish local baseline carbon isotopic variability and identify leather from a
distant source. The ankle wrap of one Promontory Cave 1 moccasin had a δ13C value that indicates a substantial C4 component
to the animal’s diet, unlike the C3 diets inferred from 171 other Promontory and northern Utah bison samples. We draw on a
unique combination of multitissue isotopic analysis, carbon isoscapes, ancient DNA (species and sex identification), tissue
turnover rates, archaeological contexts, and bison ecology to show that the high δ13C value was not likely a result of local
plant consumption, bison mobility, or trade. Instead, the bison hide was likely acquired via long-distance travel to/from an
area of abundant C4 grasses far to the south or east. Expansive landscape knowledge gained through long-distance associa-
tions would have allowed Promontory caves inhabitants to make well-informed decisions about directions and routes of move-
ment for a territorial shift, which seems to have occurred in the late thirteenth century.

Keywords: stable isotopes, migration, mobility, bison, Great Basin, Promontory Caves, Franktown Cave, Dene, Athapaskan,
Apachean

Las cuevas Promontory (Utah) y la Cueva Franktown (Colorado) contienen registros de alta fidelidad en cuanto a las ocupa-
ciones de corto término de grupos humanos con cultura material conectada al Subártico/Planicies del Norte. Esta investiga-
ción utiliza excremento, pelo, piel de cuero y colágeno del hueso de bisonte provenientes de los sitios Promontory y Franktown
para establecer una base de datos isotópicos locales y variabilidad isotópica de carbono e identifica la piel de cuero de pro-
cedencia lejana. La envoltura de tobillo de un mocasín recuperado de la Cueva 1 de Promontory tuvo un valor δ13C que indica
un componente C4 considerable en la dieta del animal, lo que es un resultado distinto a las dietas C3 que se identificaron a
partir del análisis de 171 muestras de bisonte provenientes de Promontory y el norte de Utah. Aplicamos una combinación
única de análisis isotópico de tejidos múltiples, mapas isotópicos (“isoscapes”) de carbono, ADN antiguo (identificación
de sexo y especie), tasa de remodelación de tejidos, contextos arqueológicos y la ecología del bisonte para demonstrar que
el valor alto δ13C probablemente no es un resultado debido al consumo de plantas locales, movilidad del bisonte o comercio.
En cambio, la piel de cuero del bisonte fue probablemente adquirida a través de viajes de larga distancia hacia zonas con

Jessica Z. Metcalfe ( jmetcal1@lakeheadu.ca, corresponding author) ▪ Department of Anthropology, Lakehead University,
955 Oliver Road, Thunder Bay, Ontario P7B 5E1, Canada
John W. Ives and Jennifer Hallson ▪ Department of Anthropology, University of Alberta, Edmonton, Alberta T6G 2E3,
Canada
Sabrina Shirazi ▪ Department of Ecology and Evolutionary Biology, University of California, Santa Cruz, 1156 High Street,
Santa Cruz, CA 95064, USA
Kevin P. Gilmore ▪ HDR, 9781 S. Meridian Boulevard, Suite 400, Englewood, CO 80112, USA
Fiona Brock ▪ Cranfield Forensic Institute, Cranfield University, Defence Academy of the United Kingdom, Shrivenham SN6
8LA, UK
Bonnie J. Clark ▪ Department of Anthropology, University of Denver, 2000 E. Asbury Avenue, Denver, CO 80208, USA
Beth Shapiro ▪ Department of Ecology and Evolutionary Biology and Howard Hughes Medical Institute, University of
California, Santa Cruz, 1156 High Street, Santa Cruz, CA 95064, USA
                                        American Antiquity 86(3), 2021, pp. 526–548
Copyright © The Author(s), 2021. Published by Cambridge University Press on behalf of the Society for American Archae-
 ology. This is an Open Access article, distributed under the terms of the Creative Commons Attribution licence (http://crea-
tivecommons.org/licenses/by/4.0/), which permits unrestricted re-use, distribution, and reproduction in any medium, provided
                                              the original work is properly cited.
                                                  doi:10.1017/aaq.2020.116

                                                             526
Metcalfe et al.                ISOTOPIC EVIDENCE FOR LONG‐DISTANCE CONNECTIONS                                            527

pastos C4 abundantes muy al sur o al este. El conocimiento extenso sobre el paisaje obtenido a través de asociaciones de larga
distancia debió permitir a los habitantes de las cuevas Promontory tomar decisiones bien informadas sobre las direcciones y
rutas de movimiento para realizar un cambio territorial, el cual parece haber ocurrido a finales del sigo XIII.

Palabras clave: isótopos estables, migración, movilidad, bisonte, Gran Cuenca, Cuevas Promontory, Cueva Franktown, Dene,
Atapascano, Apacheano

   The standard practice of eliminating apparent                wrap of a fragmentary moccasin recovered in our
   “anomalous” results preclude[s] the possibil-                2011 excavations had a δ13C value (−12.5‰)
   ity of discovering the unexpected, identifying               that was much higher than any of the other 51
   the unusual, and uncovering individual short-                values obtained from materials in the same arch-
   lived visitation events [Seymour 2010:158].                  aeological context (Ives, Froese, et al. 2014). In
                                                                contrast to the moccasin’s unusual δ13C value, its
In the quotation above, Seymour (2010) argues                   AMS and calibrated calendar dates (725 ± 24
that chronometric dating outliers can provide                   years BP, OxA-25234; 95% probability range
critical evidence of periodic short-term occupa-                AD 1252–1290) fell firmly within both the mea-
tions, particularly among highly mobile popula-                 sured and Bayesian-modeled ranges of the other
tions. In this article, we argue that Seymour’s                 Promontory samples (Ives, Froese, et al. 2014).
statement is even more relevant for stable isotope                 In this study, we examine the significance of this
analyses. In radiocarbon dating, tiny amounts of                isotopically unusual moccasin leather. Is it feasible
contaminant carbon can have extremely large                     that its high δ13C value came from a bison consum-
effects on measurement results and hence on                     ing plants near the Promontory caves? Or did it
inferred dates (e.g., Wood et al. 2016; Zazula                  come from somewhere else? If so, where? To
et al. 2014). In contrast, stable carbon isotope                address these questions, we present a local carbon
(δ13C) values measured from purified materials                   isotope baseline of 157 samples of Promontory
such as bone collagen and hair keratin are less                 caves bison dung, hair, hide, and bone collagen;
susceptible to contamination. Only large-scale                  14 samples of modern Antelope Island bison hair
biochemical alteration and/or contamination sig-                and dung; and 8 samples of Promontory-era Frank-
nificantly alters δ13C values, and such changes                  town Cave bison hair and hide (Figure 1). We use
can usually be detected using quality-control                   these isotopic data along with a grassland carbon
indicators (Ambrose 1990; van Klinken 1999).                    isoscape, ancient DNA (species and sex identifica-
Consequently, a single carbon stable isotope out-               tion), tissue turnover rates, and analogies with
lier can provide robust insight into aspects of                 modern bison behavior to evaluate competing
human or animal behavior, including migration                   explanations for the outlying Promontory mocca-
and mobility. Outlying δ18O and 87Sr/86Sr values                sin δ13C value. These alternative hypotheses
measured from tooth enamel are well established                 include the following: (1) the leather was from a
as indicators of human and animal migrations                    local Promontory-area animal that consumed
where local isotopic baselines are well con-                    unusually large amounts of C4 and/or CAM plants,
strained (e.g., Bentley and Knipper 2005; Hodell                (2) the leather was from an animal that migrated
et al. 2004). In some contexts, outlying δ13C                   into the Promontory region from a faraway loca-
values obtained from animal tissues may provide                 tion, (3) the leather was obtained from a faraway
similarly valuable insights (Hobson and Wasse-                  location through trade, or (4) the leather was
naar 2019). Obtaining a robust baseline of local                obtained during long-distance travel by people.
isotope values is crucial for this type of research.
    While engaged in a comprehensive AMS radio-                                The Promontory Caves
carbon dating study of early Promontory Phase
materials from the Promontory caves of northern                 The Promontory caves were excavated in 1930–
Utah (Steward’s [1937] Promontory Culture), we                  1931 by Julian Steward (1937) and again
noticed that one leather sample from the ankle                  between 2011 and 2014 by Ives, Janetski, and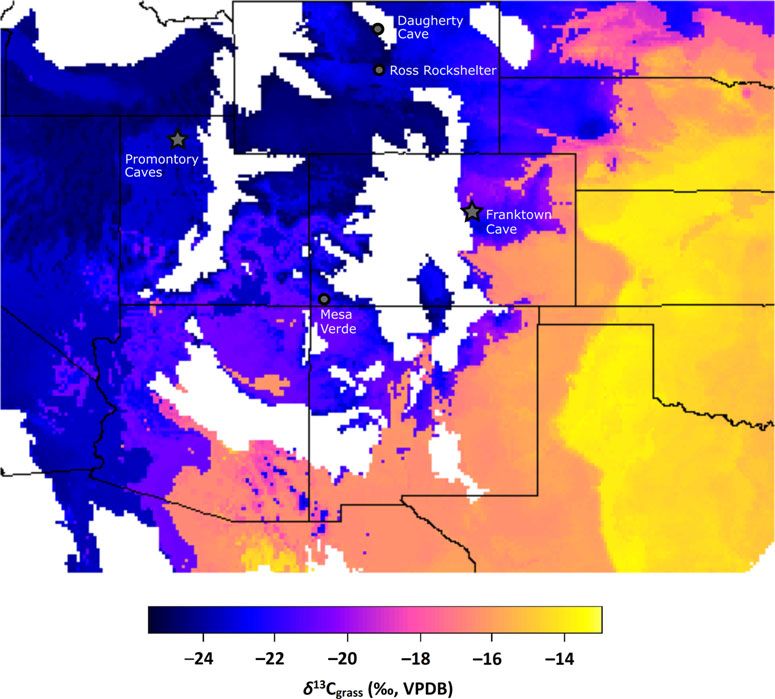
528                                           AMERICAN ANTIQUITY                                Vol. 86, No. 3, 2021

Figure 1. Locations mentioned in the text, including sampling locations (Promontory Caves, Franktown Cave, Antelope
Island) and other locations with Promontory-style moccasins (Daugherty Cave, Ross Rockshelter, Mesa Verde). Inset
map shows colonial-era locations of Dene groups in North America.

colleagues (Billinger and Ives 2015; Ives 2014,            Promontory Culture. Cave 2 (42BO2) has some
2020; Ives, Froese, et al. 2014). Both research            preceding Archaic occupations and a substantial
episodes recovered an abundance of exquisitely             Promontory Culture layer, although fewer depos-
preserved organic remains, including moccasins,            its than Cave 1. Steward (1937) found that the
basketry, and cordage; many varied gaming                  Promontory Culture layer in Cave 1 covered
pieces; a complete range of stone and bone                 much of the roughly 240 m2 of habitable space
tools, from hunting weaponry to hide processing            and averaged about 65 cm in depth. Although
tools; ceramics; items of adornment; indications           we made similar stratigraphic findings in Stew-
of ceremonial life such as rock art and incised            ard’s Trench B area, in his Trench A area toward
tablets; and animal bone, hide, hair, and dung             the front of Cave 1, we discovered intact midden
(Figure 2; Ives, Froese, et al. 2014; Thomas               deposits that were 2 m deep. These Cave 1 depos-
2018; Yanicki and Ives 2017). Two aspects of               its produced a large assemblage of radiocarbon
the Promontory occupation are abundantly                   dates with a tight range of ages Bayesian
clear: bison and other large game animals were             modeled between AD 1240 and 1295 (95% prob-
intensively hunted near the caves, and Cave 1              ability estimate; Ives, Froese, et al. 2014).
(42BO1) was a residential location at which                    Although our excavations were minor (roughly
women, men, subadults, and children were pres-             3 m3 of deposit) we recovered more than
ent at various seasons for extended periods of             30,000 whole and fragmentary faunal remains,
time over one or two human generations.                    supporting Steward’s (1937) contention that the
   Cave 1 contains faint, discontinuous traces of          Promontory cave occupants focused almost
Archaic use, but the vast majority of deposits are         exclusively on large-game hunting, particularly
Metcalfe et al. ISOTOPIC EVIDENCE FOR LONG‐DISTANCE CONNECTIONS 529
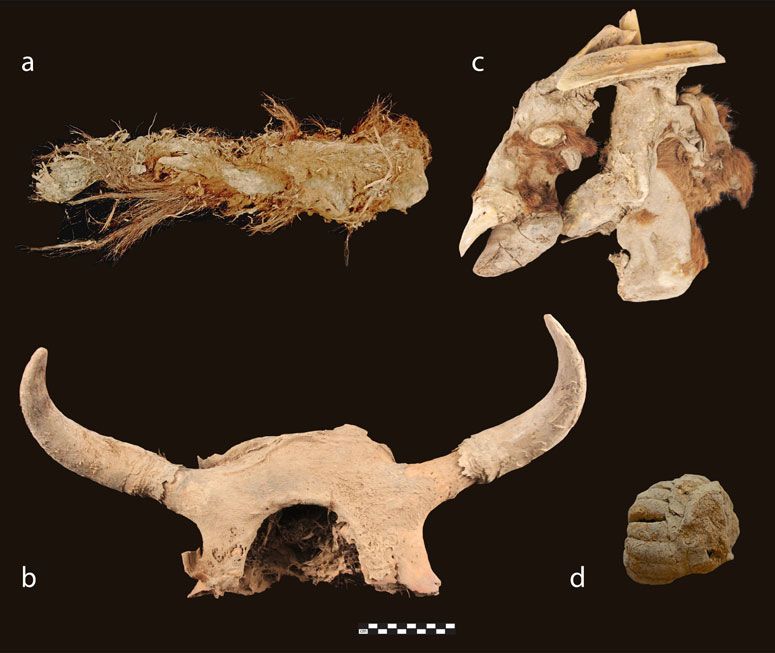
Figure 2. Exceptionally preserved late thirteenth-century bison materials from Promontory Cave 1 (42BO1), including
(a) hide and long hair (FS-203); (b) skull with hide and horn sheaths (FS-1255); (c) limb with hair, hide, hoof, and bone
(FS-1); and (d) dung (FS-703). Photographs by by J.W. Ives (a, b, c) and J. Hallson (d).
of bison and pronghorn (see Johansson 2013). bulrush seeds (by-products of summer mat mak-
Our excavations yielded few small mammals or ing)—indicates that Cave 1 was occupied during
aquatic resources and scant evidence of seed various seasons of the year. Obsidian sourcing
processing (Ives, Johansson, et al. 2014). The and ceramic evidence further suggest that Prom-
Promontory Culture occupation postdates the ontory cave occupants ranged into southern
cessation of maize horticulture among the local Idaho (Arkush 2016; Ives 2020). Altogether,
Fremont, although relatively sedentary popula- the Cave 1 Promontory Culture deposits reflect
tions were still present in the area, including a sudden, substantial, but seasonally intermittent
the nearby Chournos Springs site (e.g., Yanicki residential occupation of about 55 years’ dur-
2019). ation, supported by intensive large-game hunt-
For Promontory Cave 1, discard and accumu- ing. The high volume of material culture
lation formulae along with space syntax analyses resulted from the domestic presence of many
suggest a group size of roughly 35 persons, an children, subadults, and adult women and men.
estimate of 1.8 million whole and fragmentary Steward (1937) concluded that the Promon-
faunal remains, and an extrapolated total of tory Culture deposits had been created by a
2,400 moccasins within the deposits (Hallson population with northern Plains and Subarctic
2017; Lakevold 2017). Seasonality indicators affinities. He voiced the suspicion that they
are still being refined, but a range of evidence were Dene ancestors who had lingered long
—from deer skulls with cast antlers to abundant enough to absorb material culture characteristics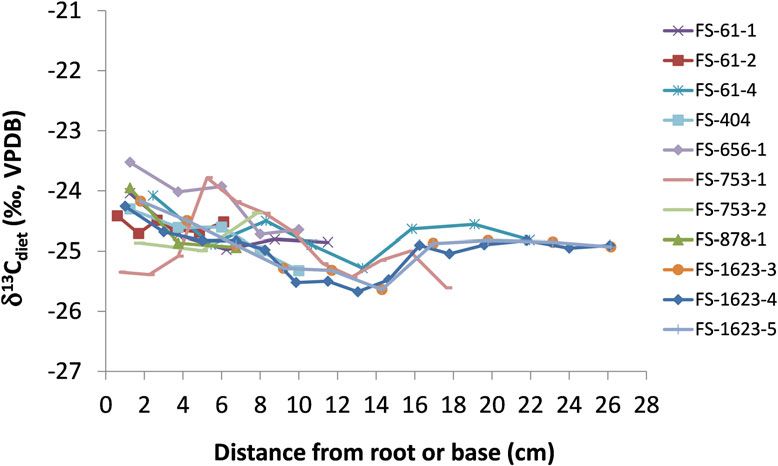
530                                         AMERICAN ANTIQUITY                              Vol. 86, No. 3, 2021

from neighboring terminal Fremont communi-              in western North America was turbulent, featur-
ties. The potential attribution of a proto-             ing profound social and environmental shifts in
Apachean identity to the Promontory cave occu-          which hunter-gatherer mobility imparted signifi-
pants is an underlying interest in our research         cant advantages for some groups as more seden-
group. Triggered by the massive White River             tary societies vanished (as with Fremont) or
Ash east lobe eruption at AD 846–848, a small           retracted (as with Puebloan communities; e.g.,
founding population of Apachean ancestors               Benson et al. 2007; Kohler et al. 2014; Robinson
may have gradually made their way south in              et al. 2021). By the time of Spanish contact, there
ensuing centuries (e.g., Achilli et al. 2013; Kris-     existed a variety of Plains-Puebloan interactions
tensen, Andrews, et al. 2019; Kristensen, Hare,         founded on the trade of Plains bison and other
et al. 2019; Kristensen et al. 2020). Promontory        products for Puebloan goods, and a spectrum of
caves material culture linkages to the Subarctic        relationships ranging from enclavement among
include moccasins constructed in a characteris-         Puebloan communities (as with the Jicarilla Apa-
tically Subarctic style (Bata Shoe Museum clas-         che) to raiding (Eiselt 2012). Irrespective of the
sifications BSM 2[Bb] and BSM 2[Ab]), fine                precise cultural identity of the people who pro-
leather from a sophisticated hide-processing tra-       duced it, the Promontory record suggests that the
dition, and distinctive artifacts such as chi-thos      foundation for later relationships between Plains
(tabular bifaces used for hide softening), which        bison-oriented economies and more sedentary
are common in the Subarctic but unknown in              villagers was being laid in the thirteenth century.
Fremont assemblages (Ives, Froese, et al. 2014;
Webber 1989). The Promontory moccasins                                  Franktown Cave
stand in visible contrast to many surrounding
forms of footwear, from hide and plant fiber san-        Franktown Cave (5DA272), Colorado (south of
dals to hock moccasins (e.g., Clark 1885:257;           Denver on the Palmer Divide; Figure 1), has
Hatt 1916; Lycett 2015). The Promontory moc-            material cultural affiliations with the late
casins are completely unlike Fremont footwear           thirteenth-century Promontory caves. Like Prom-
or most other footwear in a broader arc in interior     ontory, Franktown Cave’s assemblage includes
western North America (Ives 2020:103–104;               Promontory-style ceramic sherds, a netted gaming
Ives, Froese, et al. 2014: 626–627). Like many          hoop, incised wood (probably gaming pieces),
other forms of clothing, moccasins signal cul-          sinew-backed bows, and two moccasins of the
tural identity (in the caliber of leather, the knowl-   BSM-2(Bb) type (Gilmore 2005). According to
edge of requisite patterns, execution of fine            Bayesian modeling (95% probability estimates),
motor skills, and decorative techniques). As for        these Franktown artifacts date to AD 1180–
absorbing regional traits, the rare basketry in         1280, which overlaps and slightly predates the
the Promontory caves is characteristic of Great         occupation of the Promontory caves themselves
Basin forms, and Promontory pottery was                 (Gilmore et al. 2021; Gilmore, Hamilton, and
influenced by Fremont forms (Ives, Froes, et al.         Ives 2017). Both Franktown Cave and Promon-
2014; Yanicki 2019). We are nevertheless                tory Cave 1 occupy easily defensible positions
mindful of other explanations for the Promontory        overlooking the surrounding area, which may
Culture expressions. These would include the            reflect only partial integration with local groups
possibility of Kiowa involvement (although this         in a dynamically changing thirteenth-century
would have its own Dene dimension, given the            sociopolitical landscape (Lakevold 2017). The
long-term Kiowa relationship with Ndee [Plains          Late Prehistoric occupants of Franktown Cave
Apache] peoples) or the prospect that Promon-           and the Promontory caves shared a distinctive
tory expressions might be yet more broadly poly-        material culture heritage (Ives, Froese, et al. 2014).
ethnic in character (Ives 2014, 2020; Mooney
1898; Ortman and McNeil 2017).                           Carbon Isotopes in Bison Diets: Vegetation
    Whatever the cultural identities involved, the
Promontory record raises an important and               Bison are herbivores and therefore derive their
broader set of issues. The AD thirteenth century        carbon isotope compositions from plants.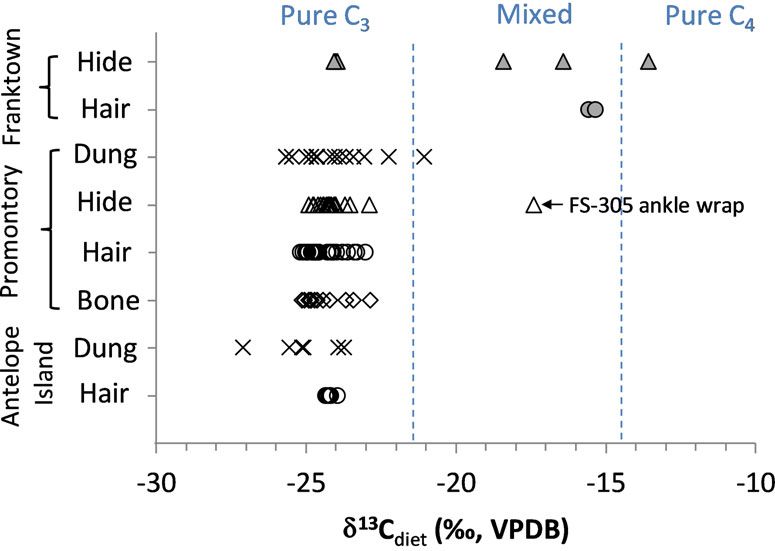
Metcalfe et al.          ISOTOPIC EVIDENCE FOR LONG‐DISTANCE CONNECTIONS                             531

Although they are primarily grazers, bison also       to indicate consumption of C4 or CAM plants.
occasionally consume sedges, forbs, and, less         Given bison dietary preferences, such values
frequently, woody plants (Gogan et al. 2010).         would most likely indicate consumption of C4
Bison prefer nutritious new growth, particularly      grasses.
C3 grasses during cooler seasons and C4 grasses           There is a very clear separation between the
during summer (Gogan et al. 2010). Across the         δ13C values of C3 and C4/CAM plants: their dis-
Great Plains, modern free-ranging bison tissue        tributions are nonoverlapping and their means
δ13C values directly correlate with local abun-       differ by about 14‰ (Cerling et al. 1999;
dances of C3 and C4 grasses (Hoppe et al. 2006).      O’Leary 1988). Modern C4 plant δ13C values
   Carbon isotope analysis can be used to distin-     typically fall within the range of −16‰ to
guish between plants using different photosyn-        −10‰, and modern CAM plants that are actively
thetic pathways: C3 (cool-season grasses, forbs,      utilizing the CAM photosynthetic pathway also
and most woody vegetation), C4 (warm-season           tend to have δ13C values within this range
grasses and some shrubs), and CAM (cacti and          (O’Leary 1988; Sternberg et al. 1984). Modern
succulents). Today, northern Utah, southern           C4 plants from Utah fall within this range as
Idaho, and western Wyoming vegetation is domi-        well (Coltrain and Leavitt 2002). Accounting
nated by shrubs and C3 grasses. Although sub-         for a Suess Effect shift of 1.6‰, the preindustrial
stantial C3 grasslands exist in this region, C4       C4/CAM plant range would have been about
grasses are relatively rare (Cotton et al. 2016).     −14.4‰ to −8.4‰. A recent study of well-
Microhabitats that support higher abundances          preserved Late Pleistocene and Early Holocene
of C4 grasses (e.g., Distichlis spicata, Sporobo-     plants from Utah’s Colorado Plateau resulted in
lus airoides), however, do exist (Morden et al.       CAM plant (Opuntia sp.) δ13C values between
1986). C4 shrubs (e.g., Atriplex spp.) and CAM        −10.8‰ and −9.8‰ (mean = −10.3‰), in
cacti and succulents (e.g., Opuntia spp.) are rela-   agreement with these global generalizations
tively abundant in northern Utah (Coltrain and        (Metcalfe and Mead 2019).
Leavitt 2002; Sandquist and Ehleringer 1995;
Ugan and Coltrain 2012), but are not known to            Carbon Isotopes in Bison Tissues: Diet
be components of bison diets.                                         Estimates
   Modern C3 plants have a mean δ13C around
−27‰, with a range from about −37‰ to                 To directly compare animal tissues to one
−20‰ (Kohn 2010). Modern plant values are             another or to plant δ13C values, one must
lower than those of plants that grew before the       account for isotopic fractionations that occur
onset of large-scale human industrial activities,     when plant carbon is incorporated into each
which are continually lowering the δ13C of atmos-     type of biological tissue. Large herbivore
pheric CO2 (e.g., Graven et al. 2017). The Holo-      bone collagen δ13C values are about 5‰ higher
cene preindustrial δ13C of CO2 was about              than the δ13C of plants in their diet (Drucker
−6.4‰ (Schmitt et al. 2012), which is 1.6‰            et al. 2008; Tieszen 1994). Hair δ13C values
higher than the postindustrial atmospheric CO2        are on average about 3‰ higher than δ13C of
δ13C of −8.0‰ used by Kohn (2010) to standard-        plants in the diet (Bocherens et al. 2014;
ize his modern plant values. Thus, preindustrial      Crowley et al. 2010; Drucker et al. 2008).
C3 plants should have had a global mean δ13C          Dung δ13C values are typically 1‰ lower than
of around −25.4‰ and a range between about            those of diet (Sponheimer et al. 2003). The iso-
−35.4 and −18.4‰. In a global survey of modern        topic compositions of skin (hide) have seldom
C3 plants, only plants from hyper-arid locations      been studied, but Tieszen (1994) showed that
(mean annual precipitation −23‰ (i.e., pre-         lower than bone collagen and about 2.0‰
industrial plant δ13C >−21.4‰; Kohn 2010).            higher than hair, which is broadly consistent
Because bison do not consume pine, preindustrial      with experimental studies of manatee and seal
bison with inferred dietary δ13C significantly         skin (Alves-Stanley and Worthy 2009; Ames
higher than −21.4‰ can reasonably be inferred         et al. 1996; Hobson et al. 1996).
532                                        AMERICAN ANTIQUITY                             Vol. 86, No. 3, 2021

    Tissues form over different time scales and can       Short-term bison diet 1–3 days prior to
therefore provide information about animal diets       deposition:
over different durations of time. Bison dung repre-
sents the diet consumed 1–3 days immediately                       d13 Cdiet = d13 Cdung + 1              (1)
prior to deposition (Rutley and Hudson 2000;
Schaefer et al. 1978), and therefore likely includes   Medium-/short-term bison diet (weeks/months):
vegetation consumed in the geographical region
                                                                    d13 Cdiet = d13 Chair −3              (2)
of deposition. In contrast, bone collagen δ13C
values are derived from the diet consumed over
                                                          Medium-term bison diet (months):
a period of years (Hedges et al. 2007; Hobson
and Clark 1992). A recent study found that the                     d13 Cdiet = d13 Chide −4.5             (3)
cortical bone of bear, deer, serow, and macaque
formed primarily during adolescence (i.e., the            Long-term diet (years):
active bone-growth phase) rather than throughout
the animal’s life (Matsubayashi and Tayasu 2019).                d13 Cdiet = d13 Cbonecollagen −5         (4)
Thus, in some instances, bison cortical bone colla-
gen may represent the diet several years prior to         A further conversion is needed to make diet
death. If an old animal migrated into a new area       δ13C values obtained from modern samples di-
during its adolescence, its bone collagen could        rectly comparable to those from preindustrial arch-
represent foods consumed in locations quite dis-       aeological samples. In this study, the δ13C values
tant from where the bones were recovered. If ani-      of modern Antelope Island samples collected in
mals did not migrate, bone collagen would              2017 are converted to preindustrial equivalents
provide a record of local diet. Regardless, bone       by adding +2.1‰, which accounts for the higher
collagen integrates diet over a long period of         atmospheric CO2 in 2017 (when the samples
time. Hair contains a short- or medium-term            were collected; ca. −8.5‰) relative to the pre-
record of diet, depending on the sampling strat-       industrial global atmospheric CO2 δ13C value of
egy and the hair’s growth rate. When hair is           −6.4‰ (Graven et al. 2017; Schmitt et al. 2012).
sampled in segments, it is possible to recover
a time series of changes over a period of days,                    Materials and Methods
weeks, or months. Skin is constantly re-forming
and therefore represents diet relatively close to      Bison samples (dung, hair, hide, and bone col-
the time of death. Skin turnover rates have not        lagen) used for isotopic analysis are listed in
been studied in terrestrial mammals. Manatee           Table 1. Detailed preparation and analytical
and dolphin carbon isotope “half-lives” (time          methods are provided in the Supplemental
to reach half-equilibrium with new values after        Methods and explained here in brief. Hair and
a controlled-diet switch) ranged from about            hide were cleaned and bone collagen was
two weeks to four months, so time to reach             extracted following established procedures.
full equilibrium would be on the order of several      Carbon isotope compositions (δ13C) and carbon
months or more (Alves-Stanley and Worthy               and nitrogen contents (%C, %N) were measured
2009; Browning et al. 2014). Based on these            using an Elementar Vario Micro Cube elemen-
turnover rates, bone and skin δ13C values              tal analyzer, coupled with an Isoprime stable
would be less likely to record brief and/or occa-      isotope ratio mass spectrometer in continuous-
sional consumption of isotopically distinct            flow mode. Elemental compositions were cali-
plants, whereas dung and hair δ13C would               brated using USGS-40. δ13C values were cali-
hold greater potential for recording such brief        brated to the VPDB scale using USGS-40 and
deviations from a typical diet.                        USGS-41 or 41a (accepted values −26.39‰,
    Based on the research described above, we          +37.63‰, and +36.55‰, respectively). Internal
convert bison dung, hair, hide, or bone collagen       check standards (gelatin, methionine, red lentil,
δ13C to short-, medium-, and long-term diet            amaranth; accepted values −15.30‰, −28.60‰,
δ13C according to the following equations:             −26.12‰, −13.59‰, respectively) and sample
Metcalfe et al. ISOTOPIC EVIDENCE FOR LONG‐DISTANCE CONNECTIONS 533
Table 1. Isotopic and Elemental Data for Bison Tissues from Promontory (42BO1, 42BO2), Franktown (5DA272), and
Antelope Island (AI).
Material Site Sample Element/Type δ13Ctissue δ13Cdiet %C %N C/N
Bone collagen
42BO1 FS-1 Long bone –19.2 –24.2 38.5 14.0 3.2
42BO1 FS-187.82 Scapula –20.0 –25.0 41.6 14.3 3.4
42BO2 FS-19 #1 Long bone –19.8 –24.8 41.0 14.8 3.2
42BO1 FS-237.1 Radius –19.9 –24.9 41.0 14.8 3.2
42BO1 FS-237.24 Tibia (left) –17.9 –22.9 40.6 14.7 3.2
42BO1 FS-237.3 Femur –20.1 –25.1 42.6 14.8 3.4
42BO1 FS-575.38 Long bone –19.7 –24.7 41.6 14.3 3.4
42BO1 FS-575.39 Femur –19.4 –24.4 42.4 15.1 3.3
42BO2 FS-614.17 Femur (right) –18.7 –23.7 40.6 14.8 3.2
42BO1 FS-623.6 Humerus (right) –18.4 –23.4 40.4 14.8 3.2
42BO2 FS-702 Rib –19.6 –24.6 41.8 15.2 3.2
42BO1 FS-750.15 cf Humerus –19.8 –24.8 43.0 15.2 3.3
Hair
42BO1 FS-1 Ives #1-1,3,5 Coarse –21.8 –24.8 41.8 13.8 3.5
42BO1 FS-1 Ives #4 Coarse –22.0 –25.0 42.0 14.1 3.5
42BO1 FS-106-1 Coarse –21.7 –24.7 41.6 13.8 3.5
42BO1 FS-1169 Coarse –20.6 –23.6 41.4 13.8 3.5
42BO1 FS-1199 Coarse –20.4 –23.4 41.0 13.6 3.5
42BO1 FS-1305 Coarse –20.8 –23.8 40.8 13.9 3.4
42BO1 FS-1623-3a Coarse –21.8 –24.8 45.5 14.8 3.6
42BO1 FS-1623-4a Coarse –22.0 –25.0 42.7 13.7 3.6
42BO1 FS-1623-5a Coarse –21.9 –24.9 44.2 14.5 3.6
42BO1 FS-190-2 Coarse –20.0 –23.0 42.1 14.1 3.5
42BO1 FS-203 Coarse –22.0 –25.0 42.1 13.5 3.6
42BO1 FS-203 Coarse –21.1 –24.1 41.4 13.8 3.5
42BO1 FS-249-2 Coarse –20.3 –23.3 41.6 13.5 3.6
42BO1 FS-292 Coarse and fine –21.3 –24.3 42.6 13.8 3.6
42BO1 FS-311-1 Coarse –21.1 –24.1 42.3 14.0 3.5
42BO2 FS-38 Fine –22.1 –25.1 43.5 14.2 3.6
42BO1 FS-380 Coarse –21.1 –24.1 46.0 15.0 3.6
42BO1 FS-404a Coarse –21.8 –24.8 42.7 13.3 3.7
42BO1 FS-417 Fine –21.7 –24.7 44.1 14.4 3.6
42BO1 FS-417 Fine –21.6 –24.6 43.8 14.5 3.5
42BO1 FS-607 Fine –21.3 –24.3 44.0 15.0 3.4
42BO1 FS-61-1a Coarse –21.7 –24.7 42.8 14.0 3.6
42BO1 FS-61-2a Coarse –21.6 –24.6 44.6 15.3 3.4
42BO1 FS-61-4a Coarse –21.7 –24.7 44.5 14.5 3.6
42BO1 FS-656-1a Coarse –21.2 –24.2 42.9 13.8 3.6
42BO1 FS-75-2 Coarse –22.2 –25.2 41.1 13.4 3.6
42BO1 FS-753-1a Coarse –21.9 –24.9 43.2 13.8 3.6
42BO1 FS-753-2a Coarse –21.7 –24.7 44.6 14.0 3.7
42BO1 FS-775-2 Coarse –21.7 –24.7 42.8 14.4 3.5
42BO1 FS-796 Coarse –21.0 –24.0 45.8 14.9 3.6
42BO1 FS-796 Fine –21.1 –24.1 44.9 15.0 3.5
42BO1 FS-853-1 Coarse –21.6 –24.6 42.4 14.2 3.5
42BO1 FS-878-1a Coarse –21.6 –24.6 44.0 14.7 3.5
AIc AI-u Fine –23.3 –24.2 42.7 14.0 3.6
AIc AI-g Coarse –23.3 –24.2 43.3 14.2 3.6
AIc AN-472 Coarse –23.3 –24.2 44.1 14.6 3.5
AIc AN-473 Fine –23.4 –24.3 43.1 14.4 3.5
AIc AN-475 Coarse –23.4 –24.3 43.0 13.9 3.6
AIc AN-476a Fine –23.4 –24.3 44.2 14.6 3.5
AIc AN-476 b Fine –23.3 –24.2 44.4 14.6 3.5534 AMERICAN ANTIQUITY Vol. 86, No. 3, 2021
Table 1. Continued.
Material Site Sample Element/Type δ13Ctissue δ13Cdiet %C %N C/N
AIc
AN-474-1 b Coarse –23.1 –24.0 46.1 13.8 3.9
AIc TOM-455 F2 & F1 Coarse –12.6 –15.6 43.4 13.8 3.7
AIc TOM-455 F3 Coarse –12.3 –15.3 52.3 16.5 3.7
Hide/Leather
42BO1 FS-305 ankle wrap Moccasin ankle wrap –12.9 –17.4 34.9 12.4 3.3
42BO1 FS-305 body Moccasin body –20.0 –24.5 33.1 12.0 3.2
42BO1 FS-1 Ives #1 Attached to limb –19.5 –24.0 37.6 13.4 3.3
42BO1 FS-1 Ives #4 Attached to limb –19.2 –23.7 37.4 13.3 3.3
42BO1 FS-1117 Moccasin –19.0 –23.5 30.2 10.6 3.3
42BO1 FS-1145 Moccasin –19.6 –24.1 38.1 13.8 3.2
42BO1 FS-1290 Moccasin –19.5 –24.0 39.7 14.6 3.2
42BO1 FS-1318 Moccasin –20.3 –24.8 28.6 10.1 3.3
42BO1 FS-1431 Moccasin –20.1 –24.6 37.8 13.4 3.3
42BO1 FS-1568 Moccasin –19.7 –24.2 30.8 10.9 3.3
42BO1 FS-1596 Moccasin –19.7 –24.2 30.5 10.4 3.4
42BO1 FS-1675 Robe fragment –19.7 –24.2 40.4 14.8 3.2
42BO1 FS-1676 Robe fragment –18.4 –22.9 39.2 14.1 3.2
42BO1 FS-1677 Moccasin –19.8 –24.3 25.9 8.9 3.4
42BO1 FS-203 Strip, hair removed –19.9 –24.4 38.7 14.2 3.2
42BO1 FS-292 Strip, hair removed –19.8 –24.3 39.3 14.2 3.2
42BO1 FS-61-4 Removed from hair –20.4 –24.9 37.9 13.0 3.4
42BO1 FS-775 Removed from hair –19.9 –24.4 40.6 14.3 3.3
42BO1 FS-945 Moccasin –20.2 –24.7 24.1 8.0 3.5
42BO1 OxA-18156b Moccasin sole –20.4
42BO1 OxA-18160b Moccasin –20.1
42BO1 OxA-23853b Moccasin –20.2
42BO1 OxA-23854b Moccasin –20.3
42BO1 OxA-23855b Moccasin –22.5
42BO1 OxA-23856b Moccasin –19.5
42BO1 OxA-23857b Moccasin –19.9
42BO1 OxA-23886b Moccasin –20.0
42BO1 OxA-23887b Moccasin –20.5
42BO1 OxA-23888b Moccasin –18.7
42BO1 OxA-23889b Moccasin –20.3
42BO1 OxA-23890b Moccasin –20.2
42BO1 OxA-23917b Moccasin –19.3
42BO1 OxA-23918b Moccasin –20.4
42BO1 OxA-23919b Moccasin –20.0
42BO1 OxA-23920b Moccasin –18.7
42BO1 OxA-23921b Moccasin –20.4
42BO1 OxA-24002b Moccasin –19.9
42BO1 OxA-24003b Moccasin –20.0
42BO1 OxA-24004b Moccasin –19.8
42BO1 OxA-26138b Moccasin –19.3
42BO1 OxA-18159b Moccasin –19.4
5DA272 #1566 Moccasin –9.1 –13.6 36.3 12.6 3.4
5DA272 #2805 Sewn fragment –11.9 –16.4 44.0 15.8 3.2
5DA272 #3505 Moccasin –13.9 –18.4 40.9 12.6 3.8
5DA272 #440 Sewn fragment –19.5 –24.0 38.7 13.1 3.4
5DA272 #454 Sewn fragment –19.5 –24.0 35.9 12.6 3.3
5DA272 #455 Leather strip –19.6 –24.1 44.6 14.9 3.5
Dung
42BO1 FS-120 –26.0 –25.0 36.7 1.1 38.1
42BO1 FS-128 –24.9 –23.9 36.0 1.0 41.1
42BO1 FS-193 –26.5 –25.5 31.6 1.0 37.0Metcalfe et al. ISOTOPIC EVIDENCE FOR LONG‐DISTANCE CONNECTIONS 535
Table 1. Continued.
Material Site Sample Element/Type δ13Ctissue δ13Cdiet %C %N C/N
42BO1 FS-236 –26.7 –25.7 35.3 1.2 33.5
42BO2 FS-241 –24.7 –23.7 31.6 1.0 38.0
42BO1 FS-425 –24.4 –23.4 35.6 1.1 38.8
42BO1 FS-542 –25.1 –24.1 33.9 1.4 29.1
42BO1 FS-586 –23.2 –22.2 39.3 1.0 46.7
42BO1 FS-643 –26.7 –25.7 31.0 1.0 37.4
42BO1 FS-657 –25.8 –24.8 37.8 0.9 48.8
42BO2 FS-660 –25.7 –24.7 40.7 1.0 46.5
42BO1 FS-703 –25.6 –24.6 36.4 1.0 43.8
42BO1 FS-703 –24.1 –23.1 35.2 1.6 25.3
42BO1 FS-703 –22.1 –21.1 36.9 1.4 30.6
42BO1 FS-720 –25.6 –24.6 35.6 1.1 39.4
42BO1 FS-745 –25.8 –24.8 36.8 1.0 41.5
42BO1 FS-921 –25.2 –24.2 35.8 0.9 45.6
AIc AN-447 Collected dry –28.2 –25.1 39.6 1.4 33.6
AIc AN-448 Collected dry –26.8 –23.7 36.3 1.2 36.2
AIc AN-449 Collected dry –27.0 –23.9 27.3 1.4 23.0
AIc AN-450 Collected dry –28.2 –25.1 36.9 1.8 23.6
AIc AN-451 Collected wet –30.2 –27.1 34.6 2.1 19.2
AIc AN-452 Collected wet –28.7 –25.6 39.3 1.8 25.3
Note: Diet δ13C values were calculated from measured tissue values using the equations in the text. An Excel version of this
table is provided as Supplemental Table 1.
a
Values for these samples are means are from serial sampling (see Supplemental Table 2 for values of sections).
b
Carbon isotope values for these samples were obtained in the process of radiocarbon dating and previously published in Ives
and colleagues (2014). Their diet values are not calculated because the calibration does not provide the necessary precision for
paleodiet reconstruction.
c
Antelope Island diet calculations account for a +2.1‰ adjustment to make them equivalent to preindustrial values, as described
in the text.
replicates were included in each run to monitor moccasin recovered from Promontory Cave 1
measurement uncertainty. For bone collagen, (Figure 3a). The ankle wrap is one of three
hair, hide, and dung (respectively), total analytical separate pieces of leather, along with the body
uncertainty was estimated to be ±0.22‰, and vamp, used in the construction of Promon-
±0.18‰, ±0.24‰, and ±0.43‰ (for error calcula- tory-style moccasins (Figure 4). The FS-305
tion method, see Szpak et al. 2017). As shown in moccasin was missing the toe area, but its
Table 1, consistent %C, %N, and C/N ratios indicate inferred size extrapolated from complete mocca-
excellent preservation of collagen, hair, and hide. sins in the Promontory caves is about 22.5–24
Genetic analyses of the FS-305 ankle-wrap hide cm (Erika Sutherland, personal communication
sample were conducted at the UCSC Paleoge- 2019). Based on correlations between foot size,
nomics Laboratory (PGL) to (1) obtain a taxo- height, and age, this moccasin was probably
nomic identification and (2) determine the sex of worn by a youth approximately 11–13 years
the animal. Further details of both isotopic and gen- old (Billinger and Ives 2015).
etic methods can be found in Supplemental Text 1. The ankle wrap of FS-305 was originally
selected as a convenient (minimally destruc-
Results and Discussion tive) sampling location for an earlier AMS
radiocarbon dating study. For that study, the
Moccasin Leather Outlier: Context and Isotopic sample underwent the Oxford Radiocarbon
Composition Accelerator Unit (ORAU)’s routine leather
The FS-305 sample, which produced the outly- pretreatment process (lab code ACJ; Brock
ing δ13C value that inspired this study, came et al. 2010) and yielded an AMS date of 725
from an ankle wrap remnant on a fragmentary ± 24 BP (OxA-25234), calibrated to AD536 AMERICAN ANTIQUITY Vol. 86, No. 3, 2021 Figure 3. (a) Promontory Cave 1 partial moccasin FS-305, whose ankle wrap fragment (arrow), still stitched to the moc- casin body, yielded an outlying δ13C value; (b) Promontory Cave moccasin FS-969, with arrows illustrating the location of cuts that severed its ankle wrap; (c) magnified image (30×) of the cut ankle-wrap surface (arrow) on moccasin FS-969, the remnant of which remained stitched to the moccasin body; (d) a fully severed ankle wrap from Promontory Cave 1 (artifact FS-238), with arrow indicating the cut edge. Photographs by J.W. Ives. 1252–1290 using OxCal v4 (Bronk Ramsey the measured δ13C value obtained from the 2009) and the IntCal13 dataset (Reimer et al. leather (−12.9‰) to a diet δ13C value results 2013). Its associated δ13C was −12.5‰ and in an estimate of −17.4‰ for the plants con- its %C, %N, and C/N were 37%, 14%, and sumed by the animal while the skin was 3.2, respectively. In the present study, a new being formed. aliquot of the same sample was independently After confirming the ankle wrap’s unusual cleaned as described in the Supplemental δ13C, we tested the body portion of the Text 1, and its isotopic composition was same moccasin. The FS-305 moccasin body obtained following a 2-point calibration that leather produced a δ13C value of −20.0‰, produced the accuracy and precision necessary which results in a dietary δ13C estimate of for paleodietary analysis (Szpak et al. 2017). −24.5‰ (Table 1). The moccasin body Duplicate analyses of FS-305 resulted in δ13C δ13C is distinctly different from that of the values of −12.93‰ and −12.87‰, carbon con- ankle wrap but is consistent with all 171 tents of 35.0% and 34.7%, nitrogen contents of other northern Utah bison samples (Table 1). 12.3% and 12.5%, and C/N ratios of 3.32 and 3.24 (means listed in Table 1). The quality- Local Bison Eating C4 and/or CAM Plants? control indicators and reproducibility both The thickness and general appearance of the within and between labs indicate excellent FS-305 moccasin leather were consistent with preservation and support the validity of the iso- bison. Our genetic analysis supports this species topic measurements. Converting the mean of attribution (see Supplemental Text 1).
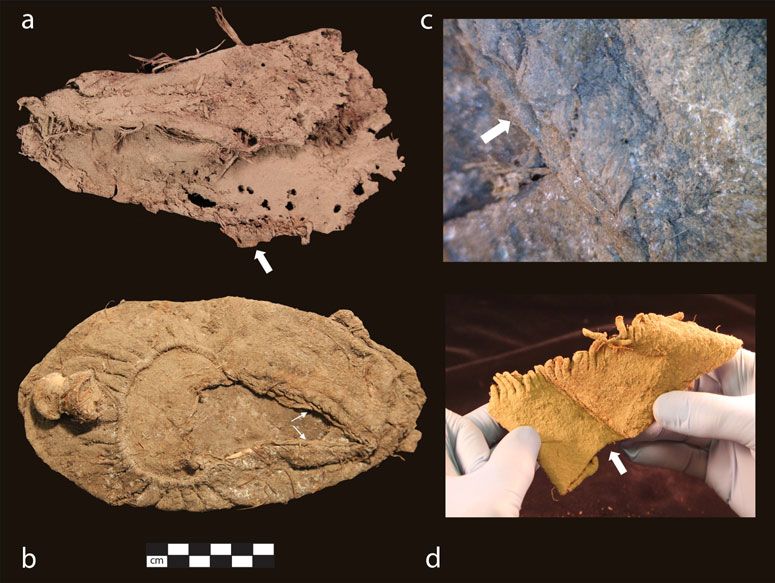
Metcalfe et al.              ISOTOPIC EVIDENCE FOR LONG‐DISTANCE CONNECTIONS                                       537

Figure 4. Promontory-style moccasins are constructed from three separate pieces of leather: (a) the body, including the
sole; (b) the vamp, and (c) the ankle wrap. Top: A Promontory-style (BSM 2 [Bb]) moccasin pattern based on the com-
plete Franktown example (#3505). Bottom: A Promontory Cave 1 moccasin (UMNH.A.8011.18, FS-42BO1.801.1) with
bison-fur lining and ankle wrap still attached. Drawing by K.P. Gilmore. Photograph by J.W. Ives.

   The FS-305 ankle wrap was the only northern               (Table 1; Figure 5). Even bison dung, which
Utah bison tissue sample with clear evidence for             would be most likely to record short-term dietary
C4/CAM plant consumption. All of the other                   deviations from the norm, clearly reflects a C3
carbon isotope measurements for Promontory                   diet. (We note that a single dung sample has a
bison tissues are consistent with purely C3 diets            δ13C value 0.3‰ higher than our C3 cutoff, but
538                                       AMERICAN ANTIQUITY                            Vol. 86, No. 3, 2021

because analytical uncertainty for dung was           Wandering Bison?
±0.43‰, this sample does not provide solid            Could the outlying δ13C of the FS-305 ankle
evidence of C4 plant consumption.) Serially           wrap be the result of a bison migrating into the
sampled Promontory bison hair, including sev-         Promontory area after spending an earlier part
eral long hairs that likely record at least a year    of its life in a high-C4 grass area? As demon-
of growth, show no evidence of temporary short-       strated by the C3 signals obtained from 171 sam-
term consumption of C4 or CAM plants. Instead,        ples of Promontory and Antelope Island bison
each individual hair shows variations of ≤1.8‰,       dung, hair, hide, and bone collagen, this would
all of which fall firmly within the C3 range           have been a highly unusual occurrence. But if
(Figure 6; Supplemental Table 2). Medium-             it did occur, what locations would have had suf-
and long-term bison diet records, including           ficiently high grass δ13C values to produce the
the bone collagen and hide/leather values, also       FS-305 value?
show no evidence of C4 or CAM plant consump-              Cotton and colleagues (2016) predictively mod-
tion (Table 1; Figure 5). Fourteen modern Ante-       eled the distributions of C3/C4 grasses and mean
lope Island bison dung and hair samples further       grass δ13C values across modern (preindustrial)
show no evidence of C4 or CAM plant consump-          North America. Given that this model was based
tion along the shores of Great Salt Lake (Table 1;    in part on measured bison δ13C values that were
Figure 5).                                            not included in the present study, it provides an
   The FS-305 leather sample clearly has a            excellent baseline for determining possible regions
much higher δ13C value than any of the other          of bison origin (Figure 7). Local Promontory bison
Promontory samples (Figure 5). In contrast to         diet δ13C estimates from dung, hair, hide, and bone
the abundant evidence that local Promontory           collagen are in good agreement with one another
bison diets were entirely C3, the FS-305 ankle        and with the predicted values for the Promontory
wrap has a δ13C value that indicates the animal       region (Table 2; Figure 7). The nearest areas on
consumed a large amount of C4 (and/or CAM)            the grass isoscape with mean δ13C values similar
plants. A linear %C4 estimate can provide a           to that of the FS-305 bison are about 500 km to
general approximation of the relative amount          the south, in southwestern Utah / northwestern Ari-
of C4 versus C3 plants that would have had to         zona, and about 700 km east, around Franktown
have been consumed to produce a particular            Cave in Colorado. We cannot exclude the possibil-
δ13C value. If we assume a pure C3 dietary end-       ity that closer locations might include microhabi-
point of −24.3‰ (the mean derived from typ-           tats with high C4, particularly during the summer
ical Promontory bison values obtained in this         when C4 grasses flourish. It is clear from our base-
study) and a pure C4/CAM endpoint of                  line isotopic data, however, that if such areas
−10.3‰ (the mean of ancient Colorado Plateau          existed near the caves, local Promontory bison
CAM plants, which overlap with C4 plants;             did not utilize them.
Metcalfe and Mead 2019), the FS-305 diet                  To determine whether a bison could feasibly
value of −17.4‰ suggests a C4/CAM contribu-           have traveled under its own power from one of
tion of approximately 50%. For roughly 50%            these faraway locations to Promontory while
C4/CAM to be recorded in a relatively slow-           retaining a strong C4 signal in its hide, we con-
forming tissue such as skin, the C4 and/or            sider the distance traveled (estimated using a
CAM plants must have comprised a significant           least-cost path approach), the isotopic turnover
proportion of the diet for several weeks to months.   rate of skin (because continuous replacement
Yet, there is no unequivocal evidence for C4 or       would gradually “dilute” the C4 signal as an
CAM plant consumption in any other Promontory         animal switched its diet during the journey),
bison tissue, even those that formed over short       and the feasibility of traveling the required dis-
timescales and would therefore record brief tem-      tance in the required time (based on modern
porary changes in diet. We conclude that the          bison observational studies). Supplemental Text
FS-305 sample came from a bison that was not          2 provides details of these inferences. We con-
native to the Promontory region.                      clude that it may have been physically possible
Metcalfe et al.              ISOTOPIC EVIDENCE FOR LONG‐DISTANCE CONNECTIONS                                      539

Figure 5. Comparison of diet δ13C values calculated from measured tissue values of Promontory-era bison recovered
from Promontory and Franktown caves, and modern bison from Antelope Island. Tissue δ13C values were converted
to diet δ13C values using the equations provided in the text. Modern Antelope Island δ13C values were further adjusted
by 2.1‰ to account for the Suess Effect. Filled symbols are samples from Franktown Cave. Open symbols are samples
from northern Utah (Promontory or Antelope Island). Triangles indicate values derived from hide; crosses, from dung;
circles, from hair; and diamonds, from bone.

for a bison to travel those distances in the                However, based on the ready availability of
required amount of time, but it would have                  local bison to Promontory people, we believe
been highly unlikely—particularly because gen-              that trade in bison products was very unlikely.
etic analyses indicates that the leather was from a         In a less than 3 m2 area of Cave 1, more than
female bison, which would typically travel with             30,000 whole and fragmentary bones were
calves (Supplemental Texts 1 and 2). Altogether,            recovered. These are completely dominated by
it is unlikely that the FS-305 ankle wrap came              large game animals, with bison the most com-
from a wandering bison.                                     mon genus for identifiable specimens (Ives,
                                                            Johansson, et al. 2014; Johansson 2013). The
Procurement of Hide via Trade?                              presence of large, difficult-to-transport skulls
If the FS-305 ankle wrap leather was not from a             and low-utility lower limbs and hooves suggest
local bison or a bison wanderer, then it must               that a kill site was nearby. Indeed, the landscape
have been procured in a faraway location and                above the caves funnels prey into a narrow area
transported to Promontory Cave 1. It is possible            that is ideal for ambush strategies and remains
that the FS-305 ankle wrap leather was obtained             an active game trail today. Furthermore, Prom-
through trade. In this scenario, the Promontory             ontory Cave 1 occupants were not heavily com-
people would have obtained the leather from                 minuting bones to extract greases as they would
other individuals or groups who had been in a               if food were scarce. Strata consisting of charred
location far to the south or east (or who had               and calcined bone burned at variable tempera-
traded for bison leather from these areas).                 tures suggest that greases and fats were present
540 AMERICAN ANTIQUITY Vol. 86, No. 3, 2021
Figure 6. Diet δ13C values (calculated from measured hair values, as described in the text) of 11 individual Promontory
bison hairs that were serially sampled to examine changes over time. Diet δ13C values less than −21.4‰ are within the
range of purely C3 diets, as described in the text.
and served as accelerants for a fire rather than of transportation, including a long-distance
being extracted for food (Ives, Johansson, round trip, a meeting with individuals from distant
et al. 2014). Based on the number of discarded regions at an intermediate location, or a visit from
moccasins in the caves, Reilly (2015) estimated outsiders who left behind the hide or leather.
that about 250 bison hides would have been It is not possible to pinpoint a precise loca-
required to replace them. In combination with tion of origin for the FS-305 ankle wrap leather
the skeletal evidence, this suggests that the because its δ13C value of −17.4‰ is character-
minimum number of bison individuals (MNI) istic of a vast region from South Dakota through
for the entire cave contents would be huge. Nebraska, eastern Colorado, southeastern New
Thus, multiple lines of evidence indicate that Mexico, and southern Arizona (Figure 7). We
bison were abundant around the Promontory also cannot exclude the possibility that the
caves and that the Promontory people were bison inhabited a microhabitat with high C4
highly adept at hunting them. It would have some distance from the caves but closer than
been highly unnecessary for Promontory the areas identified in our regional isoscape.
people to trade for bison leather. Although we Based on our current knowledge, however,
cannot completely exclude this possibility, we northwestern Arizona and central Colorado are
consider the explanation in the next section the closest locations to have δ13C values con-
more likely. sistent with that of the FS-305 ankle wrap
(Figure 7).
Procurement of Hide via Long-Distance Travel The northwestern Arizona region with mod-
The final and likeliest possibility to explain how eled δ13C values consistent with the FS-305
the FS-305 ankle wrap leather ended up incorpo- ankle wrap sample is known to have supported
rated into a Promontory Cave 1 moccasin is long- bison during the Late Prehistoric period (Martin
distance travel to/from an area far to the south or et al. 2017). Open-air sites with Promontory
east. Below, we will first explore potential areas material culture associations dating approxi-
of origin and then discuss possible mechanisms mately 100–200 years later than the PromontoryMetcalfe et al. ISOTOPIC EVIDENCE FOR LONG‐DISTANCE CONNECTIONS 541
Figure 7. Modeled mean δ13C values of Late Prehistoric grasses based on previous studies of bison and mammoth δ13C
and nine climatic variables, including growing season precipitation and temperature (adapted from Cotton et al. 2016).
Areas in white have few grasses of any type and are therefore not included in the model. Stars indicate the locations of
the Promontory caves and Franktown Cave. Circles indicate other locations with Promontory-style moccasins, as
described in the text.
Table 2. Carbon Isotope Compositions (means ± one standard deviation) of Promontory Caves and Antelope Island State Park
Bison Tissues.
Location Tissue N δ13Ctissue δ13Cdiet Δ13Ct-da Δ13CSuessb
Promontory Bone collagen 12 −19.4 ± 0.7 −24.4 ± 0.7 −5.0 0.0
Promontory Hairc 33 −21.4 ± 0.5 −24.4 ± 0.5 −3.0 0.0
Promontory Hided 18 −19.7 ± 0.5 −24.2 ± 0.5 −4.5 0.0
Promontory Dung 17 −25.2 ± 1.2 −24.2 ± 1.2 +1.0 0.0
Antelope Island Hair 8 −23.3 ± 0.1 −24.2 ± 0.1 −3.0 +2.1
Antelope Island Dung 6 −28.2 ± 1.2 −25.1 ± 1.2 +1.0 +2.1
a
Carbon isotope offset used to convert tissue to diet values, as described in the text.
b
Modern (Antelope Island) diet values were converted to preindustrial equivalents by adding +2.1‰, as described in the text.
c
Serially sampled hair results were averaged to produce a single value for each individual hair before being included here.
d
Includes only data obtained in the present study, using a 2-point calibration suitable for paleodiet reconstruction, as described
in the text.542 AMERICAN ANTIQUITY Vol. 86, No. 3, 2021
cave deposits occur on the eastern shore of Great It is significant that the only extralocal leather
Salt Lake and Utah Lake (Janetski and Smith identified to date in the Promontory caves was
2007), along the least-cost path route to this used to construct a moccasin ankle wrap. Unlike
part of northwestern Arizona (Supplemental moccasin bodies—which quickly become worn,
Text 2). With the cessation of Fremont maize patched, further worn, and discarded—ankle
agriculture around AD 1150 (Coltrain and wraps can be reused and recycled into new foot-
Leavitt 2002), travel along the Wasatch Front wear. Within the Promontory caves assemblage,
and into northwestern Arizona during the late the great majority of moccasins are heavily worn,
thirteenth century may have been relatively patched, or both. Cuts that indicate the severing
easy. Given that later Promontory Phase assem- of ankle wraps from the moccasin body are com-
blages are situated in geographically intermedi- mon (Figure 3b–d). Repurposing of leather also
ate areas, it would not be surprising if late occurred at Franktown Cave, where three
thirteenth-century Promontory cave occupants fringed-seam artifacts dating to the Promontory
had connections with regions as far south as nor- occupation had been cut from larger leather
thern Arizona. We note that Promontory-style objects (Gilmore et al. 2021). Although some
moccasins have recently been identified near leather scraps occur in both the Promontory
Mesa Verde (Figure 1), supporting the idea of a and Franktown caves, their occupants were fru-
connection with the Southwest (Fewkes 1909; gal, generally discarding only worn-out mocca-
Osborne 2004; Yanicki and Ives 2017). sin bodies and bison robe edges. Given its
Alternatively, the isoscape model and Frank- longer use life and potential for reuse, an ankle
town Cave bison δ13C values are consistent wrap is the one portion of a moccasin most likely
with a potential origin for the FS-305 ankle to survive a long-distance journey, precisely
wrap leather in central Colorado. Franktown because it could be usefully reincorporated into
bison hide and hair samples had highly variable new footwear.
δ13C values, ranging from purely C3 to purely C4 Historic sources show that it was essential to
(Figure 5). The much larger variability in bison carry and repair additional moccasins during a
δ13C at Franktown compared to Promontory lengthy journey. The distances to origin docu-
reflects the site’s location in an area that rapidly mented here would require wearing and replacing
transitions from C3- to C4-dominated grassland several pairs of moccasins, which were common
(Figures 5 and 7)—that is, all of the Franktown discards in abandoned camps (e.g., Ewers
bison could have been procured relatively close 1955:182, 184; Moulton 1987:216, 219; Wilson
to Franktown Cave, with higher values among 1924:212, 232, 283–284). We consider it plaus-
bison who had grazed in areas further east and/ ible that the leather was obtained at a distant
or were killed after the summer months. The source and recycled in a series of usages as an
Promontory Cave FS-305 moccasin leather may ankle wrap over the course of the journey to
therefore be evidence of contact between north- the Promontory caves. It is also possible that
ern Utah and central Colorado. The assemblage the FS-305 ankle wrap leather was brought to
similarities between the Promontory and Frank- the caves as a piece of clothing, bison robe, or
town caves support the possibility of contact in lodge covering that was repurposed (although
various forms: travel between the two locations, the larger the original object, the greater the pos-
a rendezvous at a geographically intermediate sibility of detecting other anomalous values,
location, or a rendezvous with yet another popu- which we have not). As discussed above, how-
lation that shared this material culture heritage. ever, obtaining such items from other groups or
We note that Promontory-style moccasins are individuals would have been like carrying coals
also present in Daugherty Cave (48WA302) to Newcastle.2 The Promontory cave occupants
and Ross Rockshelter (48NA331) in Wyoming, had access to a genuine abundance of bison prod-
which are intermediate in longitude (although ucts, including fine leather, and they would have
at higher latitudes) relative to Promontory and had no need to acquire it from others while resid-
Franktown (Figures 1 and 7; Frison 1968; Gar- ing in the caves. It therefore seems unlikely that a
ling 1964).1 visitor to the caves would leave behind leatherMetcalfe et al. ISOTOPIC EVIDENCE FOR LONG‐DISTANCE CONNECTIONS 543
that would later become incorporated into a Implications for Promontory Lifeways
Promontory moccasin. Instead, it seems more For hunter-gatherer groups, Seymour (2012:378)
likely that the leather was obtained at some dis- recommends reserving the term “migration” to
tance from the caves and reincorporated into describe movement to a new region that was
the moccasin during travel. This implies that not previously utilized, and “mobility” to
Promontory people had either traveled to one describe movements within regularly used terri-
of these faraway locations themselves or met tories. Given the fact that only one Promontory
with others at an intermediate location where caves specimen has been discovered with a C4
the leather changed hands. Either way, the isotopic signal, it is unlikely that regular Prom-
ankle wrap came from far away and was not ontory mobility encompassed regions with
obtained in the vicinity of the caves, which abundant C4 grasses. Several lines of evidence
implies long-distance connections and knowl- support geographically widespread interactions,
edge of faraway locations. however, and the isotopic evidence suggests
Independent Evidence for Long-Distance that at least one long-distance voyage was likely
Connections of Promontory Caves Inhabitants made. Anthony (1990) has identified categories
of long-distance activities associated with
Although the ankle wrap δ13C value is a unique migration that may have detectable material
piece of evidence for human movement, it is far correlates: scouting (to facilitate long-distance
from the only evidence for long-distance con- “leapfrog” migrations), return visits to a previ-
nections of Promontory people. In addition to ous occupation, long-distance movements for
the Promontory material culture evidence at seasonal or task-specific purposes, stream
Franktown Cave and Promontory’s northern migration (movement of successive groups
artifact associations, gaming and obsidian along a well-defined route), and counter-
source studies also provide support for long- streaming (returning to a former occupation
distance interactions. The Promontory caves after migrating away). If Promontory people
inhabitants were familiar with a diversity of had traveled to a faraway location, long-distance
games whose distributions span much of west- scouting seems the most plausible purpose for
ern North America, suggesting a wide range such a voyage. Establishing familiarity with dis-
of social interactions and possibly long- tant regions would be an essential strategy for
distance movements (Yanicki and Ives 2017). highly mobile groups infiltrating the changing
X-ray fluorescence indicates that the majority thirteenth-century social landscape of the
of obsidian artifacts recovered from Promon- American Southwest and central/southern
tory Caves 1 and 2 were constructed from Plains. Scouting for new economic, trading, or
Malad obsidian sourced in southern Idaho raiding opportunities could have served as a pre-
(Hughes 2011, 2012). Around the time of the cursor to a shift in regularly used territories,
Promontory and Franktown cave occupations, equipping the Promontory people with broad
material from Malad and other northern obsidian landscape knowledge that could be mobilized
sources increased by an order of magnitude to facilitate migration (Seymour 2012). The lat-
on the central and southern Plains (Gilmore, ter seems to have occurred at the end of the
Hedlund, and Clark 2017; Hoard et al. 2008; thirteenth century, when Promontory people
Hughes et al. 2019). Promontory groups may ceased intensive occupation of the Promontory
have been involved in the distribution of Malad caves (Ives, Froese, et al. 2014).
obsidian through direct migration, down-the-line
trade, or trade involving more distant redistributive Conclusions
centers. Whichever alternatives were involved, the
late-period obsidian distribution and gaming evi- Exceptional organic preservation allowed us to
dence support the hypothesis that Promontory establish a uniquely strong isotopic baseline for
Phase communities participated in long-distance bison in the area around the Promontory caves
interaction spheres from north of Utah far to the during the late thirteenth century. Analysis of
south and east. 171 bison samples (dung, hair, hide, bone) thatYou can also read