Is it worth the effort? Understanding and contextualizing physical metrics in soccer
←
→
Page content transcription
If your browser does not render page correctly, please read the page content below
Is it worth the effort? Understanding and
                                                         contextualizing physical metrics in soccer
                                                           Sergio Llana1 , Borja Burriel1 , Pau Madrero1 , and Javier Fernández2
                                                                               1 Barça   Innovation Hub, 2 Zelus Analytics

                                          1.    Introduction
                                          Physical match performance is one of the most studied topics in Sports Science since EPTS devices became a trend
                                          in soccer. Despite the vast number of publications, most research has focused on assessing player performance
                                          based on isolated metrics such as distance covered, accelerations, or high-intensity runs (HI) (Bradley et al. 2013;
                                          Altmann et al. 2021; Ingebrigtsen et al. 2015). In addition, the tactical context tends to be widely simplified and
                                          often ignored. For sports scientists and soccer practitioners, the idea that the integration of tactical and qualitative
                                          information can be very beneficial to develop a much more in-depth analysis of physical demands does not go
arXiv:2204.02313v1 [stat.ML] 5 Apr 2022

                                          unnoticed. However, the lack of spatiotemporal data that allows analyzing individual effort within the collective
                                          context has been an enormous barrier for developing this integration between the physical and the tactical. Far on
                                          the horizon remains the old question: is it about running more or running better?
                                          While event and tracking data have accelerated soccer analytics development in recent years, we still lack a
                                          comprehensive framework for understanding how physical abilities impact global performance. There are still
                                          many unanswered questions: How do player roles affect the type of runs players do? Can we find similar players
                                          based on their movements between lines? Can we assess whether a high- intensity disruptive run provides goal
                                          value? What types of runs and movements can we expect from our next opponent, and what would its impact be?
                                          Can we select a starting eleven that maximizes value creation in specific spaces?
                                          Having a comprehensive approach for addressing these and many other related questions would expand the capa-
                                          bilities of soccer analytics to help the primary decision-makers in football clubs. Some examples are:
                                               1. The head of recruitment would find players with great physical capacity and contribute to value creation,
                                                  both on-ball, and off-ball.
                                               2. The head coach and technical directors would assess players’ versatility based on their movements and
                                                  tactical fit to either design tactics or track players’ evolution in time.
                                               3. The medical department would better understand fatigue by associating lower physical deployment and
                                                  contribution to value creation.
                                               4. Physical coaches could better customize training sessions and design tailored routines for players’ readap-
                                                  tation and return-to-play by classifying players’ movements and identifying those with higher intensity.
                                          We present the first framework that gives a deep insight into the link between physical and technical-tactical
                                          aspects of soccer. Furthermore, it allows associating physical performance with value generation thanks to a top-
                                          down approach:
                                               1. We start with a high-level view by identifying differences in physical performance between attack and
                                                  defense phases, both from a collective and individual perspective.
                                               2. Secondly, we contextualize physical indicators employing spatiotemporal features derived from the inter-
                                                  action of the 22 players and the ball. Specifically, we integrate tactical concepts such as dynamic team
                                                  formations, player roles, attack types, and defense types.
                                               3. Finally, we employ a state-of-the-art expected possession-value model to associate runs with value creation
                                                  and its impact on the overall likelihood of winning more matches.
                                          This work is structured into two main parts. First, we present the technical details of how we developed the
                                          different layers of our top-down approach. Here, we employ an unprecedented data set of tracking data from
                                          broadcast, which allows us to assess and compare various teams and players from the main European leagues.
                                          Then, in the second part of the work, we present a broad set of practical applications showing new approaches for
                                          understanding players and team performance comprehensively.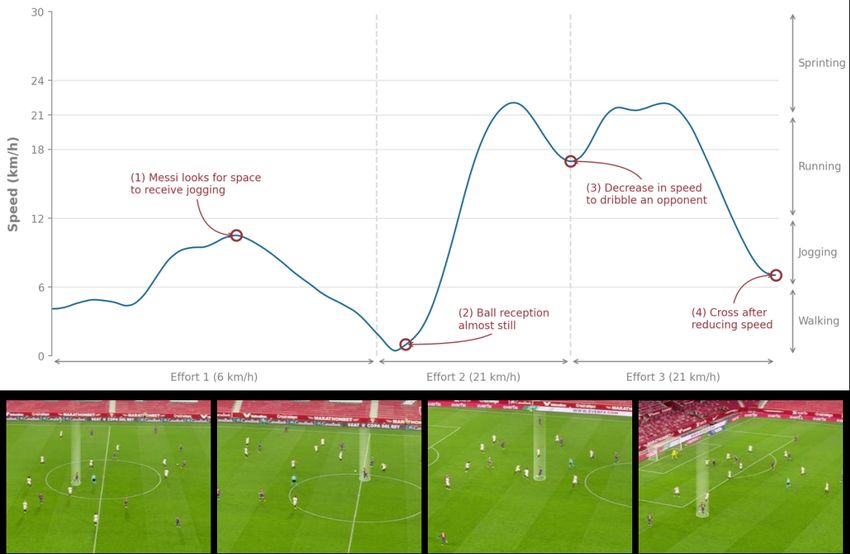
2. Estimating physical metrics from tracking data
In this work, we count on the availability of TV broadcast tracking data, including near 70% of the 2020/2021 sea-
son’s matches from the Big-5 European competitions: the English, Spanish, German, Italian, and French domestic
leagues. This novel source of spatiotemporal data provides the location of the 22 players and the ball ten times per
second. The availability of this comprehensive data set of tracking data is unprecedented. While EPTS-derived
physical metrics might be considered more precise since physical signals are captured directly from devices at-
tached to players’ bodies, usually, this information is limited to the 11 players belonging to the team that owns the
devices.
To obtain a speed signal, we calculate the player’s velocity in two consecutive frames and calculate the magnitude
at the frame level. Then, we apply a rolling average smoothing to remove the fine-grained variation between
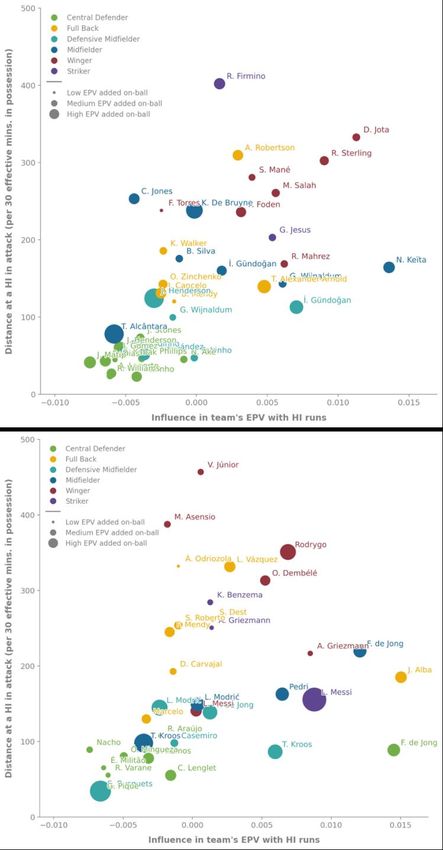
frames. In addition, we detect and treat outliers in players’ speed. Figure 1 illustrates the frame-by-frame evolution
of Messi’s speed before and during an on-ball action (link to the video: https://bit.ly/3qYOgC6).
We detect intervals from the speed signal where a player maintains the speed in the same range, similar to those
proposed by Pons et al. (2019). A speed interval is defined as a valley when both the preceding and following
periods are of a higher speed. The full speed signal is then divided into sections from each valley until the following
one. Each section represents a player’s run, and its speed is the maximum speed reached at the peak between these
two valleys. For example, in Figure 1, Messi’s movement is divided into three different efforts, with peaks of 6,
21, and 21 km/h, respectively.
Fig. 1. Above, the evolution of Messi’s speed in a game situation. The first highlighted moment
represents a movement to approach (1) the ball. Then, the action is formed on (2) the pass reception,
(3) a ball drive with a dribble, and (4) a cross. Below, the video frames of the four highlighted
instants.
We compute three different metrics to define the physical performance. The most obvious is the distance covered
by a player, calculated by adding up each run’s distance. Then, we define high-intensity (HI) runs as those exceed-
ing 21 km/h (Castellano et al. 2011; Ade et al. 2016). Given this definition, we are interested in computing the
number of runs and the distance covered at a high intensity.
There are three key moments in a player’s run used to add the contextual information described in the following
section.
1. The instant when the valley ends. It is used to set the origin location of the run as the player starts to
accelerate and increase in speed.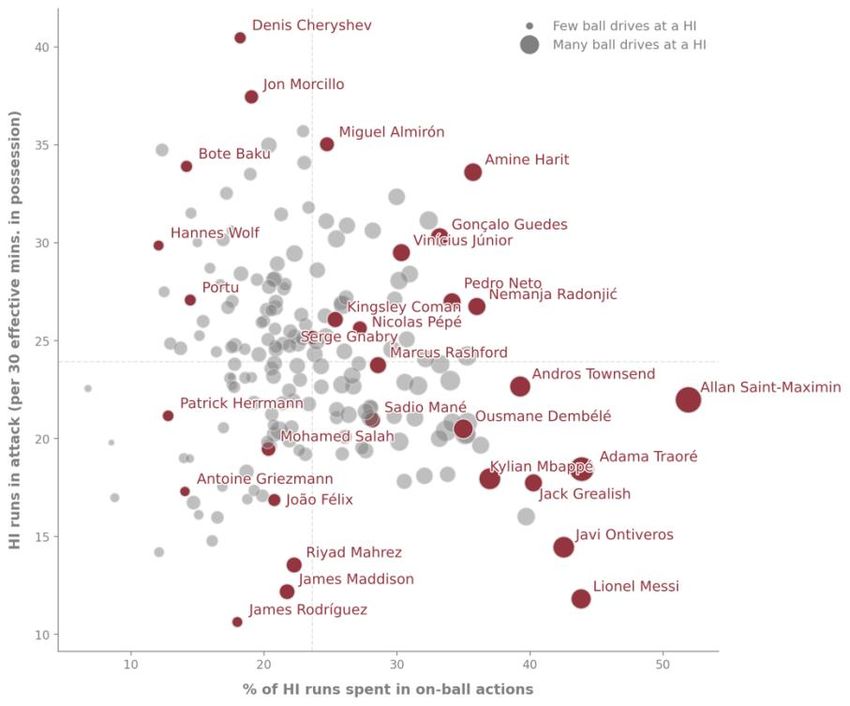
2. The instant when the peak of the run starts. It is the moment used to know if the run is performed within an
        attack or defense and its derived categories (attack type, defense type, etcetera). It is the moment when the
        player starts to get to the maximum speed of the run.
     3. The instant when the peak of the run ends. It is used to set the destination location of the run as the player
        starts to decelerate.

3.     A framework for physical performance contextualization
Soccer is a complex sport and, just as we cannot analyze the parts of a complex system separately, we need to
bring together the technical and tactical aspects of the sport with the physical performance. There have been other
attempts to integrate these three dimensions of the game in the Sports Science literature, being the approach by
Bradley and Ade (2018) the most comprehensive so far.
They associate each player’s effort with a tactical concept manually tagged from the video. However, their inte-
grated approach does not consider the team’s style, the opponent’s block, or the value-added with those efforts,
which are essential to contextualizing the physical metrics better.
We have worked on a scalable and automatic way to overcome these issues, which detects contextual tactical
concepts by integrating the broadcast tracking data from SkillCorner with StatsBomb’s event data. For this paper,
we are working with a novel dataset that allows us to have a wide variety of matches from the 2020/2021 season of
the Big-5 European competitions (English Premier League, Spanish La Liga, German Bundesliga, French Ligue
1, and Italian Serie A).

               Fig. 2. The different layers of contextualization of the proposed top-down framework.

The top-down framework we propose has different levels of analysis, starting with the physical performance
metrics estimated from tracking data with the process described in Chapter 2. Figure 2 shows the layers of con-
textualization that will be described in the following sections.

3.1.    Dynamic lines and team’s block
While the absolute location of high-intensity efforts provides a good piece of information on players’ movement
patterns, contextualizing these efforts according to the opponent’s defending block adds a whole new level of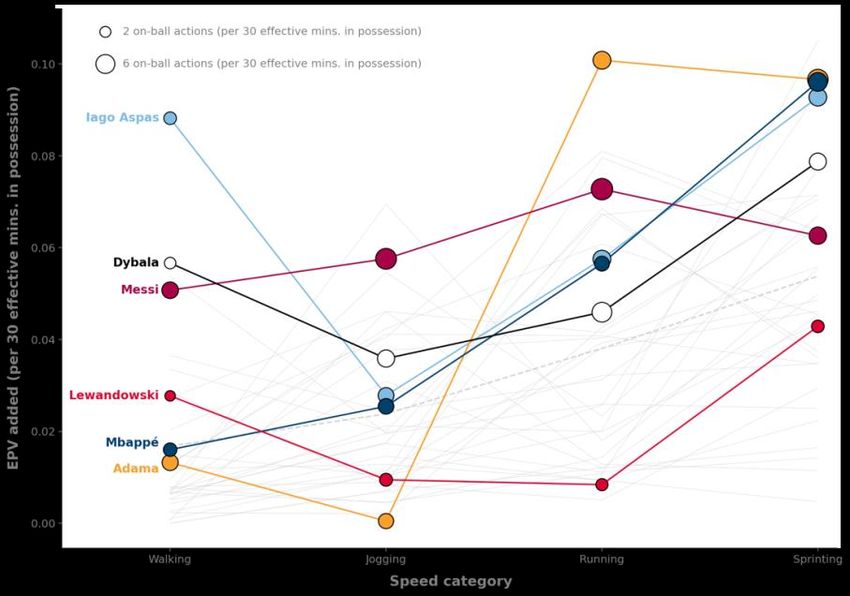
tactical insights. Therefore, we integrate the concept of dynamic formation lines introduced by Fernández et al.
(2021) to calculate these relative locations.
Representing the defensive structure to compute the relative locations of the events is difficult due to its variability
and complexity. However, we assume that players always form three lines, as shown in Figure 3. The centroids of
a clustering performed on the defenders’ X coordinate model the dynamic lines from tracking.

         Fig. 3. Diagram of the dynamic defensive lines (red dashed lines) and the convex hull representing
         the defensive team’s block (blue shaded area).

In addition to the dynamic lines, we compute the convex hull of the defender’s X and Y coordinates to model the
team’s block. It helps us distinguish those actions inside the block from those in the flanks. Note that goalkeepers
are always ignored to model these two tactical concepts.
To give tactical meaning to each high-intensity run, we have defined three different zones:
   1. Inside: Within the opponent’s block and between defensive lines.
   2. Wing: Both left and right flanks outside the block but within defensive lines.
   3. Back: Everything that is behind the last defensive line.
By combining these relative zones with the runs’ origin and destination relative locations, we have defined the
types of movements plotted in Figure 4. Note that we have filtered some of the combinations that are not used
in the applications of this paper. These categories of HI runs will help us define player profiles, as shown in the
second application in Chapter 4. For example, movements inside-to-back or wing-to-back are common traits of
deep wingers and strikers.

         Fig. 4. Diagram of the types of movements relative to the opponent’s block. On the left, those starting
         from the flank of the block, whereas, on the right, the ones that begin inside the opponent’s block.

3.2.   Possessions, attack types, and defense types
Players’ responsibilities vary considerably according to who has the ball. The different demands between attacking
and defending phases also affect the physical efforts the player has to perform, as studied by Lorenzo-Martı́nez et
al. (2021). Therefore, identifying which team is in possession when a particular run is performed will help add a
layer of basic but essential information to contextualize it.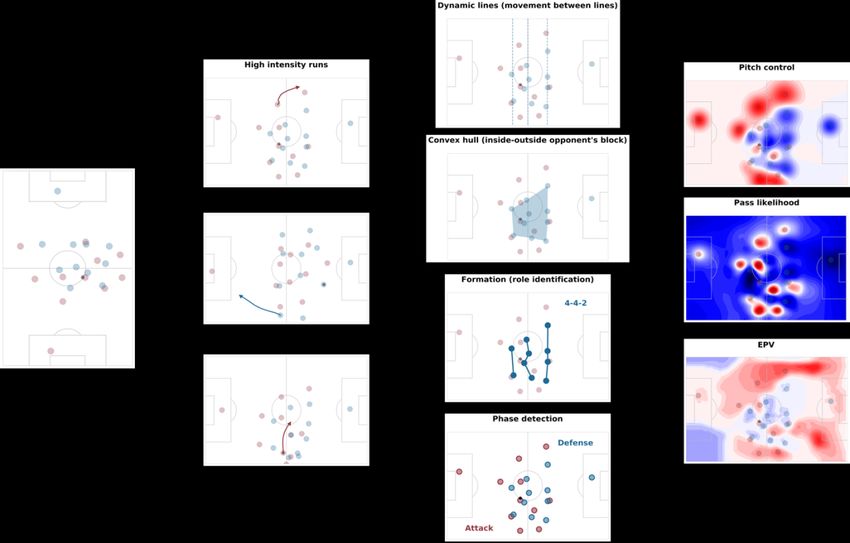
Possessions are detected following a rule-based approach. Three possibilities can cause a possession change: (1)
the ball goes out, (2) the referee stops the game, or (3) in-game possession changes, which are fuzzier, and we
should take into account those times teams lose the ball and regain it instantly. On the other hand, we apply
rule-based algorithms based on player locations, teams’ defensive lines, and events at each possession’s frame to
determine the attack and defense types. We developed and validated these algorithms in coordination with coaches
from FC Barcelona to be as close as possible to the way they interpret these tactical concepts.
We identify four possible attack types:
   1. Organized attack: both teams are well-structured with no drastic block movements.
   2. Direct play: the segment of the possession after a long vertical pass from the back of the attacking team.
   3. Counter-attack: the segment of the possession when both teams travel from one half of the pitch to the other
      one after a ball recovery.
   4. Set-piece: seconds after a set-piece in the opponent’s half of the pitch.
The defense types are categorized based on the height of the opponent’s block:
   1. High pressure: The block is almost entirely located in the attacking team’s half of the pitch, with at least N
      players in the last third of the pitch.
   2. Medium block: The block is distributed in both halves.
   3. Low block: The block is entirely on the defending team’s half of the pitch.
By automatically detecting these concepts, we can easily define the moment in which a player’s run occurs related
to the possession of the ball. This way, we can distinguish which runs were performed within an attack, a defense,
or out of play (e.g., a central defender comes back from a corner to be ready for the opponent’s goal kick.). Finally,
we set the attack and defense types regarding the team in possession and the defending team.

3.3.   Dynamic team formations and player roles
The position or role played within a team substantially impacts the kind of efforts a soccer player will perform
during a match (Lorenzo-Martinez et al. 2021). Figure 5 confirms these variations with the distribution of the
distance covered at a high intensity per player role when teams were in and out of possession. Note that the
differences are especially noticeable when the team is attacking.

         Fig. 5. Distribution of meters covered at high intensity in attack and defense by each player roles,
         normalized per 30 minutes of effective playing time in possession (left) and out of possession (right).

To identify player roles within a match, we first need to know their team’s formation. In addition, this information
also impacts players’ physical performance, as Bradley et al. (2011) studied. We followed an approach similar to
the one presented by Shaw and Glickman (2019), which can be summarized in the following steps: (1) we compute
player’s mean location relative to their teammates to assemble a formation, then (2) we apply an assignment
optimization algorithm between a set of templates that represent the most commonly used systems and the previous
players’ mean relative locations. Finally, (3) we assign the formation’s positions to each involved player.
In addition, some roles are equivalent among different tactical systems (e.g., a left full-back in a 4-4-2, 4-3-3,
and 4-2-3-1), so we choose to simplify them. First, discarding the wing-specific part of the role (e.g., merging
left/right-wingers) and then combining similar roles (e.g., full-backs and wing-backs).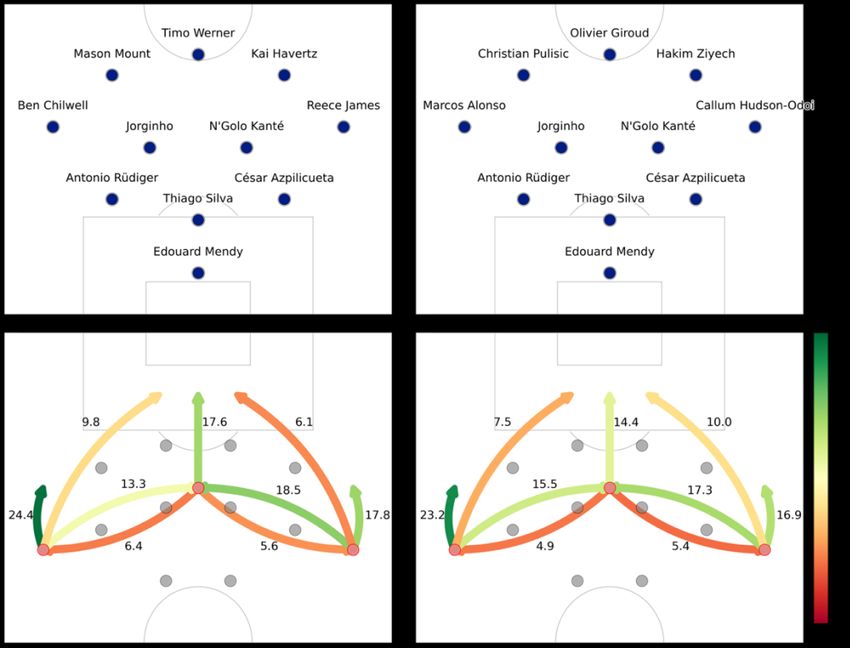
The resulting player roles are central defenders, full backs, defensive midfielders, midfielders, wingers, and strik-
ers. Note that while these roles correspond to the standard set of positions in soccer, these are calculated for every
second in the match, allowing for match-related variations rather than relying on global and hand-label positions.

3.4.   Linking with Expected Possession Value
In the latest years, the estimation of player’s actions value has become a trend in soccer analytics research. It
is a new dimension that allows turning descriptive analysis into prescriptive by providing qualitative insights to
practitioners. In the same way that we estimate the value added by a player’s passes, we would like to know which
players are running better, adding more value to their team’s possessions with their off-ball runs.
There are different approaches in the literature to estimate the long-term probability that a possession ends in a
goal. We can categorize them into (1) action-value and (2) possession-value models, depending on how they define
the state of the possession. Models such as the ones described by Decross et al. (2020) or the OBV by StatsBomb
(2021) are examples of the former, and they use spatiotemporal features to predict the value added by on-ball
actions. On the other hand, possession-value models like the ones presented by Rudd (2011), Singh (2019), or
Fernández et al. (2019) provide a representation of the game state and estimate the expected value at the end of the
possession by integrating over all the possible paths the possession can take from that state. In this work, we use
Fernandez et al. (2021) EPV framework, which is built on top of tracking data and considers the impact of both
observed and potential actions, providing a rich source of information to assess players’ off-ball contribution.
Employing the Expected Possession Value framework, we want to understand the players’ runs impact in creating
value. In particular, we want to associate the EPV gain between the beginning and end of each HI run to measure
the increase in the team’s goal probability after the player’s effort. The EPV of the attacking team is set at two
different moments: (I) when the player starts to increase the speed (the starting valley of the effort ends) and (II)
two seconds after the peak of the effort ends. After each high-intensity run ends, we compute the value added to
the team’s possession with these two values.
We then perform an ordinary least-squares linear regression to obtain the influence of each player’s HI runs on
their team’s EPV increase as shown in equation (1),

                           EPVadded ∼ β0 + β1 ∗ angle + β2 ∗ distance + ∑ β p ∗ E p                               (1)
                                                                           p

where angle and distance are computed respectively to the opponent’s goal from the initial location of the run. E p
represents the player making the high-intensity run. Note that we are considering the player’s role per match so
that the same player with two different roles will have different coefficients per role.
With this modeling approach, we are essentially estimating a player’s average contribution to the possession value
when he performs a high-intensity run while controlling for the angle and distance effects.

3.5.   Aggregation and normalization
Finally, to create a player and a team profile, we need to aggregate per-match metrics for a defined period of
time, which is the 2020/2021 season in our case. The most common way of normalization is per match (I.e., 90
minutes), but the truth is that some games have a higher ball-in-play (also known as effective) time than others,
with differences of even 20 minutes in total. Therefore, to avoid biasing the results and favoring teams with
matches with higher effective time, we choose to do the following normalization:
   1. Those metrics that do refer to a specific possession phase will be normalized per 60 effective minutes, very
      close to the mean of ball-in-play per match.
   2. Metrics referring to events and actions that happen either in attack or in defense will be normalized per 30
      minutes of effective time in and out of possession, respectively. Note that for the following applications, we
      are filtering those players who did not play a minimum of 450 minutes, so that we remove potential outliers
      due to the lack of minutes.
Note that for the following applications, we are filtering those players who did not play a minimum of 450 minutes,
so that we remove potential outliers due to the lack of minutes.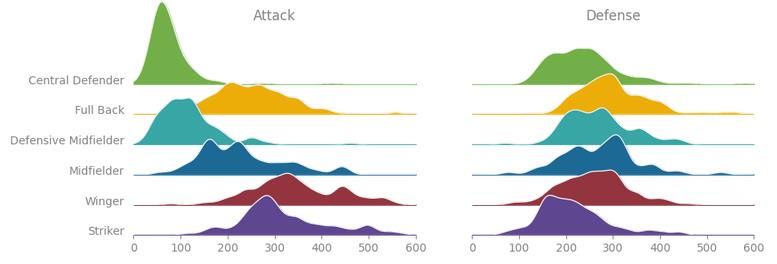
4.     Applications
Supported by this framework, we now focus on answering a series of commonly asked questions that will serve
as practical applications to analyze players’ and team behaviors.

4.1.    The higher the percentage of possession, the less we run?
Pep Guardiola once said: ”Without the ball you have to run, but with the ball you have to stay in position and let
the ball run.”. While coaches often refer to concepts related to running, not all the metrics are interpreted the same
way. Some might refer to the total distance traveled, while others might emphasize the more demanding efforts.
So, to give a more practical sense to this analysis we will split the initial question into two different questions:
     1. When comparing in and out of possession phases, do teams travel more distance in total?
     2. Do teams travel longer distances in attack phases at a high intensity than in defense phases? And does this
        vary according to the possession percentage?
To answer the first question, we need to control for the effect of the possession percentage. Note that if we sum
the total distance covered of a team with higher ball possession, they will look like they run longer in attack
because they spend more time in this game phase. Therefore, we decide to normalize these metrics per 30 minutes
of effective playing time in and out of possession, respectively. Figure 6 shows the distribution of the distance
covered by teams in attack and defense phases, normalized as explained before, and we observe that teams tend to
run more when out of possession, confirming Guardiola’s idea.
In addition, we also show that the distribution of the distance covered at a high intensity follows the same trend.
From now on, we limit our analysis to evaluating performance in high-intensity running since it allows us to
differentiate the players’ behaviors more clearly, as they are less confused with insignificant movements. At the
same time, the FC Barcelona coaches who contributed to this study consider that high-intensity runs represent the
moments of maximum effort and are the most significant for understanding the player’s physical capacity.

           Fig. 6. Distribution of the distance covered in attack and defense, both in total (on the left) and at a
           high intensity (on the right). All the metrics are normalized per 30 minutes of effective playing time.

Regarding the second question, Lorenzo-Martinez et al. (2021) showed that teams with very high possession
percentages run less, both in total and at a high intensity. In our case, we want to evaluate these differences further
and isolate them between the attack and defense phases, understanding how team style affects.
Figure 7 shows the teams’ normalized distances covered at a high intensity in and out of possession from various
European competitions in the 2020/2021 season. The red line separates the teams that run more in defense (above
the line) from those that run more when attacking. If we focus on the size of the circles, which represents the mean
percentage of possession, we can interpret that teams with a higher ball possession percentage tend to travel more
distance at high intensity per minute in defense than in attack.
But is there more correlation between physical and tactical variables? We have carried out a principal compo-
nent analysis (PCA) to assess the relationships between tactical and physical indicators in teams’ style. Figure 8
presents a biplot comparing the teams from the English, German and Spanish leagues in the 2020/2021 season,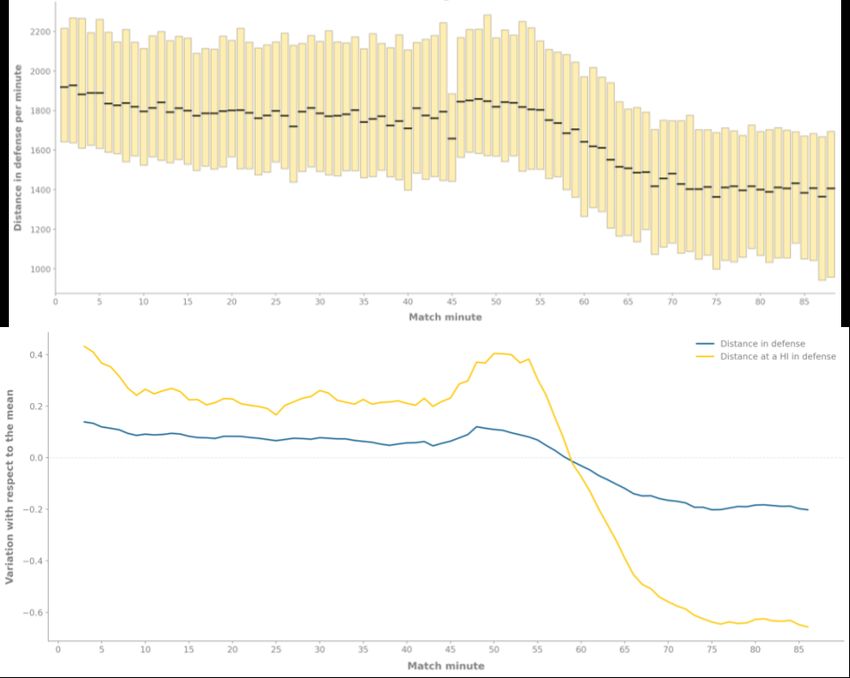
according to the two principal components, which explain 87.4% of the total variance. The circle´s color represent
the Expected Goals (xG) differential of each team in the mentioned season (accounting exclusively for the games
available in the dataset). Note that the translation between team acronyms and the full names can be found in
Appendix 1.

         Fig. 7. The distance at HI covered in attack (X-axis) and defense (Y-axis) normalized per 30 minutes
         of effective playing time in and out of possession, respectively. The circle’s color represents the
         differential of Expected Goals, whereas the size represents the percentage of ball possession. The
         red line represents the values whose distance at high-intensity is equal in attack and defense.

By analyzing the relationships between variables in the plot, we extract the following conclusions from the teams’
offensive and defensive styles:
   1. As previously mentioned, the possession percentage is significantly negatively correlated (-0.78) with run-
      ning more in defense than in attack.
   2. Teams with more possession have a high tendency to have an associative playing style (i.e., less percentage
      of direct play), avoiding actions with a higher risk of losing the ball.
   3. Similarly, teams with more possession tend to have a defensive style based on high press (correlation of
      0.81), trying to recover the ball as soon as possible.
   4. A higher percentage of direct play, which means more counterattacks, transitions, and long balls, is some-
      what correlated (0.55) with more distance at a HI covered in attacks.
   5. Finally, more tendency to press higher is significantly correlated (0.78) with running more at HI in defense,
      as teams with this characteristic will do shorter but more intense efforts.
The biplot also lets us grasp the similarity between teams regarding the mix of physical and tactical variables that
we have selected. For example, Leeds United shows a striking tendency to run long distances at a high intensity in
attack and defense, and only VfL Wolfsburg and VfB Stuttgart are similar to them. In addition, the English team
tends to press high. Secondly, teams with higher ball possession percentages such as FC Barcelona, Manchester
City, or Bayern Munich are associated with high pressures and low direct play, playing mostly an associative style.
These teams are related to a higher ratio of distance covered at a HI in defense.
Finally, teams like Cadiz, Newcastle, or Werder Bremen are related with low percentage possession, based on
direct play, and they tend to defend retreating in their own half of the pitch. These teams tend to make more high-
intensity efforts in attack. Finally, we can see that the xGoals differential, which we use as a proxy for the team’s
strength, has no apparent correlation with running more; it depends more on the team style.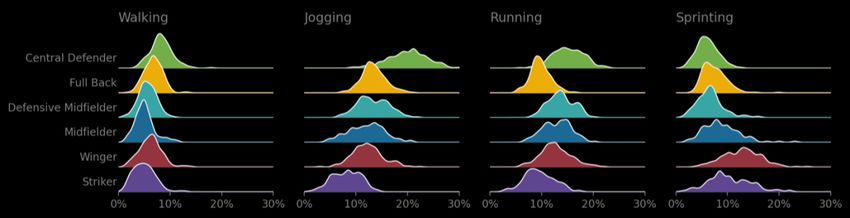
Fig. 8. Biplot of teams in the two first Principal Components of a PCA with a mix of physical metrics
         (HI distance covered) and tactical metrics (team’s style). All metrics are normalized per 30 minutes
         of effective playing time in or out of possession, depending on if they refer to the attack or defense
         phases. The circle’s color represents the team differential of Expected Goals.

4.2.   Do all players run the same way?
When we want to define the characteristics of a player, the first two dimensions we focus on are the technical and
tactical ones. We can approach the former by quantifying the events such as passes, dribbles, drives, or shots and
complement it with qualitative information such as the expected value-added. This type of analysis focuses on
understanding the purpose of the player within the team’s way of playing and other aspects such as the positions
they tend to play or their behaviors in the different phases of play. However, a player’s profile is not complete
without the physical dimension.
Do some players mostly run at a high intensity when interacting with the ball? Does a player tend to do disruptive
runs to open up spaces for other teammates? Such questions remained unanswered to this date. In addition, quan-
tifying the average distance covered by the player or the number of efforts at a high intensity is not enough. For
example, we will find players that distribute the 10 kilometers they run per match differently, and their behaviors
are significantly different with respect to the ball.
Figure 9 demonstrates that players in different roles perform on-ball actions at very different speeds. For example,
Central Defenders tend to do more oDistributions of the percentage of on-ball actions each role tends to do at the
different speed categories.n-ball actions than the rest of the roles at very low speeds (¡ 6km/h, walking) and fewer
actions sprinting. Still, there is a wide spread of Central Defenders jogging as some can double the percentage of
others. On the other hand, more attack-driven roles such as Wingers and Strikers tend to do more actions at very
high speeds (¿ 21 km/h, sprinting), but there is also wide variability in those roles and speed ranges.
However, the proportion of high-intensity efforts spent in on-ball actions is only a proportion of the total HI runs
that a player does in attack phases. Figure 10 shows the differences in some of the English, Spanish, and German
wingers in 2020/2021. Players such as Messi, Grealish, or Mbappé are wingers who save their energy to those
times they have a great chance of getting the ball. In addition, as the circle’s size indicates, players such as Saint-
Maximin and Adama Traoré stand out for carrying the ball at high speed considerably more often than other
players. On the other hand, Cheryshev or Jon Morcillo are players who participate less with the ball but cover
more distance at a HI.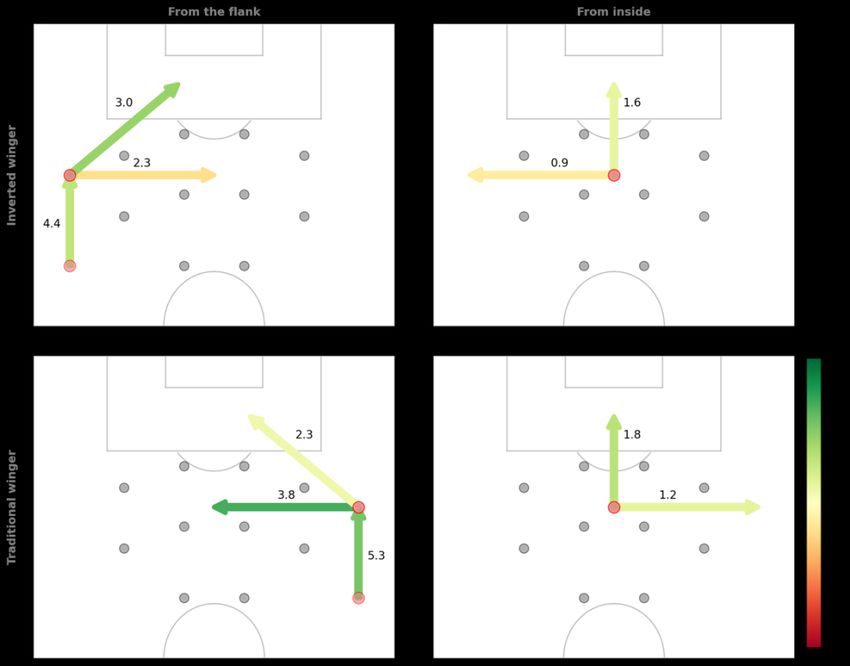
Fig. 9. Distributions of the percentage of on-ball actions each role tends to do at the different speed
         categories.

The following figure also shows that, on average, from 60% to 80% of the winger’s HI efforts in the attack phase
do not involve direct on-ball participation in the possession, highlighting the importance of assessing off-ball
performance in soccer. Unfortunately, this type of off-ball behavior went unnoticed for data-driven analysis of
players until now. With the framework we present in this paper, we can quantify the number of times a player does
the defined types of off-ball movements described in Chapter 4. More importantly, we can say how unique this
number is compared to the other players with the same role in the Big-5 leagues.

         Fig. 10. Percentage of winger’s high-intensity efforts in the attack phase that are performed to par-
         ticipate directly with the ball. The circle’s size represents the exact percentage but driving the ball
         at least 3 seconds. We have the number of HI efforts per 30 minutes of effective playing time in
         possession in the Y-axis.

Figure 11 shows off-ball efforts at a high intensity of Serge Gnabry in Bayern Munich’s matches in the 2020/2021
season. Note that the number along each arrow represents the frequency the player did a specific type of HI run per
30 minutes of effective time in possession of the ball. In addition, the color is relative to how rare that frequency
is compared to the rest of the wingers (with more than 450 minutes played in that role) of the Big-5 European
leagues. The German right-footed player is an all-purpose winger who can play in both the left and right flanks.
Thanks to this kind of off-ball behavior analysis, we can now unravel that he does completely different movements
when he plays in his natural wing, unlike when he did so as an inverted winger playing on the left flank.
The plots on the top of Figure 11 show that when he plays as an inverted winger, he tends to do high-intensity runs
deep behind the back of the defenders (3.0 times per 30 mins of effective time in possession). In contrast, he does
not go inside the opponent’s block that often. On the other hand, in those matches that he played most of the time
as a traditional winger in his natural flank (plots below), he does the opposite behavior with less disruptive runs
to the back and running more to the half-spaces inside the block (3.8 times) or staying in the wing (5.3 times).
Note from the plots on the right that whenever he starts HI efforts from inside the opponent’s block, the behavior
is pretty similar regardless of his position within Bayern Munich’s tactical system.
This kind of information is precious for a scouting department that seeks to identify the type of winger a player
is without watching hours of footage to grasp these insights. And this same pattern is adaptable for the rest of the
player roles, creating player profiles that allow us to understand the most common movements at a high intensity
of a player. This new dimension of analysis complements tactical-technical studies of frequency and value-added
with on-ball actions.
Fig. 11. Serge Gnabry’s frequency of HI runs per match as an inverted winger (above) and a tra-
ditional winger (below). The arrow’s origin and destination represent the initial and end locations
of the effort relative to the opponent’s block. The number is normalized per 30 effective minutes
in possession of the ball. Arrow’s color is relative to the player’s percentile compared to what the
wingers in the Big-5 European leagues.
4.3. Picking up the starting lineup
Following the same path and going a step further, we group the normalized frequencies of off-ball run types in all
team players. This way, we could answer questions like these: Is the next opponent a deep time from the inside
areas, or will their wingers provide most of the depth? Is the opponent symmetric, or do they present different
behaviors from the left and right flanks?
We will focus on the 2020/2021 Champions League’s winner starting lineup as an example. We have aggregated
the frequency of each type of HI runs for all the players that form the 3-4-2-1 used by Chelsea´s coach Thomas
Tuchel on that match. Note that the numbers are the full-season averages per player and not the actual number
of the final. But how would Chelsea have been less deep if Giroud had played as a striker instead of Werner? Do
they keep the same style regardless of the players in the lineup? To answer these questions, we compare the final
match´s lineup with an alternative lineup where we substituted the three forwards and the wing-backs.
Observing the differences in the plots of Figure 12, we can state that Chelsea would maintain its style. However,
there are two noticeable differences in the HI run distribution.
Removing Werner from the lineup would decrease the number of disruptive runs per 30 effective minutes of
possession both from the inside (from 17.6 to 14.4 times) and from the left wing (from 9.8 to 7.5). In fact, inFig. 12. Aggregation of the average frequency of the HI runs of all players in two different lineups
normalized per 30 minutes of effective playing time in possession of the ball.
Havertz’s goal in the UCL’s final, two inside-to-back runs make the goal chance possible, the former by Werner
to drag the central defender and the former by Havertz to face the goalkeeper and score (link to the video of the
goal: https://bit.ly/3FPrRuW). Secondly, the team’s off-ball runs would be more intense from the right flank than
from the left. Maybe because Hudson-Odoi’s tends to look for the defender’s back.
4.4. How fast does our striker have to be to be valuable?
Section 4.2 focused on categorizing the off-ball runs to create offensive profiles of players. But do players get
in touch with the ball at the same speed? And what is more important, do they add equal value at low and high
intensities? Those questions must be answered too to distinguish different types of players within the same role.
Before focusing on the value-added, we must first understand if players depend more on the high-intensity to
receive the ball. We will use a different concept from the standard approach when referring to on-ball actions.
Instead of only considering the start and end of passes, crosses, shots, etcetera, we consider the time window
between a players’ reception of the ball and the last action he performs within that ball control. Following this,
the full extent of Messi’s ball possession shown in Figure 1 would be considered a single action, providing a more
nuanced definition involving ball carries.In that path, Figure 13 shows the percentage of times strikers in the Big-5
European competitions were moving at the different speed categories, 2 seconds before receiving the ball. In the
background, we plot the 90% confidence interval. In addition, we highlight five well-known strikers from the top
5 European leagues.
If we focus on Messi, we can observe he is outside the confidence interval in three out of the four speed categories.
We see that he is not the classic striker since he tends to receive the ball while walking much more frequently than
the rest. On the other hand, it is much less common for him to depend on high-intensity to participate in ball
possession. An opposite example is Timo Werner, who tends to receive the ball fewer times at very low intensity
than most strikers, but he belongs to the top 5% of players at high intensities. Finally, we observe that Dybala
leans towards receiving after jogging or running compared to the rest of the strikers.
Such information can greatly benefit a physical coach, who could use these player trends to prepare individualized
drills that replicate the specific demands that a player will face on game day. But can they reinforce those types of
actions in which the player is significantly decisive? That is when the EPV becomes handy. Figure 14 shows the
total EPV added of six strikers from the main European leagues in the different speed categories. Note that EPV
added measures the difference in EPV at the end and beginning of each action.Fig. 13. Percentage of times that a striker directly participates with the ball at each speed category.
The speed is recorded 2 seconds before the ball reception. The gray shaded area represents the 90%
confidence interval among the players with that same role.
Generally, we observe that strikers generate significant increases in the possession value at higher speeds. We
have highlighted two players who could be considered relatively similar: Messi and Dybala. Even though Messi
usually generates more value than Dybala with his actions, they both tend to achieve comparable accumulated
value-added for the depicted speeds. On the contrary, we detect players like Mbappé or Adama Traoré who add
more value with their actions at high intensities.
The examples below and many more extracted from the presented framework are beneficial for both coaches and
physical trainers when designing training sessions. Having detailed information on the movements and speeds a
player tends to interact with the ball is key, but measuring how much a player influences the team’s performance
is a game-changer.
Fig. 14. EPV added by five strikers with on-ball actions at the different speed categories. The circles’
size represents the number of actions the player participates in at each speed category. Both variables
are normalized per 30 minutes of effective time in possession. The gray lines in the background
represent other strikers from the main European leagues.4.5. What is the impact of high-intensity runs in increasing goal value?
The previous section introduced a variable to measure the quality of the on-ball actions, segregating the value by
the different speed categories. However, we have not yet discussed adding a qualitative component to all the HI
runs a player performs in possession, both on- and off-ball.
To capture the influence of players’ HI efforts on the variance of the team’s probability of scoring a goal long-term
(and at the same time lowering the probability of conceding a goal), we will use the player’s coefficients from the
linear regression presented in the equation defined in Section 3.4. Both plots in Figure 15 show this new metric’s
values from Real Madrid and FC Barcelona’s players (on the top) and Liverpool and Manchester City’s (on the
bottom). The metric is then compared to each player’s distance covered at HI. Note that some players appear more
than once in the plot because we consider those player roles separately if they played at least 450 minutes per role.
We observe how players like Jordi Alba, Nabil Keı̈ta, or Frenkie De Jong (both as a midfielder and as a Central
Defender) tend to cover fewer distances at a HI, but they have a strong influence on their team’s EPV when they
do so. On the other hand, we have previously seen in Section 4.4 that Messi does not tend to receive at a high
intensity very often; however, he has an excellent ability for taking advantage of this kind of situation.
Furthermore, Sergio Busquets and Thiago Alcantara show an influence below average with high-intensity runs
compared to all the positions, but a very high on-ball EPV added (demonstrated by their circle’s size). This
behavior is a clear representation of positional midfielders. On the other hand, players such as Diogo Jota or
Raheem Sterling represent a type of attacking midfielder that contributes highly to the team’s EPV through their
high-intensity runs.
4.6. Do teams maintain high-intensity efforts throughout the entire match?
Until now, we have focused on the contextualization of the physical indicators through tactical variables. However,
there is a fundamental contextual variable in every team sport: time. In this study, we will not delve into the time
factor in-depth; however, we want to do a first examination of how physical effort varies throughout the time of
the game.
Fig. 16. Above, the distribution of the distance covered by teams in defense per match minute.
Below, the variation with respect to the mean of the distance in defense at a high intensity (in
orange), compared to the variation of the global distance (in blue). Both curves are smoothed by
applying a rolling average of 5 minutes.Fig. 15. Influence of players to their team’s EPV after a HI run, extracted from the weights of a linear regression model. Each color is associated with a different player role, and the circle’s size represents the on-ball EPV added normalized per 30 minutes of effective playing time in possession.
Figure 16 shows the evolution of the distance covered in defense in each minute of a match. Note that the metrics
are normalized per 60 seconds of effective playing time in out of possession. The plot above presents the dis-
tribution of the distance covered at each minute of the game. In contrast, in the plot below, we have computed the
variation with respect to the mean of the distance (in blue) and the distance at a high intensity (in orange) in each
minute.
We can see a considerable decrease in both the global and the high-intensity distance in defense from minute
65 onwards, but the latter’s reduction is much steeper. The reasons for this can be multifactorial, such as the
goal differential or fatigue, which despite being a complex concept, we are sure determines performance. Further
analysis on this path would help determine the optimal moment to make a substitution or change tactics by putting
players on the pitch who exploit the areas that require more defensive effort at the end of the game.

5.    Discussion

The presented top-down framework proposes a novel approach for (1) estimating physical indicators from tracking
data, (2) contextualizing each player’s run to understand better the purpose and circumstances in which it is done,
(3) adding a new dimension to the creation of player and team profiles which were often ignored by physical
indicators, and finally (4) assessing the value-added by off-ball high-intensity runs by linking with a possession-
value model.
In addition to the study’s novelty, the framework allows answering practical questions from very different profiles
in a soccer club:
     1. First, starting from the ones closest to the grassroots, players could benefit from data-driven feedback and
        explanations that help them understand the impact of their efforts on their team’s performance to boost
        player development.
     2. Secondly, the most direct beneficiaries are coaches and analysts, who can benefit from new tactical insights
        adding a new dimension to understand better the next opponent and its players merging physic behaviors
        with tactic information.
     3. Then, a scouting department would profit from an improved version of player knowledge, identifying the
        off-ball profile, which is crucial to understand the player as a whole.
     4. Finally, physical coaches and readaptation physiotherapists could also benefit. The former could design
        individualized drills based on the demands of each player, whereas the latter could understand the type of
        high-intensity efforts a player tends to do in-match to tailor the exercises in the return-to-play phase fittingly.
In this work, we argued that the simple aggregation of physical indicators such as distance traveled, accelerations,
or high intensity runs provide an incomplete and many times insufficient picture of players’ actual physical skills
regarding their contribution to the game. In the end, soccer is about scoring and preventing goals, but there’s been
little effort so far in literature to integrate tactical context and value creation with players’ physical efforts.
From an individual perspective, we showed how combining fundamental tactical concepts with players’ runs
provides a richer context for building a player’s movement profile and identifying what types of movements occur
more often and which create more value. This type of analysis moves research one step forward towards the so-
desired individualization of training drills and the understanding of the physical demands of a match so these can
be translated into training (and a long-standing goal in sports science).
From a team-level tactical perspective, the proposed contextualization allows coaches to understand which players
would maximize a given strategy, such as exploiting spaces in the sidelines or opening the field to overload the
midfield.
This paper opens a new research path with potential derived studies that could address subjects such as analyzing
the optimal moment for the coach to make the substitutions or estimating players’ fatigue from a tactical perspec-
tive, to identify those zones in the opponent’s defense that can be exploited once the match is advanced. In addition,
a comprehensive understanding of fatigue’s effect on players’ decision-making and technical performance would
directly improve player development.
References
1. Bradley, P. S., Lago-Peñas, C., Rey, E., & Gomez Diaz, A. (2013). The effect of high and low percentage ball possession
on physical and technical profiles in English FA Premier League soccer matches. Journal of sports sciences, 31(12),
1261-1270.
2. Altmann, Stefan & Forcher, Leon & Ruf, Ludwig & Beavan, Adam & Gross, Timo & Lussi, Philipp & Woll, Alexander
& Härtel, Sascha. (2021). Match-related physical performance in professional soccer: Position or player specific? PLOS
ONE. 16. e0256695. 10.1371/journal.pone.0256695.
3. Ingebrigtsen J, Dalen T, Hjelde GH, Drust B, Wisløff U. (2015) Acceleration and sprint profiles of a professional elite
football team in match play. Eur J Sport Sci; 15:101–10. pmid:25005777.
4. Pons, E., Garcı́a-Calvo, T., Resta, R., Blanco, H., López del Campo, R., Dı́az Garcı́a, J., & Pulido, J. J. (2019). A
comparison of a GPS device and a multi-camera video technology during official soccer matches: Agreement between
systems. PloS one, 14(8), e0220729.
5. Castellano, J., Blanco-Villaseñor, A., & Alvarez, D. (2011). Contextual variables and time-motion analysis in soccer.
International journal of sports medicine, 32(06), 415-421.
6. Ade, J., Fitzpatrick, J., & Bradley, P. S. (2016). High-intensity efforts in elite soccer matches and associated movement
patterns, technical skills and tactical actions. Information for position-specific training drills. Journal of sports sciences,
34(24), 2205-2214
7. Bradley, P. & Ade, J. (2018). Are Current Physical Match Performance Metrics in Elite Soccer Fit for Purpose or Is
the Adoption of an Integrated Approach Needed? International Journal of Sports Physiology and Performance. 13.
10.1123/ijspp.2017-0433.
8. Fernández, J., Bornn, L., & Cervone, D. (2021). A framework for the fine-grained evaluation of the instantaneous
expected value of soccer possessions. Machine Learning, 1-39.
9. Lorenzo-Martinez, M., Kalén, A., Rey, E., López-Del Campo, R., Resta, R., & Lago-Peñas, C. (2021). Do elite soccer
players cover less distance when their team spent more time in possession of the ball? Science and Medicine in Football,
1-7.
10. Bradley, P. S., Carling, C., Archer, D., Roberts, J., Dodds, A., Di Mascio, M., ... & Krustrup, P. (2011). The effect
of playing formation on high-intensity running and technical profiles in English FA Premier League soccer matches.
Journal of sports sciences, 29(8), 821-830.
11. Shaw, L., & Glickman, M. (2019). Dynamic analysis of team strategy in professional football. Barça sports analytics
summit, 1-13.
12. Decroos, T., Bransen, L., Van Haaren, J., & Davis, J. (2020). VAEP: An Objective Approach to Valuing On-the-Ball
Actions in Soccer. In Proceedings of the Twenty-Ninth International Joint Conference on Artificial Intelligence, IJCAI-
20 (pp. 4696-4700). International Joint Conferences on Artificial Intelligence Organization.
13. Statsbomb. (2021). Introducing on-ball value. https://statsbomb.com/2021/09/introducing-on-ball-value-obv. Accessed:
2021-11-27.
14. Rudd, S. (2011). A framework for tactical analysis and individual offensive production assessment in soccer using
markov chains. In New England Symposium on Statistics in Sports.
15. Singh, K. (2019). Introducing expected threat. https://karun.in/blog/expected-threat.html. Accessed: 2021-11-22.
16. Fernández, J., Bornn, L., & Cervone, D. (2019). Decomposing the immeasurable sport: A deep learning expected
possession value framework for soccer. In MIT Sloan Sports Analytics Conference.You can also read