Irish Data Management & Reporting Case Studies - National ...
←
→
Page content transcription
If your browser does not render page correctly, please read the page content below
Irish Data Management & Reporting Case Studies
In order to give a sense of the developments in LA capacity currently underway in Irish
HEIs, a number of institutions that have been involved in the National Forum project,
were invited to submit brief descriptions of their current platforms and/or capabilities.
This is a representative, not an exhaustive, list which may be of benefit to institutions
that are interested in further developing their own data management capacity
1. Infohub – University College Dublin
UCD has been following a strategy in relation to management information for the past 5
years supported by a custom-built tool called InfoHub. The key components of InfoHub
are:
    • Strong focus on the integration of data across all key business domains, including
       student, HR, finance and research data.
    • Provision of a consistent user experience which is easy to use for users across all
       information domains. An important aspect of this user experience is speed …
       enabling users to access most data within 5 seconds.
    • Provision of primarily real-time information, though there are some specific
       instances where it is more appropriate to show snapshots of information.
    • Close partnership with both the data owners and the information consumers to
       define, develop, rollout and support new reports. An emphasis is on ensuring
       that there is a consistent range of information available at operational
       and management levels across all information domains.
    • Strong security and access control to ensure that only those authorized to see
       data, can access it. In most cases, this authorization is linked to the role of the
       individual or managed by the owners of the data.

contributed by mark.lande@ucd.ie
2. National College of Ireland
The National College of Ireland (“NCI”) has been utilising Learning Analytics for a period
of 3 years now in a bid to combat poor progression rates and aid retention. Initially
developed using a limited attendance monitoring tool – the National College of Ireland
is currently investing significant time and resources in developing a system which can
assist College staff in monitoring the overall engagement of our student body.
From internal research – it has become clear that poor attendance was an early stage
indicator of a student at risk of withdrawal or exam failure. With that in mind – the college
requires all students to scan into classes and using this data – along with other sources
of information such as exam results, interaction with the Virtual Learning Environment –
interactions / interventions are then staged with at risk students through email, text,
phone calls or face to face meetings. At the moment – this integration of data is done
manually – however a plan is currently underway to bring this into a more automated
format.
These interventions are coordinated through the Learning and Teaching Office at NCI
and while they are resource intensive but have proved to be quite successful in
stemming early stage withdrawals over the previous 3 years especially in the 1- and 2-
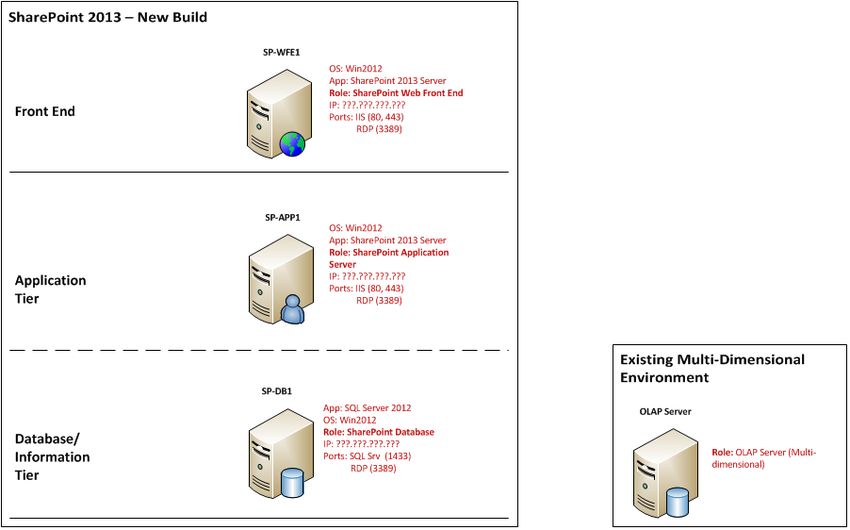
year cohorts of undergrad students. NCI have also found them to be exceptionally useful
in identifying students where personal, financial or medical issues are affecting a full
engagement with their course of study. After 3 years in operation - NCI are now starting
to see those students that were identified through these monitoring tools graduating.
Moving forward – NCI are seeking to fully automate their engagement platform by
combining all sources of data across one single platform to create an engagement
dashboard. This is not without its own challenges as NCI has discovered along the way
but in the long run – the benefits of such a learning analytics system will prove
particularly beneficial.
Contributed by Jonathan Lynch
3. Enterprise Reporting Portal - CIT
In 2014 a 3rd party vendor was engaged to assist with the delivery of a new Enterprise
Reporting Portal in CIT and also the further development of new data sets into our data
warehouse. As the institute already had a large footprint on SharePoint, it was decided
that the portal leverage this technology and the main elements of same included:

   •   SharePoint libraries/dashboards/webparts

   •   Excel Services

   •   Sql Server Reporting Services

   •   PowerView

   •   PowerPivot
The immediate objective was to take a faculty dashboard mocked up by the head of
faculty and redevelop this with the new technologies with a view to slicing this report for
every head of department, school and faculty across the Institute. A governance group
was formed to sign off on the data definitions required for this dashboard and the first
consistent set of student retention data was delivered to the Faculty of Engineering and
Science as the pilot phase of the project. This was kept very simple and the dashboard
was made very interactive and intuitive eliminating the need for any technical skills for
end users. This solution was first launched in late 2014 with the high level design as
shown in the figure below.
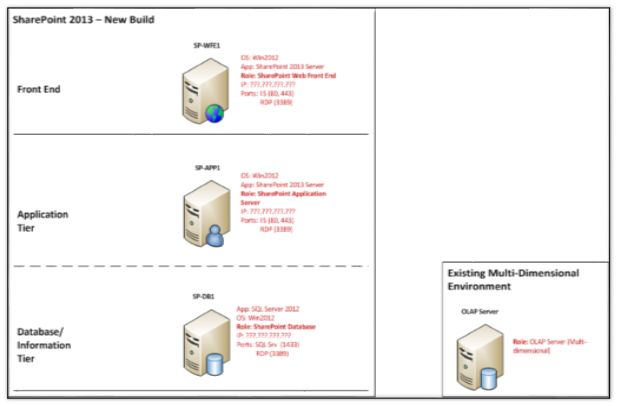
Figure 1: Sharepoint

Contributed by Jonathan.McCarthy@cit.ie
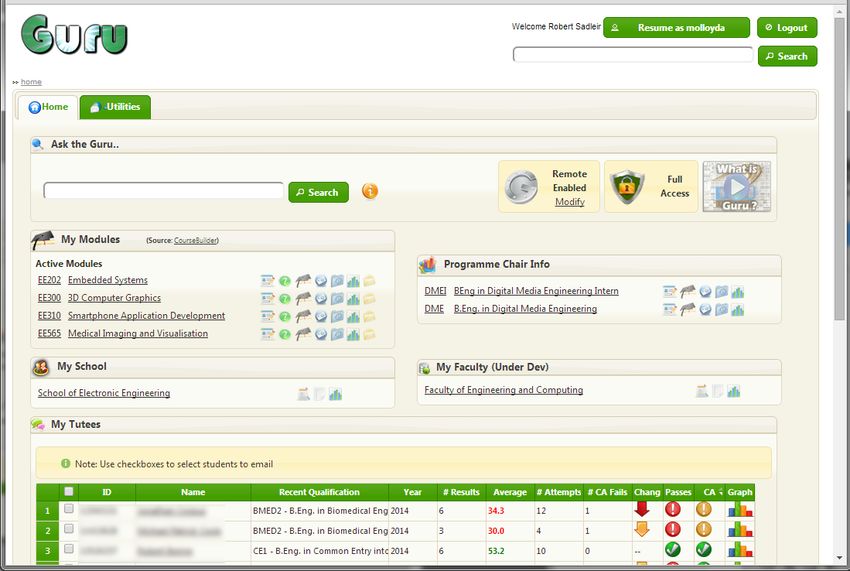
4. GURU Platform - DCU
Guru is a “student information platform”, developed at Dublin City University. The
purpose of the platform is to harness existing institutional data in order to build systems
aimed principally at academic members of staff. The core system not only facilitates
the presentation of student information in an efficient and user-friendly manner, but also
provides a platform for the development of a number of sub-systems. These systems
relate to providing student learning analytics, digital examination paper processing,
management of personal tutees, student project allocation, accreditation and exam
board processing. Further systems are at various stages of planning.

Figure 2: Sample Home Page for an academic using Guru

From a learning analytics perspective, a number of graphs are made available to staff
members, such as:

    •   Student performance over time

    •   Module Comparative Difficulty (Linear Regression Graph based on averages)

    •   Student Retention Graphs (showing graduations and withdrawals)

    •   Traffic Light Warnings for Personal Tutees

    •   Grade Inflation over Time

    •   Module Pass/Fail Rates/Mark Clustering

Contributed by david.molloy@dcu.ie
5. Student IT Helpdesk Interface - UCC
In 2016, UCC implemented a multi-source reporting interface for our Student IT
helpdesk. It gathers a snapshot of a student’s digital footprint on a single page, pulling
data from multiple systems, including:
• Student Records (ITS): lists basic biographical and registration data, and lists the
last time they attempted to log in.
• Active Directory: Confirms that the students account is active on Active Directory,
when they last changed their password, whether they have a license to use Office
365.
• Blackboard: Lists the date of last login, and the modules they are enrolled in, and
compares this to the registration data from the student records system
• Eduroam (Wifi): Lists the most recent log entries for that student
• Edugate: Lists the most recent log entries for that student
The primary purpose of the tool is to support our IT helpdesk. When a student reports a
technical difficulty, this is a single place where the support team can review all relevant
data and log files.
The tool uses a number of methodologies to gather the data. Direct database queries,
textual analysis of log files, and ldap queries. Some data is live, and others are delayed
by 10 mins or 24 hours depending on where the data is coming from. Each report is very
bespoke to the application/service it is reviewing.
Contributed by tim.odonovan@ucc.ie
6. Student Engagement Analytics & IAN - UCD
UCD began developing its learning analytics capacities in 2011 with Student Engagement
Analytics, a bi-semester report, housed in MS Excel, that enabled Programme Offices to
identify students who may in need of targeted support.
In format, it was an Excel report distributed by UCD Registry at the middle and end of
each semester, that listed a large amount of data for each undergraduate student. The
primary sources of data were the Student Information System and the VLE. Data about
the students’ registration, workload, grade breakdown and VLE hits (both in isolation and
in relation to their peer group average) were included. It took one person approximately
two days to compile and distribute the report.
In addition to the raw data, key filters were also included that enabled the quick
identification of students with records of particular interest to the user. These filters were
banded for ease of use. For example, grade data was broken into categories such as
‘Failed all assessments’, ‘Passed majority of assessments’ etc. VLE hits were broken into
categories denoting activity relative to their peers (eg ‘0 VLE hits’,’1-20% of peer
average’,’>80% of peer average’ etc).Although this was a low tech system, it provided support staff with valuable, actionable insights at key points during the year. Because it was housed in MS Excel, no developers or bespoke software purchases were necessary. Based upon the potential realised by Student Engagement Analytics, IAN (Integrated Assistance Nexus) was developed in 2014. IAN is a dynamic suite of online reports, developed within UCD and housed in Infohub. All data listed in IAN is pulled from the SIS database in real time, apart from VLE hits which are extracted and updated in IAN nightly. IAN was designed to be user-friendly so it combines approximately 15,000 pieces of data on each student into five flags which were chosen in collaboration with student support staff as potentially identifying students that may need support. The report can be sorted by flag count, thereby enabling easy identification of students with issues across a range of criteria including engagement, performance and workload. Contributed by jeremy.britton@ucd.ie 7. PredictEd – Dublin City University The aims of this case study are threefold: 1) Provide regular timely feedback to first year students with respect to their engagement with the VLE 2) To improve first year students’ engagement with course materials and therefore by association hopefully improve overall progression rates through improved grades 3) Demonstrate how the VLE can be harnessed to advance course design. We used Support Vector Machines (SVMs) to mine data and to build classifiers. Students were then separated into two alternate groups based on the modules they were enrolled in. Category 1 students were sent weekly emails, based on our prediction of whether they would pass or fail. Students in this category group were divided again resulting in four groups “bad” and “poor” for those predicted to fail, “good”, and “great” for those predicted to pass. Each group was sent a customised email giving them feedback. The mail was personalized and the content of the message was dependent on which category group they were in. For example, students in the “bad” sub category for instance receiving an email saying how students need to work harder, while those in the “great” group were told they are progressing well. The feedback was further personalized by recommending resources on the VLE course page that the student had not yet accessed – essentially “feed-forward” as opposed to just providing feedback. Finally, each mail also included contact details for the lecturer and for student support services. Category 2 students in the remaining modules were broken into 10 equally sized groups based on their overall prediction ranking. Their feedback was a little more detailed. Emails were sent to each student detailing what percentile group they fall into, giving them an awareness of how their progression compares to their peers. A more encouraging email was sent to the bottom 50% of the class. This may encourage healthy competition among students, motivating them to work harder as they see their progress in the feedback loop. This process was repeated on a week-by-week basis, with the most recent log data downloaded from the Moodle log files. Predictions were generated for
each module as previously outlined. Every week each student who opted in to PredictEd
received a new email.

 We also provided feedback to lecturers and course coordinators through a dashboard,
illustrating the relative activity of each of the students on a weekly basis. This information
then helped the staff identify students at risk very early within the semester as opposed
to at the end of the semester when exam results are processed.
Contributed by mark.glynn@dcu.ie
You can also read