Investor Presentation - Q1 2022 - First Capital
←
→
Page content transcription
If your browser does not render page correctly, please read the page content below
Q1 2022
Investor Presentation
FORWARD-LOOKING STATEMENTS AND NON-IFRS FINANCIAL MEASURES
 This material may contain forward-looking statements, including those identified by the expressions “anticipate”, “believe”, “plan”, “estimate”, “expect”, “intend”
 and similar expressions to the extent they relate to First Capital REIT (“First Capital”) or its management. The forward-looking statements are not historical facts
 but reflect First Capital’s current beliefs and are based on information currently available to management. Certain material factors and assumptions were applied
 in providing these forward-looking statements, many of which are beyond our control.

 Management believes that the forward-looking statements are based upon reasonable assumptions; however, management can give no assurance that actual
 results will be consistent with those expressed or implied in these forward-looking statements. These forward-looking statements are subject to a number of
 risks and uncertainties that could cause actual results or events to differ materially from those expressed or implied in these forward-looking statements.
 Additional information about the risks and uncertainties that could cause actual results to differ materially, and the materi al factors or assumptions that were
 applied in providing these forward-looking statements, are contained in our various securities filings, including our Management’s Discussion and Analysis for
 the year ended December 31, 2021 and the quarter ended March 31, 2022 (the “MD&A”) and our current Annual Information Form, all of which are available
 on SEDAR at www.sedar.com and on our website at www.fcr.ca.

 You should not place undue reliance on any such forward-looking statements. Further, a forward-looking statement speaks only as of the date on which such
 statement is made. These forward-looking statements are made as of May 4, 2022. Except as required by securities law, First Capital undertakes no obligation
 to publicly update or revise any such statements whether to reflect new information, the occurrence of future events or circumstances, or otherwise.
 Additionally, past performance, including the key operating metrics described in this presentation, is not indicative of future results given the risks and
 uncertainties described in detail in our MD&A, including with respect to the global pandemic.

 This material references certain non-IFRS financial measures, including but not limited to FFO, FFO per unit, NOI and NAV. These non-IFRS measures are
 further defined and discussed in the MD&A, which should be read in conjunction with this material and the conference call. Si nce these non-IFRS measures do
 not have standardized meanings prescribed by IFRS, they may not be comparable to similar measures reported by other issuers. First Capital uses and presents
 the above non-IFRS measures as management believes they are commonly accepted and meaningful financial measures of operating performance.
 Reconciliations of certain non-IFRS measures to their nearest IFRS measures are included in the MD&As. These non-IFRS measures should not be construed as
 alternatives to net income or cash flow from operating activities determined in accordance with IFRS as measures of First Capital’s operating performance.

 All figures in this presentation are as of March 31, 2022 unless otherwise noted.

                                                                                                                                                           First Capital   2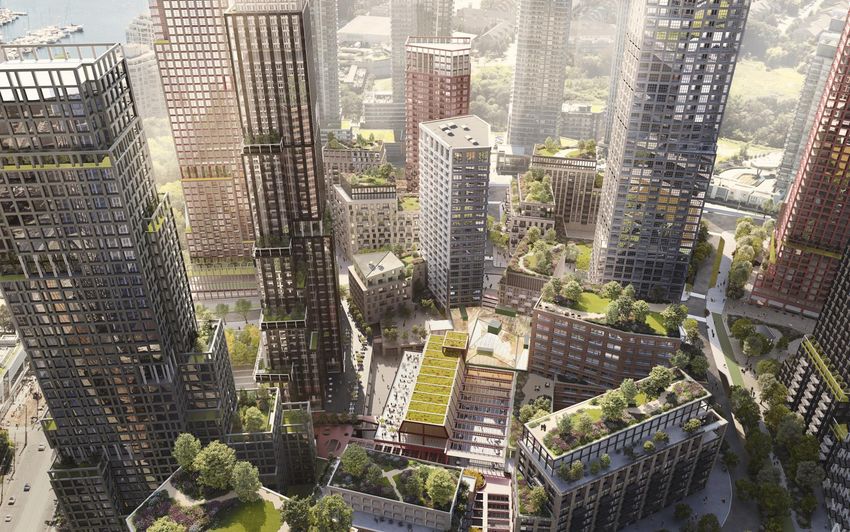
TABLE OF CONTENTS

1.0
1.0 Company Snapshot ....……………………………………………………………………………........................             XX    4

2.0 Highlights - Recent Financial and Operating Results ..….….….….….….……….…………..........
2.0                                                                                          5–7

3.0 Thriving Neighbourhoods …………………….………………………………………………………………......
3.0                                                                                        XX8 -–XX
                                                                                                  20

4.0
4.0 Density Pipeline and Development ..………….………………………………………………………………                        21 -–XX
                                                                                           XX     23

  4.1
  4.1 Active Developments .……………………………………………………………………….………………....                           24-–XX
                                                                                           XX    33

  4.2
  4.2 Near, Medium & Long Term Developments..….……………………………………………………..                       34-–XX
                                                                                           XX    38

5.05Environmental, Social and Governance (ESG) ……….………………………………...................          39-–XX
                                                                                           XX    48

6.0
6.0 Financial Strength and Flexibility ……..………….……………………………………………………………                     49-–XX
                                                                                           XX    53

Appendix - Profiling Thriving Neighbourhoods – Super Urban and Top Tier Suburban ...        54
                                                                                             XX–-71
                                                                                                 XX

                                                                                                 First Capital   3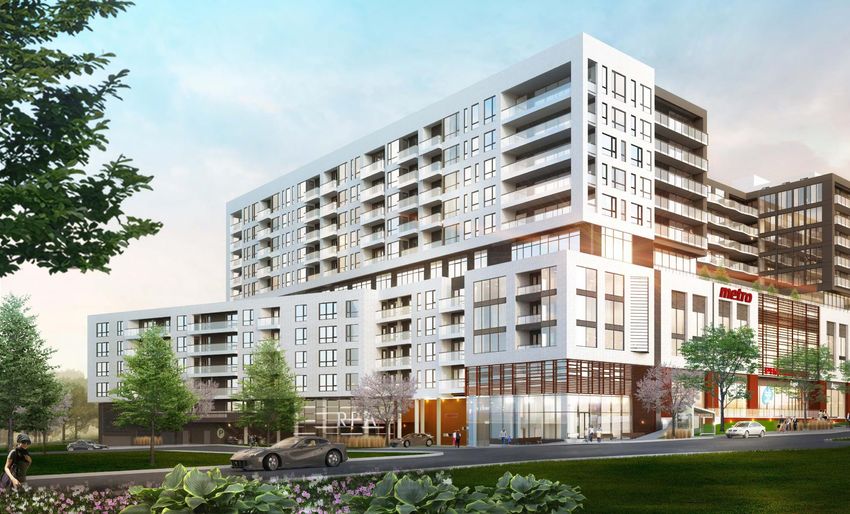
1.0 COMPANY SNAPSHOT (TSX: FCR.UN)

 First Capital is a leading owner, operator and developer of grocery anchored and mixed-use real estate
 located in Canada’s most densely populated cities. First Capital’s focus is on creating thriving urban
 neighbourhoods to generate value for businesses, residents, communities and our investors.

              148                                                             22.5m sf
          neighbourhoods                    Major market                        of gross leasable area
                                                                               (19.6m sf at FCR share)

                                          urban
          $8.4b
           enterprise value
                                         focus across Canada
                                                                             23.3m sf
                                                                            of future incremental density

 As of March 31, 2022

                                                                                                    First Capital   4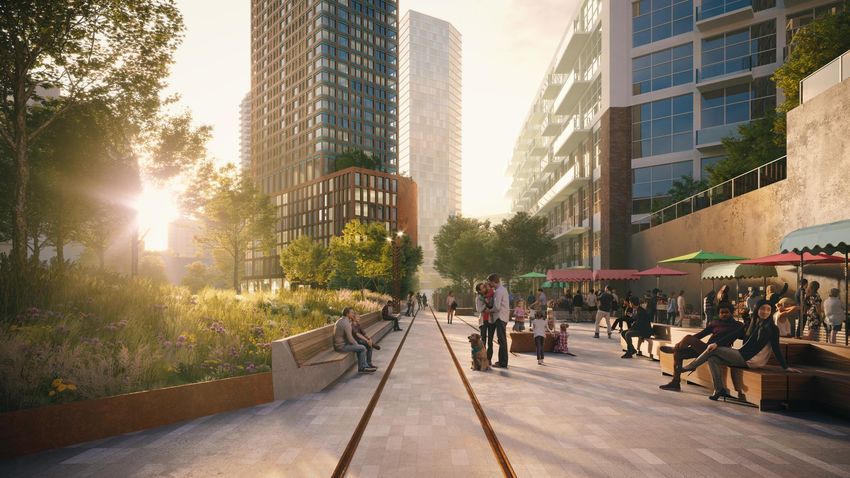
2.0
Highlights - Recent Financial
      and Operating Results
2.0 HIGHLIGHTS – Q1 2022

Q1 FFO per unit, excluding OGLE(1) amounts, was $0.28, +14% YoY

Q1 2022 SP NOI growth of 1.9%
• Primarily due to rent escalations and lower BDE, partially offset by lower same property occupancy (-20 bps)
  and lower lease termination fees YoY

Strong NAVPU growth, new high of $24.55
• Growth of 9.8% year over year ($22.35) and 1.2% quarter over quarter ($24.26)

Leasing and Occupancy
• Very strong leasing activity: 77k sf of new leasing plus 838k sf of renewals at average net rental rate increase
   of 7.5%
•    $22.57 net rent psf +2.6% (+$0.58) YoY (new high): Primarily due to openings at higher rents than closures,
     rent steps, renewal lifts and dispositions.
•    Occupancy of 95.5%: down from Q4 2021 (96.1%) and Q1 2021 (95.8%)

(1) OGLE   = Other Gains/Losses and Expenses; Q1 2022 FFO per unit was $0.25, +1.6% YoY

                                                                                                         First Capital   6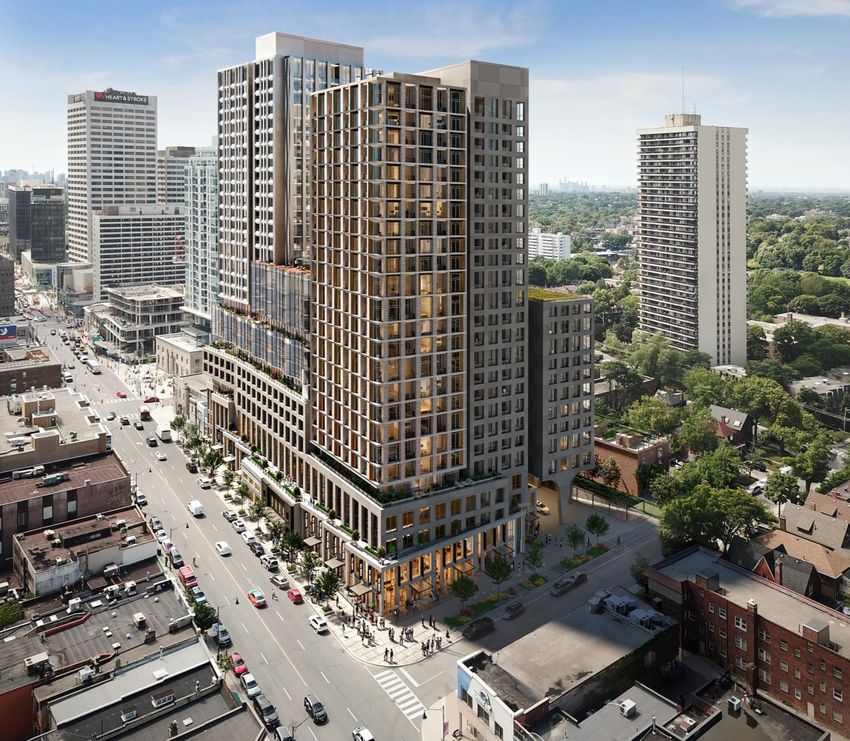
2.0 HIGHLIGHTS – Q1 2022 BALANCE SHEET, LIQUIDITY AND ASSET QUALITY

Maintaining a Strong Balance Sheet and Liquidity Position
• $655m of cash and undrawn credit facilities, as at March 31, 2022
• Unencumbered properties with an IFRS value of ~$7.5b (~74% of total assets)
• $4.5m disposition in Q1 2022; $253m of investment properties HFS as at March 31, 2022

Enhancing Asset Quality
• Asset quality has never been higher due to extensive disposition program, new leasing activities, and
  ongoing urban investments

• Invested $65m in Q1 2022 in development and redevelopment, primarily in Toronto and Montreal
    o 5km population is 300,000. Leader amongst North American peers
    o 5km household income +22% from 2016 to $129k. Leader amongst Canadian peers
    o Average base rent +16% from 2016 to $22.57 psf. Leader amongst Canadian peers

                                                                                                  First Capital   7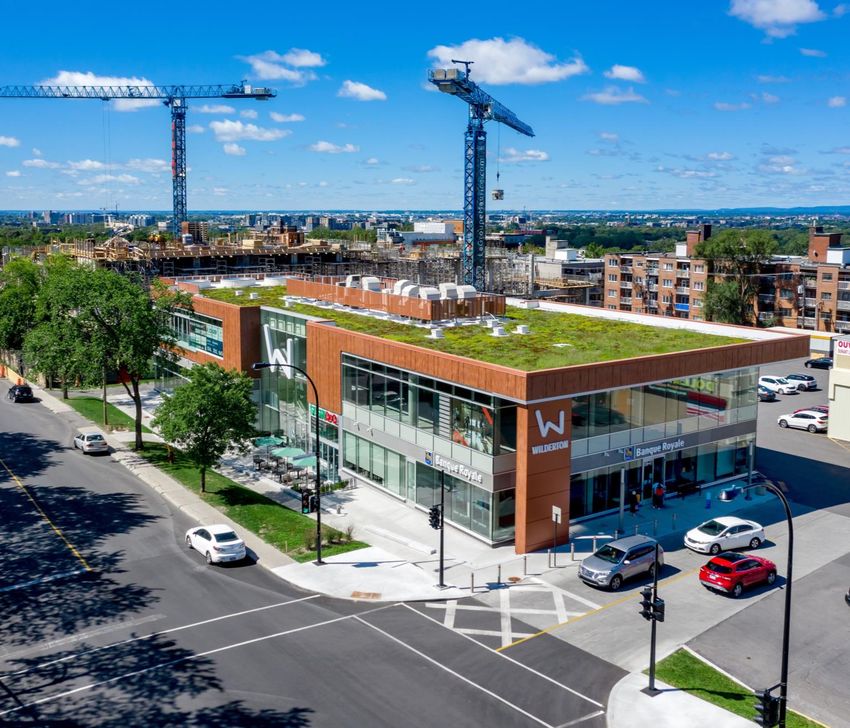
3.0 Thriving
Neighbourhoods
                 First Capital   8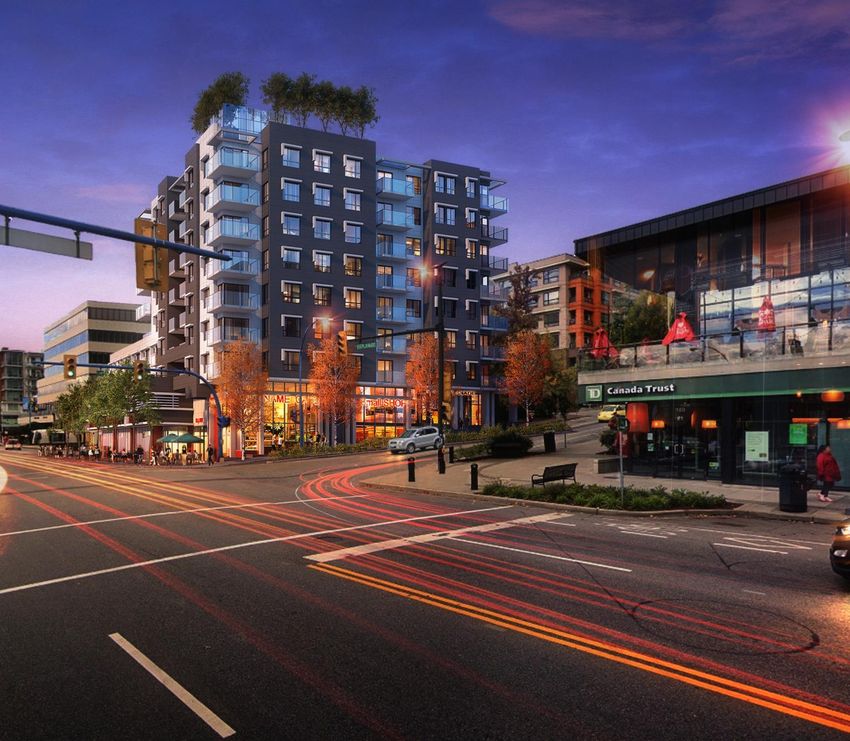
3.0 NEIGHBOURHOOD INVESTMENT STRATEGY

Creating thriving urban neighbourhoods to generate value for businesses, residents, communities and
our investors

• Investing in high-quality, mixed-use, and grocery anchored properties to build positions in targeted high
  growth super urban and top tier suburban neighbourhoods

• Fully integrating retail with other uses to create thriving urban neighbourhoods

• Optimizing the portfolio through active asset management and by concentrating capital in dense, high
  growth neighbourhoods

• Surfacing substantial unrecognized value in our 23.3m sf of density pipeline through entitlements and
  development

• Actively managing our balance sheet to maintain financial strength and flexibility and a competitive cost of
  capital

                                                                                                     First Capital   9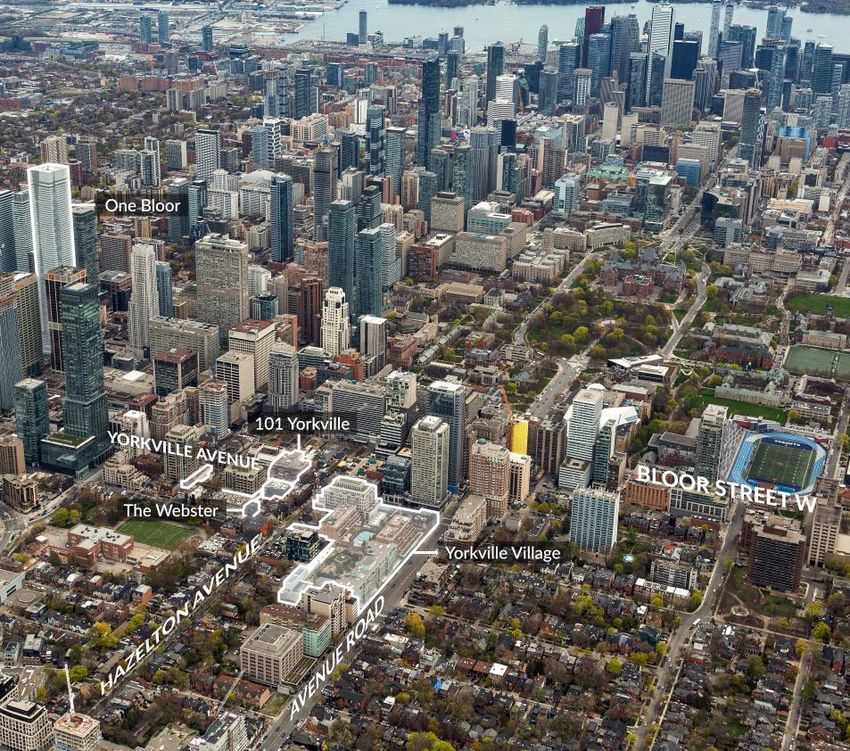
3.0 THRIVING NEIGHBOURHOODS

Proximity to transit, “Walk Score”, and most importantly population density are key criteria by which we
evaluate the potential of our neighbourhoods. We have significantly improved these metrics over time through
our investment and disposition activity and we intend to maintain our industry leadership position.

  >99%
     Public Transit
                      Of portfolio within 5-minute walk of public transit

      71
     Walk Score
                      Average walk score for our portfolio = ‘Very Walkable’
                      2nd highest category of 5

  300kPopulation
                      Average population density within a 5-km radius of each of our properties

                                                                                                  First Capital   10
3.0 THRIVING NEIGHBOURHOODS – FAIR VALUES ACROSS CANADA’S MAJOR CITIES
Vancouver, Calgary,
Western Canada Central Canada Toronto Eastern Canada Montreal, Ottawa
Edmonton
Neighbourhoods 41 Neighbourhoods 66 Neighbourhoods 41
GLA 6.2m GLA 8.6m GLA 4.8m
Fair Value % 30% Fair Value % 54% Fair Value % 16%
Edmonton 10%
Calgary 13%
Vancouver 10%
SW Ontario 3%
40% 14%
Montreal
Toronto
5%
Ottawa
Kitchener/Waterloo/Guelph 5%
First Capital 113.0 THRIVING NEIGHBOURHOODS - NORTH AMERICAN LEADER IN POPULATION DENSITY
FCR Portfolio Demographic Metrics versus Peer Group: Q1 2022 (1)
$129,000
US $116,500
300,000 $115,000
150,000 140,000
US Peers **
Q1 2022 US Peers (2) CDN Peers (3) Q1 2022 US Peers (2) CDN Peers (3)
5 km Population 5 km Average Household Income
Q4 2021
As of March 31, 2022
(1) Source: Sitewise, Environics Analytics (2021 estimates)
(2) US Peers include: Federal Realty and Regency Centers – Source: Company Reports
(3) Canadian Peers include: Riocan, SmartCentres, Choice Properties (Retail only)
Property portfolio based on 2021 AIF for SmartCentres and Choice Properties, Source: Company Reports, Sitewise, Environics Analytics First Capital 123.0 THRIVING NEIGHBOURHOODS - GROWTH IN 5KM POPULATION DENSITY
• Q1 2022 5km population of 300,000 people 300,000
+20%
• Up 93,000 or 45% from December 2016 304,000 300,000
290,000
• Making FCR a leader amongst our North
American peer group (1)
250,000
+20%
Achieved long-term goal of 300k people by
2021 in Q3 2020 215,000
207,000
Q1
2016 2017 2018 2019 2020 2021 2022
5 km Population
(1) North American Peer group includes: Riocan, SmartCentres, Choice Properties, Federal, and Regency Centres
First Capital 133.0 STRONG HISTORICAL GROWTH IN NAV PER UNIT
+4.9%
CAGR 2016 – Q1 2022
$25.00 $24.55
$24.00 $22.26
$23.00 $23.39
$22.59
$22.00 $22.34
$21.85
$21.00
$20.00
$19.53
$19.00
$18.00 $18.25
$17.00
2015 2016 2017 2018 2019 2020 2021 Q1 2022
$16.00
First Capital 143.0 SOLID LONG TERM PERFORMANCE; RESILIENCY IN THE FACE OF SIGNIFICANT ADVERSITY
Same Property NOI Growth
8.0%
2.9%
10-year
6.0%
4.0%
5.7%
pre-pandemic average 1.9%
(2010-2019) 2.0% 2.6%(2)
0.0%
2010 2011 2012 2013 2014 2015 2016 2017 2018 2019 2020 2021 Q1 2022
2.3%
12-year average,
-2.0% -2.6%(1)
-4.0%
including pandemic years
(2010-2021)
-6.0%
-7.1%
-8.0%
(1) Ex-COVID Same Property NOI growth of (2.6%) adjusts for bad debt expense increase and wage subsidy.
(2) Ex-COVID Same Property NOI growth of 2.6% adjusts for bad debt expense decrease and wage subsidy decrease.
First Capital 153.0 CONSISTENTLY HIGH PERFORMANCE IN RENEWAL LEASING SPREADS
Lease Renewal Rate Increases (1)
12.0%
9.2%
10-year
10.0%
pre-pandemic average
(2010-2019) 8.0% 7.5% (2)
6.0%
9.2%
12-year average,
4.0%
including pandemic years 2.0%
(2010-2021)
0.0%
2010 2011 2012 2013 2014 2015 2016 2017 2018 2019 2020 2021 Q1 2022
(1) Represents increase on total portfolio basis. Includes all renewals and contractual fixed rate renewals.
(2) The Trust achieved a 8.9% lease renewal rate increase in Q1 2022 when comparing the net rental rate in the last year of the expiring term to the average net rental rate over the renewal term.
First Capital 163.0 STRATEGIC AND DIVERSIFIED RETAIL TENANT MIX
# of Stores % of Rent
Other Necessity-Based
474 18.1
Retailers
Grocery Stores 125 17.2
Medical, Professional &
1,329 15.7
Personal Services
QSR, Chains and Cafes 910 13.3
Pharmacies 120 9.2
Other Tenants 464 8.3
Banks & Credit Unions 186 8.1
Fitness Facilities 76 3.7
Liquor Stores 89 3.3
Other Restaurants 65 1.5
Daycare &
107 1.6
Learning Centres
As at March 31, 2021 First Capital 173.0 TOP 20 RETAIL TENANTS
Contribute 45% of annualized minimum rent (AMR)
Investment Investment
Rank # Tenant AMR
Grade
Rank # Tenant AMR
Grade
1. 10.4% 11. 1.4%
2. 5.5% 12. 1.4%
3. 3.2% 13. 1.4%
4. 2.7% 14. 1.3%
5. 2.3% 15. 1.3%
6. 2.0% 16. 1.1% -
7. 1.8% 17. 1.1% -
-
8. 1.8% - 18. 1.1%
9. 1.7% 19. 1.0%
10. 1.7% 20. 1.0% -
First Capital 183.0 PORTFOLIO QUALITY HAS NEVER BEEN BETTER
$2.5b of investment activity in 2019 to Q1 2022
FCR’s portfolio demonstrated resilience through more than 12-months of mandated business closures and/or
significant operating restrictions, and it continues to do so, with the recent 2021 and Q1 2022 results.
2019 – Q1 2022 5km Average 5km Average
$ Amount Population Household Income
Acquisitions $523m 552,000 $143,000
Development Spend $436m 424,000 $128,000
Investment Total $959m 493,000 $136,000
Dispositions $1,537m(1) 159,000 $106,000
(1) Including the monetization of FCR’s former partner’s 50% interest in 2150 Lake Shore Boulevard W, Etobicoke for a net price of $100m (sale price, net of option exercise price)
First Capital 193.0 PREMIER PORTFOLIO HIGHEST RENTS IN SECTOR
FCR’s Q1 2022 base rent per square foot is 30% higher than peer group average
$22.57
3.1%
$20.27
$18.75
Q1 2022 Peer Group Average $17.32
Q1 2017 Peer Group Average $16.36
FCR Average rent growth 5 year CAGR $15.49
$14.76
1.1%
Peer Average rent growth 5 year CAGR
(1) (1)
FCR $ Growth since Q1 2017 FCR Q1 2017 Base Rent $Growth since Q1 2017 Q1 2017 Base Rent
(1) Rates for Crombie and Choice are average expiring rent as in-place rent is not disclosed.
First Capital 204.0 Density Pipeline and Development
4.0 SIGNIFICANT FUTURE DENSITY PIPELINE

 Total development inventory of 23.3m sf

 Included IFRS values are:

 Future
 incremental       7.1m sf; value of $521m
 density
                                             1071 King St West       Toronto, ON          Yonge & Roselawn      Toronto, ON

 Properties
 under             84k sf; value of $28m
 construction

 Residential
                   364k sf; value of $140m
 inventory

                                                                 2150 Lake Shore Blvd W        Toronto, ON

                                                                                                             First Capital   22
4.0 FUTURE INCREMENTAL DENSITY - ENTITLEMENTS PROGRAM
• FCR submitted entitlement applications for 15.1m sf or 65% of its incremental density pipeline
• FCR expects to recognize increased IFRS values as previously submitted and future submissions are approved
sf in millions Residential Commercial Total Incremental
Pre-2019 Entitlement Applications (1) 3.0 0.7 3.7 3.5
2019 Entitlement Applications 8.1 1.0 9.1 8.5
2020 Entitlement Applications 2.5 0.3 2.8 2.7
2021 Entitlement Applications 1.5 0.0 1.5 1.4
Total Entitlement Applications 15.1 2.0 17.1 16.1
(1) Disposed of Place Panama (Phase I) in Q4 2020 which included 1.0m sf of previously zoned density
First Capital 234.1 Active Development
4.1 ACTIVE DEVELOPMENTS - DEVELOPING IN THRIVING NEIGHBOURHOODS
Active Developments = 448k sf

         200 West Esplanade (GLA 58k sf)     North Vancouver, BC           Centre Commercial Wilderton (GLA 625k sf)   Montreal, QC

                                           Edenbridge Kingsway (GLA 252k sf)        Toronto, ON                                       First Capital   25
4.1 ACTIVE DEVELOPMENTS - DEVELOPING IN THRIVING NEIGHBOURHOODS
400 King Street West (GLA 463k sf) Toronto, ON 138 Yorkville (GLA 313k sf) Toronto, ON
First Capital 26Future Active Development
200 West Esplanade
North Vancouver, BC
Demographics
5KM
2021 Estimates
Population 264,000
Average Household Income $116,000
Gross Leasable Area (at 100%)
Residential GLA (75 Rental Units) 48,000 sf
Retail GLA 10,000 sf
Total GLA 58,000 sf
FCR Interest 50%
50% Partner
Target Completion Date H2 2023
Note: Rendering is for illustrative purposes. Elements of the completed project may differ. First Capital 27Active Development
Future
Centre Commercial
Wilderton
Montreal, QC
Demographics
5KM
2021 Estimates
Population 638,000
Average Household Income $102,000
Property Statistics
Site Area 5 acres
Pre-redevelopment GLA 112,000 sf
Post Redevelopment GLA
Retail GLA (FCR Interest 100%) 125,000 sf
Residential GLA 500,000 sf
Total GLA 625,000 sf
Key Tenants
Note: Rendering is for illustrative purposes. Elements of the completed project may differ. First Capital 28Active Development
Edenbridge Kingsway
Humbertown, Toronto, ON
Demographics
5KM
2021 Estimates
Population 347,000
Average Household Income $136,000
Phase 1
Site Area 1.8 acres (Phase 1)
Gross Leasable Area (at 100%)
Future
Retail GLA 8,000 sf
Residential GLA 244,000 sf
Total GLA 252,000 sf
100% Commercial
FCR Interest
50% Residential
50% Residential Partner
Target Completion Date H2 2025
Note: Rendering is for illustrative purposes. Elements of the completed project may differ. First Capital 29Future Active Development
400 King Street West
Toronto, ON
Demographics
5KM
2021 Estimates
Population 582,000
Average Household Income $139,000
Gross Leasable Area (at 100%)
Residential GLA 426,000 sf
Retail GLA 37,000 sf
Total GLA 463,000 sf
FCR Interest 35%
50% Partner
Target Completion Date H2 2026
Note: Rendering is for illustrative purposes. Elements of the completed project may differ. First Capital 30Future Active Development
138 Yorkville Avenue
Toronto, ON
Demographics
5KM
2021 Estimates
Population 775,000
Average Household Income $147,000
Gross Leasable Area (at 100%)
Residential GLA 272,000 sf
Retail GLA 41,000 sf
Total GLA 313,000 sf
FCR Interest 33%
Co-development Partner 33%
Passive Partner 33%
Target Completion Date H1 2026
Note: Rendering is for illustrative purposes. Elements of the completed project may differ. First Capital 31Recent Development Completion
Station Place
Toronto, ON
Demographics
5KM
2021 Estimates
Population 272,000
Average Household Income $147,000
Gross Leasable Area (at 100%)
Retail GLA 43,000 sf
Residential GLA (333 Rental Units) 267,000 sf
Total GLA 310,000 sf
FCR Interest 35%
50% Partner
Key Tenants
First Capital 32Recently Development Completion
Station Place Farm Boy opens amidst construction completion September 2021 Opening
First Capital 334.2 Near, Medium & Long Term Developments
4.2 NEAR, MEDIUM & LONG TERM DEVELOPMENTS

      1071 King - Liberty Village (GFA 196k sf)     Toronto, ON                Yonge & Roselawn (GFA 513k sf)   Toronto, ON

                                            2150 Lake Shore Blvd W (GFA 7.5m sf)   Toronto, ON
                                                                                                                              First Capital   35
Future Near Term Development
1071 King Street West
Toronto, ON
Demographics
5KM
Update 2021 Estimates
Picture Population 579,000
Average Household Income $127,000
Gross Floor Area (at 100%)
Residential GFA (227 Rental Units) 191,000 sf
Retail GFA 5,000 sf
Total GFA 196,000 sf
FCR Interest 67%
33% Partner
Targeted Start 2022
Note: Rendering is for illustrative purposes. Elements of the completed project may differ. First Capital 36Future Medium & Long Term Development
Yonge & Roselawn
Toronto, ON
Demographics
5KM
2021 Estimates
Population 485,000
Average Household Income $209,000
Current Retail GLA 42,000 sf
Future Residential GFA (~539 Rental Units) 443,000 sf
Future Retail GFA 70,000 sf
Total Future GFA 513,000 sf
FCR Interest 100%
Targeted Start 2023
Note: Rendering is for illustrative purposes. Elements of the completed project may differ. First Capital 37Future Medium & Long Term Development
2150 Lake Shore Blvd W
Former Christie Cookie Site, Toronto, ON
Demographics
5KM
2021 Estimates
Population 263,000
Average Household Income $127,000
Planned Gross Floor Area (at 100%)
Residential GFA ( ~7,500 Units) 6,300,000 sf
Non-Residential GFA 1,200,000 sf
Total GFA 7,500,000 sf
FCR interest 50%
50% Partner
Targeted Start 2024
Note: Rendering is for illustrative purposes. Elements of the completed project may differ. First Capital 385.0
Environmental, Social and Governance (ESG)
395.0 ESG INITIATIVES
167
Properties certified
High 2021 ESG scores (1)
Environmental: 2
Social: 2
87% of portfolio GLA Governance: 2
(2021)
(2021)
Winner in the Canada’s
Greenest Employers
Competition
(2022)
2021
1st in our Peer group
GRESB Development Benchmark Standing Investments Benchmark
Score 87 (2021), up from 69 (2020) Achieved 4-star rating
(1) On a scale of 1-10, with 1 being the highest
Score 81 (2021), up from 78 (2020)
First Capital 405.0 ESG INITIATIVES
125
LEED-certified projects
Canada’s Top Small &
Medium Employers
> 4.1m sf (2021)
Received 2 “The
Outstanding Building of
the Year” Award and
Certificate of Excellence at
3 of our properties.
AA
ESG Rating
Recognized as one of
Greater Toronto’s
Top 100 Employers
(2021) (2nd consecutive year)
First Capital 415.0 ESG INITIATIVES
7.1m sf 2021 Green Lease Leader
Achieved WELL Health- by Institute for Markey
Safety Rating (35 properties) Transformation
First Canadian REIT to be a Honouree in the
signatory in support of the Globe & Mail’s
Task Force on Climate- “2021 Women Lead Here” list
Related Financial (2nd consecutive year)
Disclosure
First Capital 425.0 ESG ROADMAP (2020-2024)
Environment Social Governance
• Establish near-term and • Launch the FCR Thriving • Align disclosures with the
long-term GHG reduction Neighbourhoods Task Force on Climate-
targets, with the goal of net- Foundation, with focus on 4 related Financial Disclosures
zero emissions by 2050, or pillars: Food (TCFD) recommendations
sooner Insecurity/Poverty, Mental • Participate in sustainable
• Target a 50% average waste Health, Social Justice and financing opportunities
Youth (achieved)
diversion rate by December (achieved)
31, 2023 • Develop and implement a • Assign a Board Trustee as
• Install electric vehicle Retail Tenant Guide to responsible for ESG strategy
Sustainable Operation
charging stations at all oversight (achieved)
properties by December 31, (achieved)
• Employ ESG Taskforce to
2024 • Strive to be in the Top 100
embed ESG Roadmap in
Employers ranking annually business planning, monitor
progress and assign
accountability (achieved)
First Capital 435.0 ESG INITIATIVES
• 10% decrease in Greenhouse Gas (GHG) emissions
(2016 – 2020) GHG Emissions
• 10% decrease in 2020 energy consumption, relative to
25,000
2019
24,500
• Completed our 5-year national commitment to convert
all our exterior and parking lot lighting to energy- 24,000
efficient LED (2016-2020)
23,500
• Incorporated sustainability-linked feature into our 23,000
Emissions (tC0 2e)
$450m unsecured operating facility
22,500
• Launched the FCR Equity, Diversity & Inclusion (ED&I)
Council and developed a three-year 2021-2023 ED&I 22,000
Action Plan
21,500
• FCR Thriving Neighbourhoods Foundation Fall 21,000
fundraiser in support of Second Harvest raised over
$281,000 20,500
20,000
• Installed 250 electric vehicle stations across 76 2016 2017 2018 2019 2020
properties
First Capital 445.0 ENHANCING THRIVING NEIGHBOURHOODS THROUGH PUBLIC ART
29 Public Art Installations commissioned across our portfolio
Supporting Public Art partnerships with
First Capital 455.0 STRONG GENDER DIVERSITY METRICS ACROSS THE ORGANIZATION
EXECUTIVE BOARD
MEMBERS MEMBERS
43% Women 57% Men 33% Women 67% Men
Honouree in the Globe and Mail’s
“2021 Women Lead Here” list MANAGEMENT TOTAL
ROLES EMPLOYEES
(2nd consecutive year)
Over 50% of management positions are held by females
53% Women 47% Men 58% Women 42% Men
As of March 31, 2022
First Capital 465.0 FCR EQUITY, DIVERSITY & INCLUSION (ED&I)
First Capital is committed to sustaining an equitable, diverse, and inclusive culture of belonging, where all
employees have an equal opportunity to thrive, love what they do and grow their careers.
First Capital continues to evolve and build an action framework to support a more diverse and inclusive
workplace, believing that it is an essential and foundational core value that enables greater collaboration,
innovation, and connection to each other for a more sustainable workplace and culture.
ED&I Initiatives include but not limited to:
• Created an employee-led ED&I council
• Established a vision and mandate to frame our progression
• Partnered with Pride at Work and Canadian Centre for Diversity & Inclusion on how to advocate and build
a pipeline of diverse talent
• Offered information sessions for learning on indigenous cultures through the University of Saskatchewan
on National Truth and Reconciliation Day, September 30th, 2021
• Pledged to end systemic racism with BlackNorth Initiative by enhancing diversity and inclusion strategies
• Developed a 3 year action plan that will guide FCR’s ED&I initiatives
First Capital 475.0 FCR THRIVING NEIGHBOURHOODS FOUNDATION – SECOND HARVEST
• The FCR Thriving Neighbourhoods Foundation is an
employee-led organization that supports registered charities
and philanthropic initiatives that support the neighbourhoods
in which we operate.
• Since its inception in 2020, we’ve been solely focused on food
insecurity – one of our foundation’s four main pillars, which
also include mental health, youth initiatives, and social justice.
• In the Fall of 2021, the Foundation partnered with Canada’s
largest food rescue organization, Second Harvest, in an effort
help to combat food insecurity.
• Thanks to the generous donations from our staff and
corporate partners, we raised an outstanding $281,000, which
will provide 562,000 meals for Canadian families facing food
insecurity.
• These funds will rescue and redistribute over 780,000 pounds
of food, and as a result, will prevent 2.9 million pounds of
greenhouse gases from entering our atmosphere – the
equivalent of taking 400 cars off the road this entire year.
First Capital 486.0
Super
Financial Strength Urban
and Flexibility
Neighbourhoods6.0 CAPITAL STRUCTURE (1)
Enterprise Value $8.4b
$b WAIR (2)
Mortgages 1.2 3.5%
15% Secured Facilities 0.1 2.8%
Total Secured 1.3 3.5%
Unsecured Debentures 2.2 4.0%
38% Unsecured Term Loans 0.7 2.8%
Unsecured Revolving Facilities
0.3 1.6%
($800m total capacity)
Total Unsecured 3.2 3.5%
Total Debt 4.5 3.5%
47% Trust & Exchangeable Units 4.0
(220m units)
(1) As of March 31, 2022
(2) Weighted average interest rate
First Capital 506.0 FINANCIAL STRENGTH AND FLEXIBILITY
Q1
As at 2021 2020 2019 2018 2017
2022
Unsecured revolving credit
$800 $800 $800 $800 $800 $800
facilities (million)
74% Unencumbered assets (billion) $7.5 $7.4 $7.0 $7.0 $7.3 $7.4
of Q1 2022 assets
Unencumbered assets to
2.3x 2.3x 2.1x 2.2x 2.5x 2.4x
unsecured debt
Secured debt as % of total
12.3% 12.7% 15.2% 14.6% 14.1% 12.7%
assets
Net debt to total assets 43.8% 43.9% 47.3% 46.7% 42.2% 43.8%
Net debt to EBITDA 11.1 11.2x 12.0x 10.0x 9.6x 9.8x
EBITDA interest coverage 2.4x 2.3x 2.1x 2.4x 2.5x 2.5x
First Capital 516.0 WELL-STAGGERED TERM DEBT MATURITIES ($MILLIONS)
Weighted Average Interest Rate 3.7% $900 Unsecured Term Loans 5.5%
Millions
Mortgages
Term to Maturity 4.0 years 5.0%
$800
Senior Unsecured Debentures
95% of Term Debt is Fixed Rate 4.5%
4.2% 4.2% Weighted Average Effective Interest %
$700
4.0%
4.0%
3.7% 3.6%
$600 3.5% 3.5%
3.4%
3.5%
3.3%
2.9%
$500 3.0%
$400 2.5%
2.0%
$300
1.5%
$200
1.0%
$100
0.5%
$- 0.0%
2022 20232015 2024 2016
2025 2026 2017
2027 2028 2018
2029 2030
2019
2031
% Due (1) 6.4% 12.9% 13.1% 11.1% 20.7% 14.9% 8.9% 6.1% 4.4% 1.4%
As of March 31, 2022
(1) Not including principal amortization
First Capital 526.0 FFO PAYOUT RATIO: CREATING MEANINGFUL FLEXIBILITY TO ADVANCE OUR STRATEGIC OBJECTIVES
Enhancing Financial Strength and Flexibility through Temporary Distribution Cut
$350 90%
85%
82% $302
$300 $287
78% $284 80%
$250 $236 $261 $237
74% $225 70%
71% 70%
$200
60%
$150
50%
$100
$63
$50 40%
38% 38%
$0 30%
2015 2016 2017 2018 2019 2020 2021 Q1 2022
FFO excl OGLE/unit $1.05 $1.10 $1.16 $1.21 $1.24 $1.02 $1.07 $0.28
Cash Distributions per unit $0.86 $0.86 $0.86 $0.86 $0.86 $0.86 $0.43 (2) $0.11
ACFO less Distributions $25m (1) $32m $34m $55m $49m $15m $141m $20m
2015 2016 2017 2018 2019
(1) Annual retained operating cash
(2) Reduced annualized distribution per unit to $0.43 from $0.86 effective January 2021 distribution paid to unitholders in February 2021
First Capital 53Appendix
Profiling Thriving Neighbourhoods
– Super Urban and Top Tier Suburban
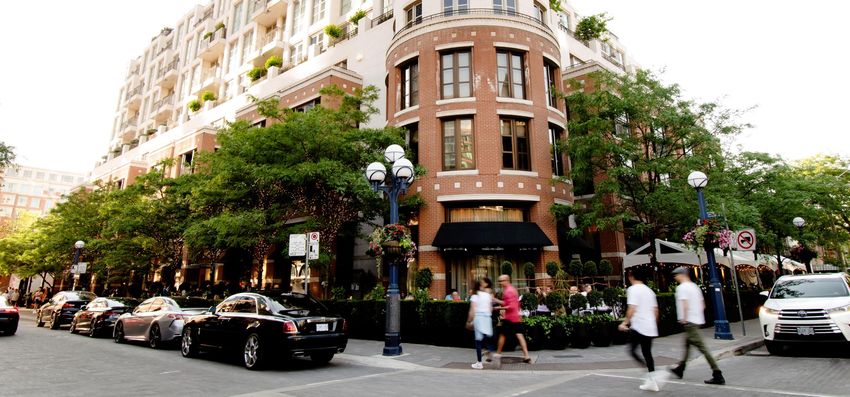
54Super Urban Neighbourhood
Bloor-Yorkville
Toronto, ON
Demographics
5KM
2021 Estimates
Population 744,000
Average Household Income $148,000
Gross Leasable Area
Yorkville Village 315,000 sf
One Bloor East 85,000 sf
Hazelton Hotel 49,000 sf
Total Bloor/Yorkville 449,000 sf
Future Density 117,000 sf
Key Tenants
First Capital 55SUPER URBAN NEIGHBOURHOOD - BLOOR-YORKVILLE
Bloor-Yorkville
A 138 Yorkville Avenue
B Yorkville Village Mall C Hazelton Hotel
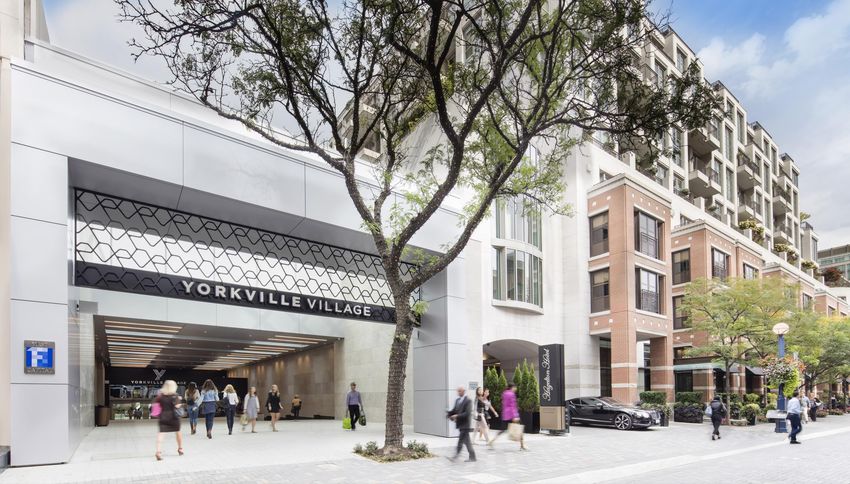
First Capital 56YORKVILLE VILLAGE ACHIEVES #1 DESTINATION STATUS FOR NEW RETAIL
International retailers continue to enter the Canadian market in 2021 and 2022, and many chose
Yorkville Village for their first location, including:
Contemporary women’s Lab-grown, sustainable diamonds High performance
fashion brand and engagement rings electric car brand
(FRANCE) (USA) (SWEDEN)
(2020) (2020) (2020)
Multi-brand luxury retailer
(USA)
(2021)
Source: Retail Insider (January 4, 2021)
First Capital 57Hazelton Hotel & ONE Restaurant
Yorkville Village Hazelton Hotel achieves 5 star rating in Forbes Travel Guide April 2022
First Capital 58New Tenant Opening
Yorkville Village The Webster successfully opens in Canada’s top real estate November 2021 Opening
First Capital 59Super Urban Neighbourhood
Liberty Village
Toronto, ON
Property Statistics
5KM
2021 Estimates
Population 568,000
Average Household Income $126,000
Gross Leasable Area
Retail GLA 395,000 sf
Residential GLA 328,000 sf
Office GLA 109,000 sf
Total GLA 832,000 sf
Acreage 14.1
Future Density 755,000 sf
Key Tenants
First Capital 60Super Urban Neighbourhood
King High Line
Liberty Village, Toronto, ON
Gross Leasable Area (at 100%)
Retail GLA 154,000 sf
Residential GLA (506 Residential Units) 322,000 sf
Total GLA 476,000 sf
Property Statistics
Acreage 2.8
100% Commercial
FCR Interest
50% Residential
Key Tenants
First Capital 61Super Urban Neighbourhood
Griffintown
Montreal, QC
Demographics
5KM
2021 Estimates
Population 412,000
Average Household Income $108,000
Retail GLA 255,000 sf
Acreage 3.2
Key Tenants
First Capital 62Calgary's Premier Super Urban Neighbourhood
Mount Royal Village
Calgary, AB
Demographics
5KM
2021 Estimates
Population 232,000
Average Household Income $149,000
Gross Leasable Area 375,000 sf
Acreage 4.1 .
Key Tenants
First Capital 63Super Urban Neighbourhood
The Brewery District
Edmonton, AB
Demographics
5KM
2021 Estimates
Population 211,000
Average Household Income $96,000
Gross Leasable Area (at 100%)
Retail GLA 261,000 sf
Office GLA 37,000 sf
Total GLA 298,000 sf
FCR Interest 50%
Key Tenants
First Capital 64Super Urban Neighbourhood
False Creek Village
Vancouver, BC
Demographics
5KM
2021 Estimates
Population 438,000
Average Household Income $115,000
Retail GLA 63,000 sf
Key Tenants
First Capital 65Top Tier Suburban Neighbourhood
Olde Oakville
Market Place
Oakville, ON
Demographics
5KM
2021 Estimates
Population 122,000
Average Household Income $212,000
Gross Leasable Area
Retail GLA 125,000 sf
Key Tenants
First Capital 66Top Tier Suburban Neighbourhood
Leaside Village
Toronto, ON
Demographics
5KM
2021 Estimates
Population 495,000
Average Household Income $187,000
Gross Leasable Area
Retail GLA 119,000 sf
Key Tenants
First Capital 67Top Tier Suburban Neighbourhood
Appleby Village
Burlington, ON
Demographics
5KM
2021 Estimates
Population 98,000
Average Household Income $146,000
Gross Leasable Area
Retail GLA 210,000 sf
Key Tenants
First Capital 68Top Tier Suburban Neighbourhood
Pemberton Plaza
North Vancouver, BC
Demographics
5KM
2021 Estimates
Population 203,000
Average Household Income $125,000
Gross Leasable Area
Retail GLA 77,000 sf
Key Tenants
First Capital 69Top Tier Suburban Neighbourhood
Cranston Market
Calgary, AB
Demographics
5KM
2021 Estimates
Population 123,000
Average Household Income $157,000
Gross Leasable Area
Retail GLA 84,000 sf
Key Tenants
First Capital 70Adam Paul
President & CEO
Neil Downey
Executive VP, Enterprise Strategies & CFO
First Capital
Shops at King Liberty
85 Hanna Ave, Suite 400
Toronto, ON
Tel: 416-504-4114
fcr.ca
TSX: FCR.UNYou can also read


