Investor Presentation - First Quarter 2021

Page created by Wallace Steele
 
CONTINUE READING
Investor Presentation - First Quarter 2021
Investor Presentation
First Quarter 2021
Investor Presentation - First Quarter 2021
Forward-Looking Statements
This presentation contains statements as to our beliefs and expectations of the outcome of future events that are "forward-looking" statements within the meaning of Section 21E
of the Securities Exchange Act of 1934, as amended, and the Private Securities Litigation Reform Act of 1995. These forward-looking statements are subject to risks and
uncertainties that could cause actual results to differ materially from the statements made. These include, but are not limited to, the risks and uncertainties associated with: (i)
changes in government policy (including the DOJ not renewing contracts as a result of President Biden's Executive Order on Reforming Our Incarceration System to Eliminate the
use of Privately Operated Criminal Detention Facilities), legislation and regulations that affect utilization of the private sector for corrections, detention, and residential reentry
services, in general, or our business, in particular, including, but not limited to, the continued utilization of our correctional and detention facilities by the federal government, and
the impact of any changes to immigration reform and sentencing laws (our company does not, under longstanding policy, lobby for or against policies or legislation that would
determine the basis for, or duration of, an individual’s incarceration or detention); (ii) our ability to obtain and maintain correctional, detention, and residential reentry facility
management contracts because of reasons including, but not limited to, sufficient governmental appropriations, contract compliance, negative publicity and effects of inmate
disturbances; (iii) changes in the privatization of the corrections and detention industry, the acceptance of our services, the timing of the opening of new facilities and the
commencement of new management contracts (including the extent and pace at which new contracts are utilized), as well as our ability to utilize available beds; (iv) general
economic and market conditions, including, but not limited to, the impact governmental budgets can have on our contract renewals and renegotiations, per diem rates, and
occupancy; (v) fluctuations in our operating results because of, among other things, changes in occupancy levels, competition, contract renegotiations or terminations, increases
in costs of operations, fluctuations in interest rates and risks of operations; (vi) the duration of the federal government’s denial of entry at the United States southern border to
asylum-seekers and anyone crossing the southern border without proper documentation or authority in an effort to contain the spread of COVID-19; (vii) government and staff
responses to staff or residents testing positive for COVID-19 within public and private correctional, detention and reentry facilities, including the facilities we operate; (viii)
restrictions associated with COVID-19 that disrupt the criminal justice system, along with government policies on prosecutions and newly ordered legal restrictions that affect the
number of people placed in correctional, detention, and reentry facilities; (ix) whether revoking our REIT election, effective January 1, 2021, and our revised capital allocation
strategy can be implemented in a cost effective manner that provides the expected benefits, including facilitating our planned debt reduction initiative and planned return of capital
to shareholders; (x) our ability to identify and consummate the sale of additional non-core assets at attractive prices; (xi) our ability to successfully identify and consummate future
development and acquisition opportunities and our ability to successfully integrate the operations of our completed acquisitions and realize projected returns resulting therefrom;
(xii) increases in costs to develop or expand real estate properties that exceed original estimates, or the inability to complete such projects on schedule as a result of various
factors, many of which are beyond our control, such as the effects of, and delays caused by, COVID-19, weather, the availability of labor and materials, labor conditions, delays in
obtaining legal approvals, unforeseen engineering, archeological or environmental problems, and cost inflation, resulting in increased construction costs; (xiii) our ability to identify
and initiate service opportunities that were unavailable under our former REIT structure; (xiv) our ability to have met and maintained qualification for taxation as a REIT for the
years we elected REIT status; and (xv) the availability of debt and equity financing on terms that are favorable to us, or at all. Other factors that could cause operating and
financial results to differ are described in the filings we make from time to time with the Securities and Exchange Commission.
The Company takes no responsibility for updating the information contained in thiscpresentation following the date hereof to reflect events or circumstances occurring after the
date hereof or the occurrence of unanticipated events or for any changes or modifications made to this presentation or the information contained herein by any third-parties,
including, but not limited to, any wire or internet services.                                                                                                                  1
Investor Presentation - First Quarter 2021
CoreCivic Operates at the Intersection of Government and Real Estate
                                               Company Overview                                                             Compelling Investment Opportunity…
•        Diversified government-solutions company with the scale and differentiated expertise to                                                      • Largest private owner of real-estate utilized by government
                                                                                                                       Market Leader with Critical
                                                                                                                                                        agencies
         solve the tough challenges that governments face in flexible, cost-effective ways                            Infrastructure in Market with
                                                                                                                                                      • Public overcrowding or lack of facilities drive private market need
•        First quarter 2021 Revenues and Adj. EBITDA of $455 million and $96.3 million (21.2%                              High Entry Barriers
                                                                                                                                                      • Significant cost and time to build new facility
         margin), respectively                                                                                         Longstanding Government
                                                                                                                                                      • 37+ year history of government service and relationships
•        Owns and manages nearly 18 million square feet of real estate used by government                               Relationships with High
                                                                                                                                                      • Average retention rate of 95% since 20171
•        Approximately 60% of privately-owned correctional facilities in the U.S.                                           Renewal Rates
•        Unprecedented commitment to Environmental, Social and Governance (ESG) reporting                             Conservative Balance Sheet • Strong and predictable cash flow from large unencumbered asset
         within the corrections industry                                                                              with Strong Predictable Cash   base
•        Founded in 1983 and headquartered in Brentwood, Tennessee                                                        Flows and Diversified    • Moderate leverage and strong fixed charge coverage
                                                                                                                                Growth             • Diversifying toward growing Properties and Community segments

                                                                                                                       Proven Management Team
            Provides a broad range of solutions to government partners                                                    with Track Record of        • Combined 120+ years experience
                                                                                                                        Excellence Over Multiple      • Unwavering commitment to rehabilitation and combating recidivism
                             through three segments                                                                         Administrations

                 Safety                                   Properties                       Community                             …That Benefits the Public Good
                                                                                                                                                      • Improved conditions
                                                                                                                                                         Reduced overcrowding, modern amenities, and improved medical
                                                                                                                                                          programs
                                                                                                                        Prepares Offenders for
      CoreCivic’s historical core                 Leases mission-critical real        Completes spectrum of                                              99.5% average facility ACA Audit Score in 2020
                                                                                                                        Successful Reentry Into
    business, addresses the need                estate to government tenants to       correctional services by                                        • Focus on rehabilitation and reentry
                                                                                                                               Society
                                                                                                                                                         Supports legislation designed to eliminate discrimination against
       for correctional facilities,              address serious challenges in     providing needed residential
                                                                                                                                                          rehabilitated justice-involved persons
        including programming,                        their criminal justice         reentry facilities and non-                                         Training and treatment programs
       recreational, courts, and                          infrastructure          residential services primarily to
         administrative spaces                                                          states and localities
                                                                                                                        Company’s ESG Focus           • Serves the needs of government partners, taxpayers and the
                                                                                                                       Benefits All Stakeholders        broader community
          EST. 1983                                     EST. 2012                      EST. 2013
                                                                                              c
                                                                                                                                                                                                                  2
     1        Refers to Owned / Controlled facilities
Investor Presentation - First Quarter 2021
Largest Private Owner of Real Estate Utilized by Government Agencies
Manage nearly 18M square feet of real estate used by government
                               SAFETY
•   85.6% of NOI for the quarter ended March 31, 2021
•   14.3M square feet
•   70,003 correctional/detention beds
•   In 2020, we have been awarded 3 new Safety contracts,
    representing nearly 4,000 beds
•   5 remaining idle facilities, including 6,826 beds available for growth
    opportunities

                           PROPERTIES
•   12.3% of NOI for the quarter ended March 31, 2021
•   2.7M square feet
•   Consists of a combination of corrections/detention, reentry and office
    real estate leased to government entities
•   Actively marketing 3-property portfolio of government-leased office
    real estate for sale. Expected to generate up to $120 million of net
    proceeds, after pay down of non-recourse mortgage debt associated
    with the portfolio

                           COMMUNITY
•   2.1% of NOI for the quarter ended March 31, 2021
•   0.6M square feet
•   5,049 community corrections beds                                         c
•   Serves approximately 20,000 individuals on a daily basis through non-
    residential electronic monitoring and case management services               3
Investor Presentation - First Quarter 2021
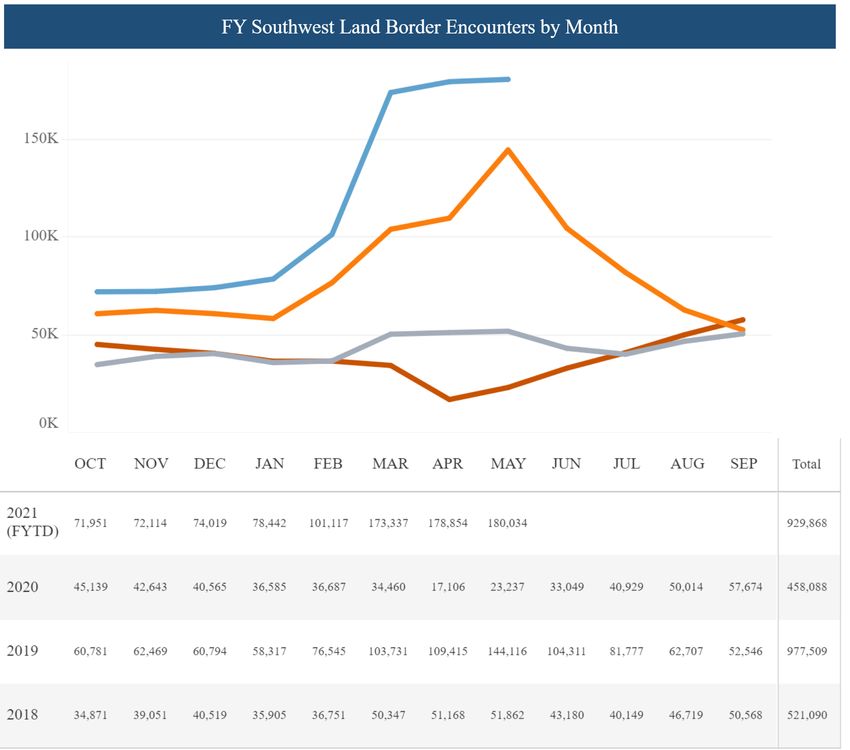
CoreCivic's Business Segments are Complementary
                                                            Safety                                     Properties                                  Community

                                                                                                     Government tenants
       Customers

     2021 Business
         Mix(1)                                              85.6%                                         12.3%                                         2.1%
          (% of NOI)

                                     Strong fundamental demand from federal and            Government entities require purpose-         States and localities place high value
    Industry Trends
                                                   state partners                          built facilities and financing flexibility          on reducing recidivism

                                          Critical infrastructure without available           Facility design, construction and         Broad rehabilitative expertise to deliver
    Value Proposition                 alternative capacity, flexible solutions tailored    maintenance expertise. More efficient            customized and flexible program
                                              to government partners' needs               process for developing needed solutions       offerings, includes critical infrastructure

    Core Competency                                                      Ability to develop unique solutions for government partners

                                                                                                 c
                                                                                                                                                                                      4
1      Based on financial results for the quarter ended March 31, 2021
Investor Presentation - First Quarter 2021
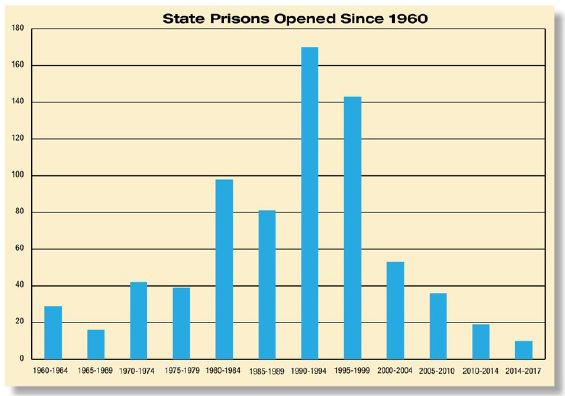
Extensive History of Durable Earnings and Cash Flows
• Long term stable cash flows from government partners due to essential, mission                                                                                                                      ADJUSTED EBITDA ($MM)1                                                                       40%

    critical infrastructure and valued services                                                                                           $500
                                                                                                                                                                                                                                                                                                   35%
                                                                                                                                                                            $441                                                                                                  $444
                                                                                                                                                               $427                      $423                                                  $418
           − 40 year track record of providing government solutions with significant                                                      $400
                                                                                                                                                     $415
                                                                                                                                                                                                       $381            $386        $398                      $388     $396                  $405   30%
              pipeline for growth across the Safety, Properties and Community segments
                                                                                                                                                                                                                                                                                                   25%

           − Strong fundamental demand from investment grade federal and state                                                            $300       25%       25%          25%          24%           23%         23%             23%         22%           22%                                   20%
                                                                                                                                                                                                                                                                      22%         22%       21%
              partners; 99% of EBITDA comes from partners rated AA - or better
                                                                                                                                          $200                                                                                                                                                     15%
           − 95% retention rate in long-dated contracts with average tenure of 25 years
                                                                                                                                                                                                                                                                                                   10%
              for top ten customers                                                                                                       $100
                                                                                                                                                                                                                                                                                                   5%
• Largest private owner of real estate utilized by government agencies with nearly
    18 million square feet of real estate                                                                                                  $-
                                                                                                                                                     2009      2010          2011        2012          2013            2014         2015       2016          2017     2018        2019      2020
                                                                                                                                                                                                                                                                                                   0%

                                                                                                                                                                                                    Prior C-Corp Era          REIT Era      EBITDA Margin

                                                        NET INCOME ($MM)2                                                                                                    STOCK BUYBACKS, DIVIDENDS AND LEVERAGE ($MM)

                                                                                                                                                                                                                                                             Since 2009, CXW has delivered
                                                $301                                                                                                                                                                                                        $2.2bn in buybacks and dividends
                                                                                                                                           $300
                                                                                                                                                                                                                                                             which represents >200% of the         7.8x
                                                                                                                                                                                                                                    $251        $256               current market cap3
                                                                       $222                                                                $250                               $237                                     $234                                                                        6.8x
                                                                                   $220
                                                           $195                                                                                                                                                                                                       $204         $210
                                                                                                                  $189                                                                                                                                       $200                                  5.8x
                                                                                            $178                                           $200
   $155        $157       $163       $157                                                              $159                                                                                             $164
                                                                                                                                                                 $146                                                                                                                              4.8x
                                                                                                                                           $150                                                                                                                       4.0x
                                                                                                                                                                                                                                    3.5x                     3.6x                  3.7x     3.7x
                                                                                                                                                      $108                                              3.2x                                    3.4x                                               3.8x
                                                                                                                                                                                                                       3.1x
                                                                                                                                           $100                  2.7x         2.8x
                                                                                                                                                      2.8x                                2.6x
                                                                                                                              $54                                                                                                                                                           $106   2.8x

                                                                                                                                             $50
                                                                                                                                                                                           $60                                                                                                     1.8x

    2009       2010       2011       2012        2013       2014       2015        2016      2017       2018       2019       2020              $-                                                                                                                                                 .8x
                                                                                                                                                      2009       2010         2011         2012          2013           2014         2015       2016          2017    2018         2019     2020

Source:    Company Management
                                                    Prior C-Corp Era          REIT Era
                                                                                                                                     c                                  Prior C-Corp Era Buybacks         Prior C-Corp Era Dividend           REIT Era Dividend      Total Leverage Ratio
Note:      Total leverage ratio calculated using total net debt excluding non-recourse debt; EBITDA adjusted for unrestricted subsidiaries
1.         For reconciliation of the non-GAAP figures, Adjusted EBITDA to Net Income, the most directly comparable GAAP measure, see the Appendix to this presentation
2.         2013 Net Income includes $138mm income tax benefit for reversal of deferred taxes due to REIT conversion. 2020 Net Income includes $74mm in non-cash impairment charges and losses on sale or real estate asset.                                                                 5
3.         Market cap as of 6/1/2021
Investor Presentation - First Quarter 2021
Current Financial Performance
                                                                                                March 31,                            December 31, September 30,                                                                 June 30,                            March 31,
     For the quarter ended                                                                        2021                                   2020         2020                                                                        2020                                2020
     Adjusted Diluted EPS(1)                                                                          $0.24                                     $0.30                                     $0.21                                     $0.23                             $0.23
     Normalized FFO Per Share(1)                                                                      $0.44                                     $0.53                                     $0.44                                     $0.47                             $0.46
     AFFO Per Share(1)                                                                                $0.47                                     $0.48                                     $0.41                                     $0.48                             $0.50
     Adjusted EBITDA (in $MM)                                                                     $96.3MM                                 $108.7MM                                   $94.6MM                                  $101.1MM                              $100.4MM
     Debt Leverage                                                                                      3.7x                                      3.5x                                      4.2x                                     4.2x                             4.3x
     Net Cash Provided By Operating
     Activities (in $MM)                                                                          $99.6MM                                   $74.0MM                                 $107.2MM                                   $98.9MM                              $75.4MM

       COVID-19 has caused a significant impact on utilization from Immigration and Customs
                  Enforcement, but our earnings and cash flows remain strong

                                                                                                                                        c
                                                                                                                                                                                                                                                                              6
1.      Per share amounts for the quarterly periods in 2020 represent pro forma amounts reflecting a tax provision following CoreCivic's revocation of its REIT election in the first quarter of 2021. See explanatory note and pro forma calculation on page 29.
Conservative Balance Sheet to Support Long-Term Strategy

 Significant liquidity of approximately $755
  million as of March 31, 2021
                                                                                                                       35.7%                                               3.8x
                                                                                                                   Net Debt/
                                                                                                                                                               Fixed Charge Coverage(1)(2)
                                                                                                           Undepreciated Fixed Assets

 Strong cash flow to reduce debt leverage
  to target of 2.25x to 2.75x net debt-to-                                                                               3.7x                                              87%
                                                                                                                                                                      Unencumbered
                                                                                                           Debt-to-Adjusted EBITDA(1)(2)
  adjusted EBITDA                                                                                                                                                        Assets

 Credit Ratings: S&P: BB- Moody's: Ba2                                                                                  56%                                               5.6x
                                                                                                             Net Debt to Total Market
                                                                                                                                                                 Interest coverage ratio
                                                                                                                  Capitalization

       In April 2021, we closed on the offering of $450 million senior unsecured notes due
        2026. Net proceeds were used to pay off our $250 million notes due October 2022
                    and approximately $150 million of our notes due May 2023
                                                                                                    c
  1.   Based on financial results for the quarter ended March 31, 2021.
  2.   Excludes non-recourse debt and related EBITDA of CoreCivic of Kansas, LLC and SSA-Baltimore, LLC, as both are Unrestricted Subsidiaries as defined under the Revolving Credit Facility.
                                                                                                                                                                                                 7
Debt Maturity Schedule Following April 2021 Bond Issuance
                  Debt Maturity Schedule - March 31, 2021                                                                    Debt Maturity Schedule - March 31, 2021 Pro Forma For Debt Issuance
                                                (In $ millions)                                                                                            (In $ millions)
$1,000                                     $570.0
                                                                                                                    $1,000
 $900                                                                                                                $900
 $800                                                                                                                $800                         $400.0

 $700                                                                                                                $700
 $600                                                                                                                $600
                                                                                                                                                                                     $465.5
 $500                                                                                                                $500
 $400                                                                                                                $400
                            $293.0
 $300                                                                                             $266.4
                                                                                                           $227.9    $300                                                                      $266.4
                                                                                                                                                                                                        $227.9
                                                          $194.9                                                                                              $194.9
 $200                                                                                                                $200
 $100         $29.1                                                       $14.6          $15.5                       $100       $29.1    $43.0                               $14.6
    $0                                                                                                                  $0

         Revolver                   Term Loan A                           Other Debt Maturities                                     Revolver      Term Loan A                Other Debt Maturities

         Extended our weighted-average maturity schedule from 5.3 years to 6.0 years
                 with our $450 million unsecured
                                               c bond offering in April 2021
                                                                                                                                                                                                        8
  1.      The maturity of the Bank Credit Facility in 2023 is net of cash as of March 31, 2021.
Sale of Non-Core Real Estate Assets
• As part of the decision to convert to a C-Corp the Company has pursued the sale of certain non-core
  real estates assets
  ‒ All 47 assets are outside of correctional real estate and leased to government agencies
  ‒ NOI of $30mm for the portfolio
  ‒ Initial estimates were that the portfolio could generate up to $150mm in net proceeds, following related debt
    repayment
• In December 2020, the Company sold 42 properties within the portfolio, representing 573,000 SF,
  for $106.5mm
  ‒ Net proceeds of approximately $30mm generated, following related debt repayment
  ‒ 4 assets held for sale, representing an additional 1.1mm SF of real estate, with a net book value of $281.5
    million
• The Company remains confident in the portfolio generating up to $150mm in net proceeds

              Net cash proceeds from asset sales
                                           c
                                                 will be utilized to repay debt
                                                                                                                    9
Market Updates & Recent Developments
Our Value Proposition to Our Government Partners Remains Strong…
                      CoreCivic provides tailored solutions to meet the needs of state and federal partners

                                    State Partners                                                                               Federal Partners
• Key State Partner Challenges:                                                                   • Key Federal Partner Challenges:
     Prison over-crowding                                                                           Limited owned infrastructure
     Aging and insufficient infrastructure
                                                                                                     Constantly shifting geographic and population needs
     Budgetary constraints
                                                                                                     Appropriate setting for detainees
• CoreCivic estimates $15 - $20 billon infrastructure pipeline throughout US prison
  system                                                                                          • Mission Critical Infrastructure for ICE and USMS
• Kansas:                                                                                            ICE: ~95% of detainee capacity is outsourced
   Constructed a built-to-suit facility for Kansas DOC to replace 150+ year old Lansing             USMS: ~80% of detainee capacity is outsourced
     Correctional Facility (completed in January 2020)
     • Inmates in the original state-run prisons were suffering from poor conditions, with           The Company estimates construction of equivalent new government capacity would
       small cells and no air conditioning                                                            require Congressional approval and budget of $25+ billion
• Alabama:                                                                                        • Flexible Capacity to respond quickly to ever-changing real estate needs
     Multi-year civil rights investigation by the Justice Department over the conditions in
                                                                                                     Location needs change based on law enforcement priorities and varying trends in
      its state-run prison system (182% capacity)
                                                                                                      different jurisdictions
     For the last 3 years the state legislature has failed to approve a $1 billion plan to
      construct new correctional facilities. Now, actively pursuing $900 million, 10,000+         • Appropriate Setting for civil detainees
      bed procurement with private sector financing                                                  Lack of ICE and USMS infrastructure means most alternatives to private facilities are
     We recently signed two 30-year lease agreements for the development of new prison               local jails
      facilities for the state, subject to close of project-specific financing
                                                                                                       • Local jails often co-mingle ICE or USMS populations with their inmate populations
• Wisconsin, Vermont, Idaho, Wyoming, Kentucky, Nebraska, Hawaii:
     Exploring private sector solutions to address criminal justice infrastructure needs                  • Making many local facilitates unable to meet Performance-Based National
                                                                                              c              Detention Standards (PBNDS) for ICE and federal detentions standards for
                                                                                                             USMS
                                                                                                                                                                                          11
…And Has Resulted in Many New Contract Wins
                                                                        New Contract Awards
      Date                                                                                        Details
                  The state of Alabama awarded two new 30-year lease agreements for the development of two correctional facilities, to be operated by the Alabama Department of
 February 2021
                  Corrections, pending the close of project-specific financing. Construction of both facilities will contain an aggregate of approximately 7,000 beds.
                  The Federal Bureau of Prisons (BOP) enters into a new contract for residential reentry and home confinement services at our 289-bed Turley Residential Center
  October 2020
                  and 494-bed Oklahoma Reentry Opportunity Center, both in Oklahoma.
                  The U.S. Marshals Service (USMS) enters into a new contract for our 1,692-bed Cimarron Correctional Facility in Cushing, Oklahoma. We expect an improvement
 September 2020   in facility net operating income at this facility as a result of the new contract, with annual revenues increasing to approximately $30 million at current utilization
                  levels and higher operating margins than the previous facility contract with the State of Oklahoma.
                  The state of Idaho enters into a new contract to house up to 1,200 offenders initially at our 1,896-bed Saguaro Correctional facility in Arizona and other facilities by
  August 2020
                  mutual agreement.
 February 2020    The state of Mississippi expands its contract at the Tallahatchie County Correctional Facility to up to 1,000 beds
  January 2020    The state of Mississippi enters into a 375-bed emergency contract at our 2,672-bed Tallahatchie County Correctional Facility
 December 2019    The Commonwealth of Kentucky enters into a new lease agreement for our 656-bed Southeast Correctional Complex in Kentucky
                  Immigration and Customs Enforcement (ICE) enters into a new contract to house adult detainees at our 2,232-bed Adams County Correctional Center in
  August 2019
                  Mississippi
                  The state of Kansas enters into a new contract to house up to 600 offenders initially at our 1,896-bed Saguaro Correctional Facility in Arizona and other facilities by
  August 2019
                  mutual agreement
   May 2019       The USMS enters into a new contract to house offenders at our 1,422-bed Eden Detention Center in Texas
   May 2019       ICE enters into a new contract to house adult detainees at our 910-bed Torrance County Detention Facility in New Mexico

 These 11 new contracts, awarded or activated in the two years ended December 31,
  2020, represent a total of approximately 10,000 beds across 9 existing CoreCivic
                                         c
    facilities and for the development of 2 new facilities representing 7,000 beds
                                                                                                                                                                                             12
Core Value is in the Real Estate, But Our Business Model is Flexible
    We have been responsive to the needs of our government partners and those needs have evolved over our nearly 40
    year history
                     Early Stages                                               Rapid Growth Phase                                                                             Current Market
    • Operational Cost Efficiencies                                 • Rapid Population Growth & Lack of                                 • Inmate Population Growth Slows  Reduction in the need for new facility
      Private sector operating existing government                     Appropriations for New Capacity                                     construction to expand capacity & increasingly competitive market in the Managed-
      owned facilities (Emergence of Managed-                            Our federal and state partners increasingly                        Only business compresses margins (Exit Managed-Only Model)
      Only Model)                                                        found it difficult to receive sufficient funding to             • Aging Correctional Infrastructure  Existing stock of government owned
    • Rapid Population Growth  New                                      meet their capacity needs, which led to the                        correctional facilities have reached the end of their useful life. Appropriations for
      government owned facility construction with the                    private sector delivering a real estate solution                   replacement capacity remains unavailable, but our partners have a desire to
      private sector providing the operations                            (Growth of Owned/Managed Model)                                    maintain government operations (Emergence of Lease-Only Model)
      (Expansion of Managed-Only Model)                              • Continuing Federal Needs  Federal                                • Existing Capacity  Privately owned correctional infrastructure provides
    • Emerging Federal Needs  Federal law                               law enforcement agencies continued to have                         mission-critical capacity to our government partners (Continuation of
      enforcement agencies had emerging capacity                         expanded capacity needs, and they did not                          Owned/Managed Model)
      needs (Emergence of Owned/Managed                                  have a desire to operate detention facilities
                                                                         (Growth of Owned/Managed Model)                                 • Continuing Federal Needs  Federal law enforcement agencies continue
      Model)
                                                                                                                                            to depend on the real estate provided by the private sector and are not interested
                                                                                                                                            in changing their law enforcement mission (Continuation of Owned/Managed
                                                                                                                                            Model)
    Real Estate continues to be the biggest challenge to our government partners due to the high cost of construction, but
    some partners are interested in government controls of the day-to-day facility operations. This led to the creation of
    the lease-only model provided in our CoreCivic Properties segment.

      We have successfully converted multiple facilities from an owned/operated model in
                                            c
       our Safety segment to the lease-only model provided in our Properties segment1
                                                                                                                                                                                                                            13
1      CoreCivic currently leases to states our California City Correctional Center, Southeast Correctional Complex and North Fork Correctional Facility, each of which was previously Company operated.
Our Real Estate is Flexible for Alternative Uses
We have a well established recent history of repurposing facilities for alternative government partners:
                                      Facility
              Facility                               State                                                       Details
                                      Capacity
   Cimarron Correctional Facility     1,692 beds   Oklahoma      In August 2020, the State of Oklahoma ended their contract due to budget shortfalls. The facility
                                                                 transitioned to a new contract with the USMS in September 2020.
 Adams County Correctional Center     2,232 beds   Mississippi   In August 2019, the BOP ended their contract due to a competitive rebid process. The facility
                                                                 transitioned to a new contract with ICE the same month.
      Eden Detention Center           1,422 beds     Texas       In April 2017, the BOP ended their contract due to declining capacity needs and the facility was idled.
                                                                 The facility was reactivated in June 2019 under a new USMS contract.
   La Palma Correctional Center       3,060 beds    Arizona      In June 2018, the State of California ended their contract due to declining capacity needs. The facility
                                                                 transitioned to a new contract with ICE in July 2018.
 Cibola County Corrections Center     1,129 beds   New Mexico    In August 2018, the BOP ended their contract due to declining capacity needs. The facility
                                                                 transitioned to a new contract with ICE in September 2018.
 Torrance County Detention Facility   910 beds     New Mexico    In October 2017, we elected to end our contract with the USMS to optimize utilization at other
                                                                 facilities. The facility was reactivated in May 2019 under a new ICE contract.
  Tallahatchie County Correctional                               In June 2018, the State of California ended their contract due to declining capacity needs. The facility
                                      2,672 beds   Mississippi   transitioned to a series of new contracts with federal, state and local partners. Today the facility cares
               Facility
                                                                 for individuals from USMS, Vermont, South Carolina, and Tallahatchie County.
                                                                 In November 2015, the State of California ended their contract due to declining capacity needs. In
  North Fork Correctional Facility    2,400 beds   Oklahoma      July 2016, the State of Oklahoma entered into a lease agreement for the facility. The facility has
                                                                 served nine different state partners over its operating history: California, Colorado, Hawaii, Idaho,
                                                                 Oklahoma, Vermont, Washington, Wisconsin and Wyoming.

            The flexibility of our real estate assets to quickly be repurposed to serve
                                                 c
            other government partners reflects the serious corrections infrastructure
                       challenge facing the country's corrections systems                                                                                         14
America's Prisons: The Aging Infrastructure Crisis
  "There are almost 500 prisons nation wide built between 1980
      and 2000 that need major upgrades, repurposing, or
replacement…With the prison infrastructure challenges at an all-
time high, we may be entering the next prison building boom, as
     states are being forced to replace their older prisons."

                                                                   • The majority of America's inmates are
                                                                     housed in facilities that are 25 to 40 years
                                                                     old

                                                                   • Public prison facilities will typically need to
                                                                     replace major components of infrastructure
                                                                     around the 20 year mark

                                                                   • As a result of delayed/deferred
                                                                     maintenance capital spending, many states
                                                                     are now facing the expensive
                                                                     consequences of this neglect
                                                               c
     Source: Correctional News, March/April 2018 Publication
                                                                                                                       15
Potential Growth Channels & Opportunities
Multiple opportunities in the market to drive future growth, many of which can be realized due to our recent decision to
convert to a taxable C-Corp, allowing CoreCivic to fund future growth initiatives with internally generated cash flows

 1                                                                                                                              2
                    Properties Segment                                                                                                            Correctional Services
 • Design, construct, build, finance criminal justice properties                                                                 • Meet increasing partner needs for healthcare services critical
     for lease to government entities                                                                                               to the well-being of residents and inmates, including chronic
                                                                                                                                    care management and mental health and substance abuse
     – Easy, low-cost alternative for federal, state and
                                                                                                                                    services
       municipal governments to modernize outdated
       infrastructure                                                                                                            • Expand electronic monitoring services that partners view as
                                                                                                                                    an incarceration alternative for low risk populations and as a
     – Favorable financing readily available for a wide range of
                                                                                                                                    tool to reduce overcrowding
       development opportunities
 •   Current market opportunity with the state of Alabama                                                                        • Currently have 6,826 beds available in idle Safety facilities to
                                                                                                                                    respond to emerging partner needs

                                                           3
                                                                                      Recycling of Capital
                                                           • Sale of non-core properties to provide capital for increased investment in
                                                               higher-returning opportunities
                                                               – Opportunity to capitalize on significant valuation arbitrage and produce cash
                                                                 for alternative uses – Estimate up to $120 million in additional net proceeds
                                                                                                c
                                                                 after debt reduction from current government leased portfolio
                                                           •   CoreCivic estimates $15 - $20 billon infrastructure pipeline throughout the US
                                                               prison system                                                                                                                          16
Impact of COVID-19
The COVID-19 global pandemic has had a significant impact on our day-to-day operations. We provide on our
website weekly updates to allow stakeholders to see how we are managing the crisis while supporting our
employees, communities, and those in our care.

Our financial performance has also been impacted due to lower occupancy levels in our facilities, particularly in
utilization by ICE
      • CoreCivic's daily ICE population as of December 31, 2019 was 10,500 compared with 3,100 as of
          December 31, 2020
      • As of March 31, 2021, our daily ICE population increased to 5,300, still well below historical averages
The outsized impact to ICE has been the result of public health related actions taken by the federal government
since the onset of the pandemic
      • March 23, 2020: The Department of Homeland Security (DHS) announced it reached an agreement with
          Canada and Mexico to limit all non-essential travel across borders
           This order included that DHS will no longer detain illegal immigrants in holding facilities, like those provided by
            CoreCivic, and will immediately return the individuals to the country from which they entered
     • The order has continued to be extended in 30 day increments since its announcement
     The wide availability of multiple viable COVID-19 vaccines is expected to
                                             c
        accelerate the reopening of our international borders, but it is still
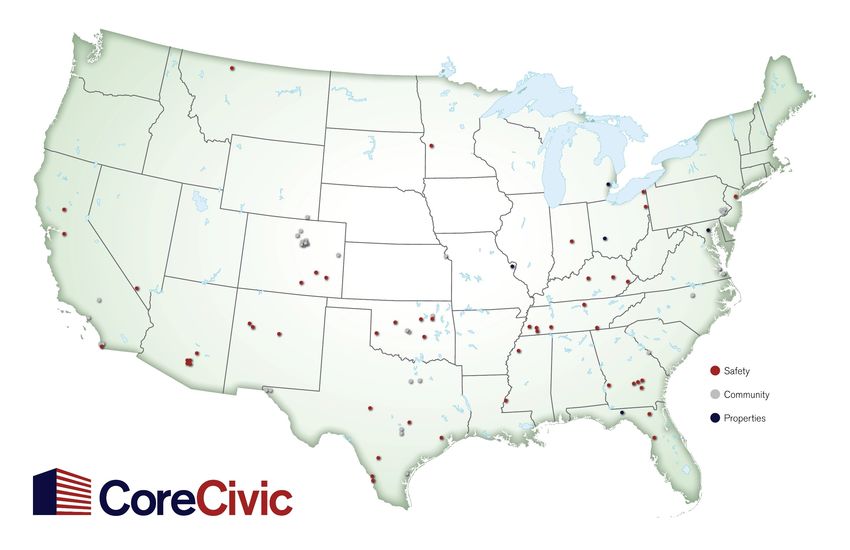
          unclear how the distribution of the vaccines will be prioritized                                                        17
Southwest Border Apprehensions Remain Elevated
• Even though the international
  borders are effectively shutdown
  to non-essential travel,
  apprehension rates along our
  Southwest border remains
  elevated

• Any lifting of restrictions on non-
  essential travel is expected to
  drive up activity at the border

                                                                                    c
                                        Source: U.S. Customs and Border Protection – Southwest Border Migration
                                                                                                                  18
Unprecedented Commitment to ESG within the Corrections Industry
•     CoreCivic released the Company's third Environmental, Social and Governance (ESG) report in May 2021, demonstrating our continued
      commitment to transparency and accountability and providing more robust disclosures to show how we better the public good every day
•     The report details how the company is helping to tackle the national crisis of recidivism and provides quantified evidence of progress being made
      toward company-wide reentry goals
•     The Company actively supports policies aimed to improve the opportunities available to its residents upon reentry
       Ban the Box (a.k.a. “fair-chance”) legislation designed to eliminate hiring practices that discriminate against rehabilitated justice-involved
           persons
       Pell Grant restoration, Voting rights restoration, Licensure reform policies to improve reentry opportunities for formerly incarcerated
           individuals
•     Go Further is an evidence-based process that unites our staff and those planning for reentry to produce successful outcomes
      • After careful assessment, a life plan is developed to address potential barriers to reentry such as educational needs and substance use
           disorders
•     Initial primary focus was on social-related metrics and increased transparency
      • Market perception already experiencing positive impact:

      ISS Corporate Solutions Quality Score – April 2021(1)
      Social                                            2
                                    Higher Disclosure                                                  Lower Disclosure

      Governance                                                 4
                                    Lower Risk                                                              Higher Risk

      Environmental                                                       5
                                    Higher Disclosure                                                  Lower Disclosure

                                                                                              c
Note: To view CoreCivic's ESG Report click here: https://www.corecivic.com/hubfs/_files/2020-ESG%20Report.pdf                                             19
(1)   Source: ISS Corporate Solutions
Company's ESG Focus Benefits All Stakeholders
                                      Holistic Approach Toward Preparing Inmates for Successful Reentry…
                              More Humane Conditions                                                                Focus on Rehabilitation & Reentry
      • Reduced Overcrowding                                                                            • Ban the Box
      • Modern Real Estate Amenities                                                                    • Education & Vocational Training
      • Improved Medical Programs                                                                       • Treatment and Behavioral Programs
      • Facilities and Open Spaces                                                                      • Victim Impact Programs
      • Better Security                                                                                 • Chaplaincy and Religious Services
                  99.5%: Average Facility ACA Audit Score                                                  Evidence Based Programs with Measurable Goals

                                                       …While Serving the Needs of Broader Stakeholders
                Government Partners                                                           Taxpayers                                     Community
 • Facilities appropriate for inmates /                                • Long run cost savings: 12%- 58%(1)                  • Partner to 500+ small businesses
   detainees                                                           • New construction:                                   • CoreCivic Foundation provides cash
 • Adapts quickly to shifting population                                    25%(1) cost savings                               contribution and service hours to
   and geographic needs                                                                                                        numerous charitable organizations
                                                                            ~40%(1) time reduction                            focused on building strong communities
 • Built-to-Suit capabilities
                                                                                                 c
(1)   The Independent Institute, "Prison Break: A New Approach to Public Cost and Safety," June 2014.                                                                   20
CoreCivic's Quality Assurance and Government Oversight
CoreCivic facilities’ operations are subject to
significant oversight and accountability measures,
both internally and externally. Many of CoreCivic’s
government partners maintain full-time, on-site
monitors to promote transparency and ease of
communication. CoreCivic is subject to routine
oversight and performance requirements based on
a combination of rigorous contract, accreditation
and government-established performance
standards.
Our management approach is overseen by the vice
president, Quality Assurance (QA) who provides
regular reporting to senior management and the
board of directors. The staff dedicated to quality
assurance at our corporate headquarters and
embedded throughout our facilities maintain polices
and procedures to manage compliance with a broad Over 1,000 on-site contract monitors and government
range of contractual and regulatory requirements.
                                                    partner employees have continuous oversight of our
                                                     c
                                                       facilities to help ensure compliance
                                                                                                     21
CoreCivic's Quality Assurance and Government Oversight
CoreCivic facilities also are subject to a range of other audit and inspection processes, based on facility mission,
location and contractual and regulatory requirements:
  • CoreCivic Safety facilities that maintain American Correctional Association (“ACA”) accreditation undergo audits by
    independent auditors trained and assigned by the ACA on a three-year cycle. ACA audits review all facets of correctional
    operations, including inmate/resident health care.
  • All CoreCivic Safety and Community facilities are subject to auditing on a three-year cycle for compliance with the Prison Rape
    Elimination Act (“PREA”).
  • Some CoreCivic Safety facilities require accreditation by the National Commission on Correctional Health Care (“NCCHC”), an
    independent organization that reviews health care operations in correctional environments.
  • CoreCivic facilities with federal populations are periodically audited by the Office of Federal Contract Compliance Programs
    (“OFCCP”) of the United States Department of Labor.
  • CoreCivic facilities are subject to inspections related to state and local requirements in areas such as fire safety and food
    service.
  • Several CoreCivic facilities are subject to inspection in connection with oversight of our government partner agencies by other,
    independent government agencies, such as the U.S. Department of Justice Office of Inspector General (BOP and USMS),
    Department of Homeland Security (DHS) Office of Inspector General (ICE), DHS Office of Detention Oversight, and DHS Office
    for Civil Rights and Civil Liberties.
  • CoreCivic employees have access to government inspectors general and similar offices for purposes of reporting fraud, waste
    and other forms of misconduct in connection with government contracts, and such offices typically have authority, by law or by
    contract, to investigate our operations and the conduct of our c employees and agents.
                                                                                                                                       22
Operational Transparency Through Multiple Levels of Oversight
Quality Assurance Audit                        Hotlines                                          On-Site Contract Monitors                       Accrediting Organizations
The quality assurance division,                Residents, employees, and visitors have           Many of our facilities have government          The American Correctional Association
independent from operations, audits each       access to 24/7 hotlines to report any             agency employees physically on-site to          and National Commission on Correctional
Safety facility annually on an unannounced     concerns or allegations of misconduct,            provide daily oversight and monitoring of       Health Care conduct audits as
basis using specifically tailored audit        including: inmate concerns hotline,               facility operations.                            independent accrediting organizations.
instruments designed to assess                 CoreCivic ethics line, national sexual
compliance with partner expectations and       assault hotline and various agency Office
contract requirements.                         of Inspector General hotlines.

Public Tours and Visits                                                                                                                          Non-Correctional Certifications
Our facilities are frequented by members of                                                                                                      and Related Inspections
the public, including: residents’ family and                                                                                                     Our facilities are inspected by relevant
friends, community volunteers, journalists,                                                                                                      officials, including: food safety, fire safety,
attorneys, elected officials, NGOs and                                                                                                           occupational safety and public health.
other interested parties.

PREA Audits                                    Regular Reporting                                 Independent Government                          Government Agency Audits
Independent, certified PREA auditors           Depending on government agency areas              Agency Oversight Audits                         Government agencies often require
conduct audits to ensure compliance with       of interest, CoreCivic facilities regularly       Government agencies partnering with             CoreCivic to apply their preferred set of
sexual abuse prevention requirements.          report on a range of topics from serious          CoreCivic are subject to independent            operational standards. CoreCivic is audited
                                               incident occurrences to personnel                 review of their oversight efforts, including:   against these standards by the agency,
                                               changes.                                          the Office of Inspector General for federal     including ICE PBNDS, USMS FPBDS,
                                                                                                 departments and various state agency            BOP inspection tool and various state audit
                                                                                                 oversight divisions.                            tools.

                                                                                             c
                                                                                                                                                                                                   23
Highly Qualified, Proven Management Team
             Damon T. Hininger                                               David Garfinkle                                                Tony Grande
             President and Chief Executive Officer                           EVP and Chief Financial Officer                                EVP and Chief Development Officer
             • 25+ years of corrections experience                           • Began at CoreCivic in 2001                                   • Began at CoreCivic in 2003
             • Began at CoreCivic in 1992 as                                 • Former experience in REITs, public                           • Assists in finding solutions to tough
               Correctional Officer                                            accounting and holds CPA certification                         government challenges
             • Active in community: United Way,                              • Active in community: Junior                                  • Formerly served as Tennessee's
               Nashville Chamber of Commerce, Boy                              Achievement of Middle Tennessee-                               Commissioner of Economic and
               Scouts                                                          Finance & Executive Committees, St.                            Community Development
                                                                               Matthew Church lector

  Patrick Swindle                                    Lucibeth Mayberry                                  David Churchill                                       Cole Carter
  EVP and Chief Corrections                          EVP, Real Estate                                   EVP and Chief Human                                   EVP and General Counsel
  Officer                                                                                               Resources Officer
                                                     • Began at CoreCivic in 2003                                                                             • Began at CoreCivic in 1992
  • Began at CoreCivic in 2007                       • Responsible for the full range                   • Began at CoreCivic in 2012                            as Academic Instructor
  • Prior experience in sell-side                      of real-estate services,                         • Has over 30 years of experience                     • President of CoreCivic Cares
    equity research and finance                        including acquisitions, design                     in human recourses, talent                            Fund
    department at CoreCivic                            & construction, and                                management, and organizational                      • Juris Doctor – Nashville
                                                       maintenance                                        development.                                          School of Law
                                                     • Prior experience in legal and
                                                       business development

                           Variety of experience and unwavering
                                                      c c        commitment to
                                  rehabilitation and combating recidivism                                                                                                             24
Diverse Board of Directors with Relevant Expertise

Mark A. Emkes                  Donna M. Alvarado              Robert J. Dennis               Damon T. Hininger             Stacia Hylton                    Harley G. Lappin
• Chairman of the Board        • Founder and President,       • Former Chairman and CEO,     • President and CEO,          • Principal, LS Advisory         • Previous EVP, CoreCivic
• Former Executive,              Aguila International           Genesco                        CoreCivic                   • Former Director, US Marshals   • Former Director, Federal
  Bridgestone                  • Joined: 2003                 • Joined: 2013                 • Joined: 2009                • Joined: 2016                     BOP
• Joined: 2014                                                                                                                                              • Joined: 2018

                Anne L. Mariucci               Thurgood Marshall, Jr.        Devin I. Murphy                  Charles L. Overby            John R. Prann, Jr.
                • Career in real estate        • Partner, Morgan, Lewis &    • President, Phillips Edison &   • Former CEO, Freedom        • Former CEO, Katy Industries
                • Former President, Del Webb     Bockius LLP                   Company                          Forum                      • Joined: 2000
                  Corp.                        • Joined: 2002                • Joined: 2018                   • Joined: 2001
                • Joined: 2011

                Experience in executive leadership, real
                                                     c   estate, rehabilitation, corrections,
                            media, legal, government affairs, and technology                                                                                                       25
Appendix
Reconciliation to Adjusted Diluted EPS
                                                                                                                    For the Three Months Ended
                                                                                March 31,           December 31,          September 30,           June 30,                March 31,
($ in thousands, except per share amounts)
                                                                                  2021                  2020                  2020                  2020                    2020
Net income (loss) attributable to common stockholders                                ($125,568)            ($26,803)               $26,717              $22,186                 $32,057
Non-controlling interest                                                                        -                   -                     -                       -                   1,181
Diluted net income (loss) attributable to common stockholders                        ($125,568)            ($26,803)               $26,717              $22,186                 $33,238

Special Items:
     Expenses associated with debt repayments and refinancing transactions                      -             7,141                       -                       -                       -
     Expenses associated with mergers and acquisitions                                          -                   -                     -                       -                    338
     Expenses associated with COVID-19                                                      1,598             2,792                  2,820                   8,165                        -
     Expenses associated with changes in corporate tax structure                                -              195                   4,698                     347                        -
     Income taxes associated with change in corporate tax structure and other
                                                                                      114,249                       -                     -                       -                   3,085
       special tax items
     Contingent consideration for acquisition of businesses                                     -                   -                  620                        -                       -
     Loss (gain) on sale of real estate assets                                                  -            17,943                 (2,102)                  (2,818)                      -
     Shareholder litigation expense                                                    51,745                       -                         -                       -                   -
     Asset impairments                                                                      1,308            47,570                    805               11,717                        536
     Income tax expense (benefit) for special items                                   (14,060)                      -                  532                        -                       -
Adjusted net income                                                                   $29,272               $48,838                $34,090              $39,597                 $37,197

Weighted average common shares outstanding – basic                                    119,909               119,636                119,632              119,630                 119,336
Effect of dilutive securities:
     Restricted stock-based awards                                                           115                   56                     6                      2                      47
     Non-controlling interest – operating partnership units                                 1,342             1,342                  1,342                   1,342                    1,342
Weighted average shares and assumed conversions – diluted                             121,366               121,034                120,980              120,974                 120,725

Adjusted Earnings Per Basic Share                                                           $0.24             $0.41                  $0.28                   $0.33                    $0.30

Adjusted Earnings Per Diluted Share
                                                                                              c
                                                                                            $0.24             $0.40                  $0.28                   $0.33                    $0.30

                                                                                                                                                                                              27
Calculation of FFO, Normalized FFO and AFFO
                                                                                                               For the Three Months Ended
                                                                        March 31,               December 31,         September 30,          June 30,                March 31,
($ in thousands, except per share amounts)
                                                                          2021                      2020                 2020                 2020                    2020
Net income (loss)                                                            ($125,568)                ($26,803)              $26,717             $22,186                 $33,238
Depreciation and amortization of real estate assets                            23,759                    27,447                28,249              28,244                  28,106
Impairment of real estate assets                                                    1,308                 4,225                       -                9,750                     405
Loss (gain) on sale of real estate assets                                               -                17,943                (2,102)                 (2,818)                      -
Income tax expense (benefit) for special items                                      (350)                      -                     532                        -                   -
  Funds From Operations                                                     ($100,851)                  $22,812               $53,396             $57,362                 $61,749
Expenses associated with debt repayments and refinancing transactions                   -                 7,141                       -                     -                       -
Expenses associated with mergers and acquisitions                                       -                      -                      -                     -                    338
Contingent consideration for acquisition of businesses                                  -                      -                  620                       -                       -
Expenses associated with COVID-19                                                   1,598                 2,792                 2,820                  8,165                        -
Expenses associated with changes in corporate tax structure                             -                  195                  4,698                    347                        -
Income taxes associated with change in corporate tax structure and
                                                                              114,249                          -                      -                     -                   3,085
    other special tax items
Shareholder litigation expense                                                 51,745                          -                      -                     -                       -
Goodwill and other impairments                                                          -                43,345                   805                  1,967                     131
Income tax benefit for special items                                          (13,710)                         -                      -                     -                       -
  Normalized Funds From Operations                                            $53,031                   $76,285               $62,339             $67,841                 $65,303
Maintenance capital expenditures on real estate assets                          (2,535)                 (12,375)               (9,785)                 (5,691)              (2,619)
Stock-based compensation                                                            4,213                 4,253                 4,082                  4,319                    4,610
Amortization of debt costs                                                          1,566                 1,383                 1,396                  1,384                    1,356
Other non-cash revenue and expenses                                                 1,064                 1,258                 1,241                  1,469                    1,657
  Adjusted Funds From Operations                                              $57,339                   $70,804               $59,273             $69,322                 $70,307
Funds from operations per diluted share                                        ($0.83)                    $0.19                 $0.44                  $0.47                    $0.51
Normalized funds from operations per diluted share                                  $0.44   c             $0.63                 $0.52                  $0.56                    $0.54
Adjusted funds from operations per diluted share                                    $0.47                 $0.58                 $0.49                  $0.57                    $0.58
                                                                                                                                                                                        28
Calculation of Pro Forma FFO, Normalized FFO and AFFO
                                                                                                                             For the Three Months Ended                                                   For the Year Ended
                                                                                          December 31,                 September 30,                  June 30,                    March 31,                  December 31,
($ in thousands, except per share amounts)
                                                                                              2020                         2020                         2020                        2020                         2020
Net income (loss) as reported                                                                        ($26,803)                    $26,717                      $22,186                      $33,238                      $55,338
Expenses associated with debt repayments and refinancing transactions                                   7,141                             -                            -                           -                       7,141
Expenses associated with mergers and acquisitions                                                            -                            -                            -                        338                          338
Contingent consideration for acquisition of businesses                                                       -                         620                             -                           -                         620
Expenses associated with COVID-19                                                                       2,792                        2,820                        8,165                            -                      13,777
Expenses associated with changes in corporate tax structure                                               195                        4,698                         347                             -                       5,240
Deferred tax expense on Kansas lease structure                                                               -                            -                            -                       3,085                       3,085
Goodwill and other impairments                                                                         47,570                          805                       11,717                         536                       60,628
Loss (gain) on sale of real estate assets, net of taxes                                                17,943                       (1,570)                      (2,818)                           -                      13,555
Adjusted Net Income                                                                                  $48,838                      $34,090                      $39,597                      $37,197                    $159,722
Income tax as reported                                                                                  1,203                          369                        (962)                         691                        1,301
Normalized Pre-tax income                                                                              50,041                      34,459                        38,635                       37,888                     161,023
Pro forma income tax expense (C-Corp 27.5% tax rate)                                                 (13,761)                      (9,476)                     (10,625)                     (10,419)                    (44,281)
Pro forma Adjusted Net Income                                                                          36,280                      24,983                        28,010                       27,469                     116,742
Depreciation and amortization of real estate assets                                                    27,447                      28,249                        28,244                       28,106                     112,046
  Pro Forma Normalized Funds From Operations                                                         $63,727                      $53,232                      $56,254                      $55,575                    $228,788

Maintenance capital expenditures on real estate assets                                                (12,375)                      (9,785)                      (5,691)                      (2,619)                    (30,470)
Stock-based compensation                                                                                4,253                        4,082                        4,319                        4,610                      17,264
Amortization of debt costs                                                                              1,383                        1,396                        1,384                        1,356                       5,519
Other non-cash revenue and expenses                                                                     1,258                        1,241                        1,469                        1,657                       5,625
  Pro Forma Adjusted Funds From Operations                                                           $58,246                      $50,166                      $57,735                      $60,579                    $226,726
Pro Forma Adjusted earnings per diluted share                                                           $0.30                        $0.21                        $0.23                        $0.23                       $0.97
Pro Forma Normalized funds from operations per diluted share                                            $0.53                        $0.44                        $0.47                        $0.46                       $1.89
Pro Forma Adjusted funds from operations per diluted share                                              $0.48                        $0.41                        $0.48                        $0.50                       $1.87

                                                                                                                   c
Effective January 1, 2021, CoreCivic revoked its REIT election. As a result, beginning in 2021, the Company is subject to federal and state income taxes on its taxable income at applicable tax rates without the benefit of a tax
deduction for dividends paid. CoreCivic estimates its effective tax rate to be approximately 27.5% using applicable federal and state tax rates. For illustration purposes, CoreCivic has presented the calculations of Adjusted Net
Income, Normalized Funds From Operations, and Adjusted Funds From Operations for each quarter of 2020, pro forma to reflect such metrics applying the estimated effective tax rate. The effective tax rate used for illustration
purposes is only an estimate, and does not necessarily reflect the actual provision for income taxes that would have been reported if the Company had not qualified as a REIT for the year ended December 31, 2020.                    29
Calculation of NOI
($ in thousands)
                                     For the Three Months Ended
                                              March 31,
                                     2021                  2020
Revenue
 Safety                              $   409,769         $    437,765
 Community                                23,658               30,599
 Properties                               21,255               22,679
 Other                                        36                   58
    Total revenues                   $   454,718         $    491,101
Operating Expenses
 Safety                              $   305,427         $    330,737
 Community                                21,100               24,449
 Properties                                6,274                6,954
 Other                                        83                  175
    Total operating expenses         $   332,884         $    362,315
Net Operating Income
 Safety                              $   104,342         $    107,028
 Community                                 2,558                6,150
 Properties                               14,981               15,725
 Other                                       (47)                (117)
   Total Net Operating Income        $   121,834         $    128,786

Net income (loss)                $       (125,568)       $     33,238
Income tax expense                        113,531               3,776
Other (income) expense                        148               (533)
Interest expense, net                      18,428              22,538
General and administrative                 29,530              31,279
Depreciation and amortization              32,712              37,952
Shareholder litigation expense             51,745                   -
Asset impairments                           1,308                 536
Total Net Operating Income           $
                                         c121,834        $    128,786

                                                                         30
Calculation of EBITDA and Adjusted EBITDA
                                                                                                                                                                         For the Twelve
                                                                                                                                        Three Months Ended
                                                                                                                                                                         Months Ended
                                                                                                                                             March 31,
                                                                                                                                                                         December 31,
($ in thousands, except per share amounts)                                                                                            2021              2020                 2020
Net income (loss)                                                                                                                       ($125,568)            $33,238            $55,338
Interest expense                                                                                                                             20,925            24,555               93,453
Depreciation and amortization                                                                                                                32,712            37,952            150,861
Income tax expense                                                                                                                       113,531                3,776                4,386
   EBITDA                                                                                                                                $41,600              $99,521           $304,038

Expenses associated with debt repayments and refinancing transactions                                                                             -                 -                7,141
Expenses associated with mergers and acquisitions                                                                                                 -              338                   338
Expenses associated with COVID-19                                                                                                             1,598                 -               13,777
Expenses associated with changes in corporate tax structure                                                                                       -                 -                5,240
Contingent consideration for acquisitions of businesses                                                                                           -                 -                  620
Loss on sale of real estate assets                                                                                                                -                 -               13,023
Shareholder litigation expense                                                                                                               51,745                 -                     -
Asset impairments                                                                                                                             1,308              536                60,628
   Adjusted EBITDA                                                                                                                       $96,251             $100,395           $404,805

EBITDA from unrestricted subsidiaries                                                                                                        (6,699)           (7,617)              (31,647)
   Restricted Adjusted EBITDA                                                                                                            $89,552              $92,778           $373,158

                                                                                                                                  c
Note:   Reconciliations for prior periods, which are not reconciled to this presentation, can be found on the Company’s website                                                                31
You can also read