Investigation of Remanufactured Product and End- of-Life Product Potentials from End-user perspective - Kalahari ...
←
→
Page content transcription
If your browser does not render page correctly, please read the page content below
ISSN: 0974-5823 Vol. 7 No. 3 March, 2022
 International Journal of Mechanical Engineering

 Investigation of Remanufactured Product and End-
 of-Life Product Potentials from End-user perspective
 Sawankumar Naik
Assistant Professor, Mechanical Engineering Department, SVKM’s NMIMS Mukesh Patel School of Technology Management &
 Engineering,
 Dr. Ravi Terkar
 Professor, Mechanical Engineering Department, SVKM’s NMIMS Mukesh Patel School of Technology Management &
 Engineering,
Abstract:
The environment conscious end-user evinces interest in vending of product when it reaches its End-of-Life and obtaining renewed
product. This paper categorizes the parameters influencing the end-user in facilitating the decisions of customers through the process.
Currently, most governments encourage the manufacturers to reduce the burden on scarce resources by formulating policies
conducive to remanufacturing. However, the challenges of cannibalization of their own new product, efficiency of ensuring good
product return and offering the customer for a mutually profitable can only be addressed by investigation of customer expectations.
Keywords: End-of-Life Product, Remanufacturing feasibility

1. INTRODUCTION
The value instilled in a product goes on decreasing with use and its performance as well as its aesthetics may be affected. When
such a stage is reached, it may be perceived as nearing its “End-of-Life”(EoL). The breakdown may be resolved by repairing or
replacing its components. If the nature of the operations of restoration the EoL product are vested in surface treatment or improving
its look, they may be classified as reconditioning or refurbishing. The developed countries have a market of refurbished products.
However, the current study focuses on manufacturers adapting remanufacturing as a sustainable manufacturing strategy to offer
same warranty on every part of the product equivalent and comparable to new product. The Original Equipment Manufacturer is
best qualified to succeed in remanufacturing as they can ensure maximum benefit by a planned product launch timing with their
product research design efforts (Terkar et al.,2011). The issue of the renewed product offered barging into the new product market
share (product cannibalization) has been a blockade for taking up the implementation of remanufacturing. The changeover requires
adoption of systematic practices to mitigate risks with the approach of prediction of conservation of the value instilled in the product
minimizing the treatment for restoration.. The current investigation aims to compare the relative significance and their sensitive
influence of factors that may drive the conducive remanufacturing strategy.The need in the developing countries where
remanufacturing is still in its nascent stage is to get the management of the manufacturers convinced on the modest benefits to
change their pessimistic outlook towards remanufacturing. To accomplish this objective, the stimuli to remanufacturing must be
acknowledged from viewpoint of the participant who plays a conclusive decision making role – the End user.

2. Factors driving EoL Product for Remanufacturing:
For remanufacturing to be successful, the strategy should support creating benefits for all stakeholders as well as reducing the impact
on environment (Ostlin et.al, 2008). However, its observed that the strategies are formulated more in reaction triggered from
competition rather than from a well-thought obligation to a vision (D’Adamo, I., & Rosa, P.,2016). The employment of
remanufacturing necessitates refitting the procedures beginning from design conception to after sales services. Numerous studies
have been directed on analysis of the socio-economic drivers influencing success of remanufacturing. It’s essential to diagnose that
the organization will contemplate end-user as the solitary stakeholder inducing the verdicts of remanufacturing. It was exemplified
in a previous study that the end-user shifts through three phases in the progression of a product with multiple life cycles: i) Purchaser
of New Product, ii) Vendor of Used Product & iii) Purchaser of Remanufactured product. The outlooks of the end-user change
during these phases (Naik & Terkar,2017)
In the production of any physical merchandise the raw materials utilized as well as the consumables are scarce. Though non-
conventional and renewable energy sources are being utilized recently, the majority of the energy resources used by industry are
still limited in nature. Consumption of high energy by the industry can cause the increase in prices of the energy used by other
section of the society. Thus buying products offering multiple life cycles saves energy costs and conservation of resources resulting
in reduced costs of living (Gutowski, T. G. et.al, 2017). Additionally, the possibility of trading off the product at its End-of-life and
the perception that it’s designed for multiple life cycles may enhance the value of the product profitably to the buyer of original new
products. Various reductions in costs are realized by the management through remanufacturing. Parts of these benefits may be passed
on to the end-user in terms of reduced price for the remanufactured product offered. The price differentiation between the new and

Copyrights @Kalahari Journals Vol.7 No.3 (March, 2022)
 International Journal of Mechanical Engineering
 307
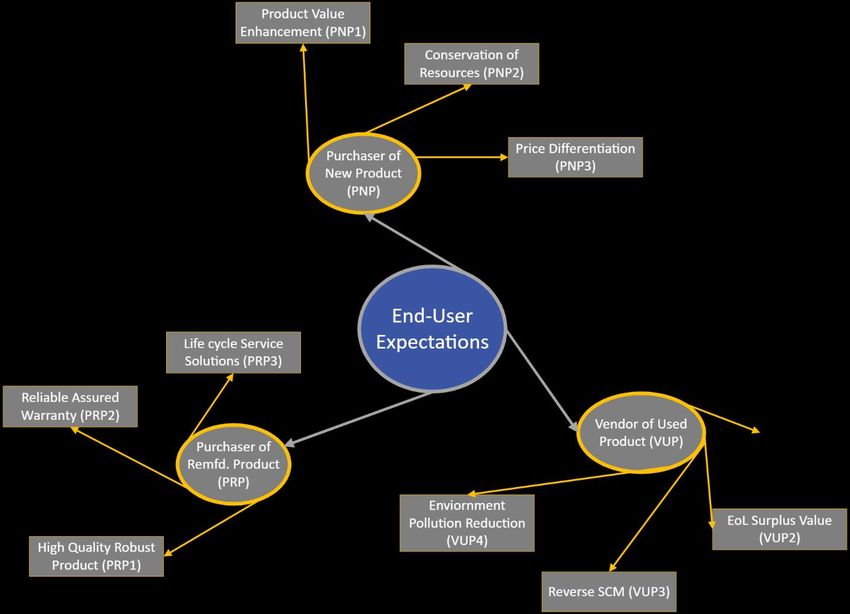
remanufactured product offered by the OEM is a key criteria to benefit maximum. In a study carried out to investigate the drivers
and obstructions in putting remanufacturing in line, viable pricing was derived as the critical economic aspect (Sharma V. et.al,
2016). The influence of nation-branding associating the origin of the country of remanufactured auto parts was investigated through
Indonesian consumers elaborating the role of image of the remanufactured product in global business (Chinen, K., & Matsumoto,
M., 2021). While adopting the new remanufacturing strategy into business, its thus imperative that the OEM use an appropriate
branding strategy to project its alignment of remanufacturing efforts to garner goodwill that comes from incorporating sustainable
manufacturing into the social order. In certain countries, governments offer subsidies to such organizations which offer buyback
options to customers for their used products. When the product when nears its End-of-Life, it may not be desirable for further use
and may lay around as a waste. The customer can get advantage from getting value for the surplus product (Vogtlander, J. G., et.al,
2017). Used products are generally submitted to 3rd party remanufacturers due to ease of access. If the supply chain services are
well in place to ensure core return, it will facilitate the end-user to return the product (Ullah, M.et. al,2021). For instance, one may
use online mode to inspect the product and after deciding the final value order couriering of the core back to the manufacturing
facility. The used products when not recycled create pollution, harmful to the environment (Liu, Z.et. al, 2016). Pollution caused by
used plastic products is being acknowledged as a potent hazard. End-users who have the sensitivity of responsible citizenship,
adhering to government legislations may prefer returning the product displaying sensitivity.

 Figure 1: Categorization of End-user Expectations

The product has to be robust for use, offering quality performance when its provided with a guarantee of renewal (Mont O., 2008).
Its imperative that the standards of the new product and remanufactured product match in all respects. The reliability of the
remanufactured product may always be in question, when it is offered at a lower price with its origin lying in a used product.
Remanufacturing process entails the final testing of the product and its components to ensure that the same warranty on the
remanufactured product as that of the new product can be offered (Anityasari, M., & Kaebernick, H, 2008).
By adopting the remanufacturing strategy the OEM’s have the opportunity of reaching out to two new market segments – one of the
sellers of used product and secondly buyer’s of remanufactured products. By profiling the customers in these roles they can find out
new avenues to redress their differentiated needs. Third party remanufacturer’s may exist in certain product segments to deal with
which the OEM’s can use their strengths to the best to improve the satisfaction of remanufactured product market, by offering
product life cycle solutions (Kwak, K., & Kim, W. ,2015). Figure 1 shows the classification of the requirements that may be inferred

Copyrights @Kalahari Journals Vol.7 No.3 (March, 2022)
 International Journal of Mechanical Engineering
 308
from the above discussion from the perspective of the transitioning roles of the End-user.
The drivers are useful to the management in aligning the remanufacturing operations. There is a possibility that the drivers are
correlated and influence one another. Some aspects may even hinder the performance of the operations.
Its important that the effectiveness of the planned processes is made robust and invulnerable to such difficult factors. Taguchi
designs is recommended as a useful approach to identify the effect of factors. A methodology to investigate factors influencing
service quality satisfaction in a Taiwan hotel was developed by using the questionnaire survey (Ho, L. H. et.al, 2014). Statistically
the method accounts for the average and variances simultaneously for the categorical data, claiming it to be vigorous (Zhou, W.
et.al, 2020). The objective is to develop recommendations for a system that is insensitive to difficult to control noise factors (Tsui
KL 1992). The success factors of business process improvement in telecom sector through analysis with managers and consultants
were identified by the method (Ibrahim, M. S., et.al, 2019). Using the S/N ratio approach the traditional IPA (Importance
Performance Analysis) Model was modified for gap analysis of ordinal data collected in the repair services of air-conditioning
manufacturer. It overcame the restraints of the model reliably (Lee, Y. C., et. al,2008). The advantage of the approach in this study
was reducing the probability of financial losses and time by recognizing the requirements for success before launching the initiative.
For applying this methodology, in this study a survey was conducted among the marketing personnel of remanufacturing companies.
The participant were asked to rank their agreement for each of the ten drivers listed on its importance as a critical factor influencing
the remanufacturing adoption decision. The measure used was the 5 point likert scale (1 – Very Dissatisfied, 2 – Dissatisfied, 3 –
Neither Satisfied nor Dissatisfied, 4 – Satisfied and 5 – Very Satisfied). The questionnaire was sent through mail to 34 on-field
experts from companies of three different automotive sector products, receiving 29 completely filled forms through follow up on
clarifications sought. 4 responses were rejected and 25 were used for further analysis. The marketing professionals participating in
the study had 5 to 15 years of experience of serving the remanufactured product customers.

 I. DATA ANALYSIS AND INTERPRETATION
Table I provides a gist of the responses collected. The value of Kaiser-Meyer-Olkin (KMO), measuring Sampling adequacy, was
found to be 0.697 within the acceptable range of 0.5 to 0.7.The significance value of Bartlett’s test of sphericity for existence of
identity matrix in correlation coefficients with chi-square of 129.3 at degree of freedom of 45 is less than 0.001, rejecting the
hypothesis. Together the implications, inveterate the likelihood of underlying factors among the diverse drivers as anticipated.

 TABLE I
 CODE Very Somewhat Neither Satisfied nor Somewhat Very Cronbach
 Dissatisfied Dissatisfied dissatisfied Satisfied Satisfied Alpha
 (%) (%) (%) (%) (%)

 PNP1 4 4 8 52 32 0.72221

 PNP2 0 8 24 48 20 0.75285

 PNP3 0 12 28 44 16 0.75302

 VUP1 0 4 12 64 20 0.76520

 VUP2 0 4 8 60 28 0.76889

 VUP3 0 4 8 72 16 0.76193

 VUP4 0 8 24 52 16 0.75069

 PRP1 0 4 8 40 48 0.79425

 PRP2 0 8 12 36 44 0.82868
 PRP3 0 4 0 36 60 0.81131

Copyrights @Kalahari Journals Vol.7 No.3 (March, 2022)
 International Journal of Mechanical Engineering
 309
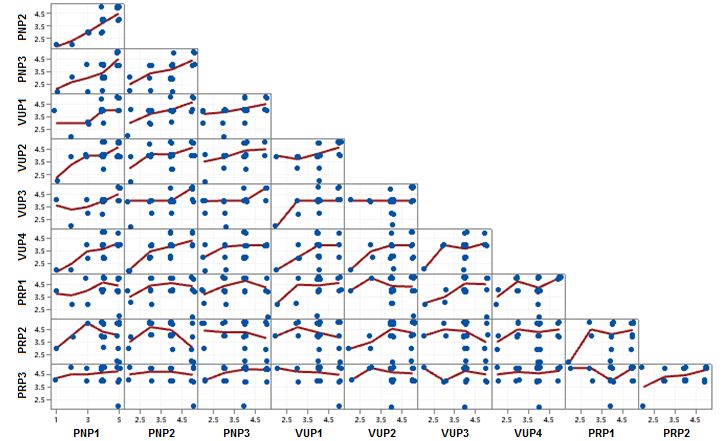
Figure 2: Matrix plot of interrelations

For determining the reliability of the survey instrument, the Cronbach alpha computed whose results are shown in last column of
Table I. All the values were found to be acceptable and above the value of 0.7. was 0.7916 which is greater than the threshold of 0.7
(Taber, K. S. , 2018). The data is thus reliable to proceed for calculation of the Signal to Noise Ratio. Figure 2 shows the Matrix
plot obtained using Minitab software, giving insight into the interrelations among the requirements.
The average and standard deviation results obtained from the software are demonstrated in table II. The factors are ranked in the
ascending order of standard deviation. Further the Relative Importance Index (RII) is the for each factor calculated by the 5 point
likert scale by using the formula:
 1 1 + 2 2 + 3 3 + 4 4 + 5 5
 =
 5
Where ri represent the frequency of the response “i” for the respective factor and n is the no, of respondents.
Returnability service values showed the least variability while enhanced product value showed the maximum.
 TABLE II
 CODE AVG. Std. Ranking RII Ranking
 (RII)
 Dev. (Std. Dev.)
 PNP1 4.04 0.978093 10 0.808 3

 PNP2 3.8 0.866025 7 0.76 8

 PNP3 3.64 0.907377 8 0.728 10

 VUP1 4 0.707107 2 0.8 6

 VUP2 4.12 0.725718 4 0.824 4

Copyrights @Kalahari Journals Vol.7 No.3 (March, 2022)
 International Journal of Mechanical Engineering
 310
VUP3 4 0.645497 1 0.8 7

 VUP4 3.76 0.830662 6 0.752 9

 PRP1 4.32 0.802081 5 0.864 2

 PRP2 4.16 0.943398 9 0.832 3

 PRP3 4.52 0.714143 3 0.904 1

The formulae for disagreement coefficient (P di), agreement coefficient(Pai) and the S/N ratios of corresponding coefficients n ai and
ndi are shown below :
 1 + 2 4 + 5
 = =
 2 2
 1 −
 / = ≡ −10 log ( ) / = ≡ −10 log ( )
 1 −
The last column in table IV presents the ranking of the S/N ratio from highest to lowest value of the resources. The ranking and
standard deviation in table III helps to resolve the ranking dilemma for factors having same S/N ration. The ranking for factors
VUP2, VUP3 and PRP1 is determined by preferring lesser variance as an attribute for better rank.
 TABLE IV
 CODE Pai Pdi ɳdi ɳai ɳ Rank

 PNP1 0.84 0.08 10.61 7.20 17.81 6

 PNP2 0.68 0.08 10.61 3.27 13.88 9

 PNP3 0.6 0.12 8.65 1.76 10.41 10

 VUP1 0.84 0.04 13.80 7.20 21.00 5

 VUP2 0.88 0.04 13.80 8.65 22.45 3

 VUP3 0.88 0.04 13.80 8.65 22.45 2

 VUP4 068 0.08 10.61 3.27 13.88 8

 PRP1 0.88 0.04 13.8 8.65 22.45 4

 PRP2 0.8 0.08 10.61 6.02 16.62 7

 PRP3 0.96 0.04 13.80 13.80 27.60 1

By the scrutiny of S/N Ratio computed for each driver of three different end-user roles, its possible to segregate the drivers based
on their effect to be in control of the system. RII on the other hand measures the significance of the factor in contributing to drive

Copyrights @Kalahari Journals Vol.7 No.3 (March, 2022)
 International Journal of Mechanical Engineering
 311
remanufacturing practices better from end-user perspective irrespective of their sensitivity. Both the S/N Ratio and RII methods
result (Figure 3), in Product Life cycle solutions (PRP3) as highest and Price differentiation (PNP3) as the lowest ranking factors.
However, though reliability (PRP2) seems to be of rank third in relative importance, it has comparatively low control on the response
of the system as per S/N ratio analysis. On the other hand, better regulation may be obtained through Returnability services (VUP3)
which ranks second in SN ratio may result in a better robust system even if it may rank seventh as per RII.

 PNP1
 10
 PRP3 8 PNP2

 6
 4
 PRP2 PNP3
 2
 SN Ratio
 0
 RII
 PRP1 VUP1

 VUP4 VUP2

 VUP3

 Figure 3: Ranking Analysis
To induce the consumer into purchasing a new product la unched, improving the perception of inherent product value, emerges as a
better approach. Environmental sensitivity may not work for the seller of core unless its matched by a strategic branding intended
to may be creating a compassionate view of the organisation working towards sustainability. Getting the right value of the End of
Life surplus product will meet the purpose. Offering and improving the services for evaluation and return of the EoL product will
help the OEM’s ensure that the sellers are not compelled to opt for local 3rd party remanufacturers who generally have the advantage
of easy access. For the end-user as a buyer of remanufactured product, robustness of the product to perform well is more important
than offering a reliability warranty.

 III. CONCLUSION
The spider chart depicts the results of the study comparing the ranking of the drivers through relative importance using statistical
index as well as measuring sensitivity through Taguchi’s Signal/Noise ratio approach. The factors can be prioritized as per their role
from controlling the results to themselves being responsive to changes. The perception of the service offered to the customer
throughout its life cycle attests to be the key influence in achieving remanufacturing benefits. Contrary to popular belief, difference
in price of new and remanufactured product has the least impact.

 REFERENCES
[1] Anityasari, M., & Kaebernick, H. (2008). A concept of reliability evaluation for reuse and remanufacturing. International
 Journal of Sustainable Manufacturing, 1(1-2), 3-17., https://dx.doi.org/10.1504/ijsm.2008.019224
[2] Chinen, K., & Matsumoto, M. (2021). Indonesians’ Perceptions of Auto Parts Remanufactured in China: Implications for
 Global Remanufacturing Operations. Sustainability, 13(7), 3968., https://dx.doi.org/10.3390/su13073968
[3] D’Adamo, I., & Rosa, P. (2016). Remanufacturing in industry: advices from the field. The International Journal of Advanced
 Manufacturing Technology, 86(9), 2575-2584. https://dx.doi.org/10.1007/s00170-016-8346-5
[4] Gutowski, T. G., Sahni, S., Boustani, A., & Graves, S. C. (2011). Remanufacturing and energy savings. Environmental science
 & technology, 45(10), 4540-4547. https://dx.doi.org/10.1021/es102598b
[5] Ho, L. H., Feng, S. Y., & Yen, T. M. (2014). A New Methodology for Customer Satisfaction Analysis: Taguchi’s Signal-to-
 Noise Ratio Approach. Journal of Service Science and Management, 07(03),235-244.
 https://dx.doi.org/10.4236/jssm.2014.73021
[6] Ibrahim, M. S., Hanif, A., & Ahsan, A. (2019). Identifying Control Factors for Business Process Improvement in Telecom
 Sector Using Taguchi Approach. IEEE Access, 7, 129164-129173.URL https://dx.doi.org/10.1109/access.2019.2939374
[7] Kwak, K., & Kim, W. (2015). Productivity Growth of Newly Industrializing Economies in Heterogeneous Capital Goods
 Markets: case of the Korean machinery and equipment industry. Applied Economics, 47(7), 654-668.
 https://dx.doi.org/10.1080/00036846.2014.978075
[8] Lee, Y. C., Yen, T. M., & Tsai, C. H. (2008). Modify IPA for quality improvement: Taguchi's signal‐to‐noise ratio
 approach. The TQM Journal. https://dx.doi.org/10.1108/17542730810898458
Copyrights @Kalahari Journals Vol.7 No.3 (March, 2022)
 International Journal of Mechanical Engineering
 312
[9] Liu, Z., Jiang, Q., Li, T., Dong, S., Yan, S., Zhang, H., & Xu, B. (2016). Environmental benefits of remanufacturing: A case
 study of cylinder heads remanufactured through laser cladding. Journal of Cleaner Production, 133, 1027-1033.
 https://dx.doi.org/10.1016/j.jclepro.2016.06.049
[10] Mont, O. (2008). Innovative approaches to optimising design and use of durable consumer goods. International Journal of
 Product Development, 6(3-4), 227-250. https://dx.doi.org/10.1504/ijpd. 2008.020395
[11] Naik, S., & Terkar, R. (2017). A Study on Designing for Sustainable Product Development in view of End-user Role through
 Remanufacturing. In INTERNATIONAL CONFERENCE ON COMMUNICATION AND SIGNAL PROCESSING (Vol. 2).
 https://dx.doi.org/10.2991/iccasp-16.2017.25
[12] Östlin, J., Sundin, E., & Björkman, M. (2008). Business drivers for remanufacturing. In 15th CIRP International Conference
 on Life Cycle Engineering (pp. 581-586). 1
[13] Sharma, V., Garg, S. K., & Sharma, P. B. (2016). Identification of major drivers and roadblocks for remanufacturing in
 India. Journal of cleaner production, 112, 1882-1892. https://dx.doi.org/10.1016/j.jclepro.2014.11.082
[14] Taber, K. S. (2018). The use of Cronbach’s alpha when developing and reporting research instruments in science
 education. Research in science education, 48(6), 1273-1296. https://dx.doi.org/10.1007/s11165-016-9602-2
[15] Terkar R., Vasudevan, H., & Sunnapwar, V. (2011). Perfect Product Launching Strategies in context of Survival of Small Scale
 Consumer Products Industries, Technology Systems and Management, 321-326. https://dx.doi.org/10.1007/978-3-642-20209-
 4_46 .
[16] Tsui KL (1992) An overview of Taguchi method and newly developed statistical methods for robust design. Iie Transactions
 24(5):44–57 https://dx.doi.org/10.1080/07408179208964244
[17] Ullah, M., Asghar, I., Zahid, M., Omair, M., AlArjani, A., & Sarkar, B. (2021). Ramification of remanufacturing in a
 sustainable three-echelon closed-loop supply chain management for returnable products. Journal of Cleaner Production, 290,
 125609. URL https://dx.doi.org/10.1016/j.jclepro.2020.125609
[18] Vogtlander, J. G., Scheepens, A. E., Bocken, N. M., & Peck, D. (2017). Combined analyses of costs, market value and eco-
 costs in circular business models: eco-efficient value creation in remanufacturing. Journal of Remanufacturing, 7(1), 1-17.
 URL https://dx.doi.org/10. 1007/s13243-017-0031-9
[19] Zhou, W., Wang, Z., & Xie, W. (2020). Weighted signal-to-noise ratio robust design for a new double sampling npx
 chart. Computers & Industrial Engineering, 139, 106124. https://dx.doi.org/10.1016/j.cie.2019.106124

Copyrights @Kalahari Journals Vol.7 No.3 (March, 2022)
 International Journal of Mechanical Engineering
 313
You can also read