Investigating the Relationship Between Air Quality and COVID-19 Transmission
←
→
Page content transcription
If your browser does not render page correctly, please read the page content below
Journal of Data Science xx (xx), 1–13                                        DOI: 10.6339/21-JDS1010
                                           March 2021

                                                      Investigating the Relationship Between Air Quality and
                                                                      COVID-19 Transmission

                                                          Laura Albrecht∗1 , Paulina Czarnecki†2 , and Bennet Sakelaris3
                                               1
                                               Department of Applied Mathematics and Statistics, Colorado School of Mines, Golden, CO, USA
                                           2
                                             Department of Applied Physics and Applied Mathematics, Columbia University, New York City, NY,
                                                                                           USA
                                           3
                                             Department of Engineering Sciences and Applied Mathematics, Northwestern University, Evanston, IL,
arXiv:2103.13494v1 [stat.AP] 24 Mar 2021

                                                                                           USA

                                                                                            Abstract

                                           It is hypothesized that short-term exposure to air pollution may influence the transmission of
                                           aerosolized pathogens such as COVID-19. We used data from 23 provinces in Italy to build
                                           a generalized additive model to investigate the association between the effective reproductive
                                           number of the disease and air quality while controlling for ambient environmental variables and
                                           changes in human mobility. The model finds that there is a positive, nonlinear relationship
                                           between the density of particulate matter in the air and COVID-19 transmission, which is in
                                           alignment with similar studies on other respiratory illnesses.
                                           Keywords Air pollution; Effective reproduction number; Generalized additive model; Mobility;
                                           Particulate matter.

                                           1        Introduction
                                           Poor air quality is a well-documented public health concern, causing respiratory illnesses, neg-
                                           atively impacting cardiovascular health, and decreasing life expectancy (Delfino et al., 2005;
                                           Krewski, 2009; Lelieveld et al., 2015; Janssen et al., 2013). Especially harmful is fine particulate
                                           matter (with diameter less than 2.5 µm, called PM2.5 ) suspended in the air (Delfino et al., 2005;
                                           Laden et al., 2000; Schwartz et al., 1996). These particles, which are mainly created by indus-
                                           trial combustion processes and atmospheric reactions, can deeply penetrate the lungs and cause
                                           damage to the respiratory system over time (Xing et al., 2016; Tucker, 2000). Furthermore, it is
                                           hypothesized that viruses may attach themselves to these suspended particles and infect hosts
                                           upon inhalation (Ciencewicki and Jaspers, 2007; Liang et al., 2014; Contini and Costabile, 2020;
                                           Jiang et al., 2020). This effect is particularly pronounced in cities with extreme levels of air
                                           pollution, such as Beijing, where cases of influenza have been shown to increase with the density
                                           of PM2.5 in the air (Ciencewicki and Jaspers, 2007; Liang et al., 2014; Feng et al., 2016; Su et al.,
                                           2019; Jiang et al., 2020).
                                                 Since December 2019, when the novel coronavirus SARS-CoV-2 was first identified in Wuhan,
                                           China, it has erupted into a global pandemic (Zhu et al., 2020a; Jiang et al., 2020; Zhu et al.,
                                           2020b). Many risk factors and comorbidities have been found, including obesity, pre-existing
                                           health conditions such as diabetes or hypertension, and advanced age (Richardson et al., 2020;
                                           Yang et al., 2020). An increase in environmental factors such as air pollution, temperature, and
                                           humidity have also been found to be associated with increased COVID-19 case counts early in
                                               ∗
                                                   All authors contributed equally to this work
                                               †
                                                   Corresponding author. Email: pc2943@columbia.edu

                                           Received December, 2020; Accepted February, 2021                                                   1
2                   Laura Albrecht, Paulina Czarnecki, and Bennet Sakelaris

the pandemic in China (Zhu et al., 2020b; Jiang et al., 2020), however the effects of PM2.5 remain
largely unexplored as the pandemic continues to develop. Furthermore, recent events such as
raging wildfires in the western United States have increased concentrations of PM2.5 in the air
(O’Dell et al., 2019; Jaffe et al., 2008); it would be useful to understand whether these changes
can affect the spread of COVID-19.
     In this paper, we analyze the effective reproductive number (Rt ) of the disease, which is
the average number of secondary infections caused by an infectious individual on day t. Because
of this time dependency, Rt acts as a measurement of daily transmission intensity and as a re-
sult, is frequently utilized for decision-making during a pandemic (Lipsitch et al., 2011). After
using the open-source software rt.live (Systrom et al., 2020) to calculate Rt in 23 provinces in
Italy, we studied its association with PM2.5 using a generalized additive models (GAM). In the
GAM, we also controlled for other environmental variables, including humidity, temperature,
and changes in mobility due to lockdown. We found that at concentrations of PM2.5 greater
than about 70 µg/m3 , poor air quality is positively correlated with increased Rt of COVID-19.
Furthermore, we performed a 23-fold cross-validation procedure in order to test the sensitivity
of the model on each province and test for selection bias. We found that our model was robust
against this test.

2     Methods
2.1   Study Area
In order to ensure that we had sufficient data to extract meaningful results, we considered only
Italian provinces that reported more than 2000 cumulative cases of COVID-19 during the study
period of February 24, 2020 to August 1, 2020. We then removed locations where environmental
data was unavailable, resulting in the final study area of the 23 provinces shown in Figure 1.
These provinces accounted for over 63% of total Italy’s COVID-19 cases over the time frame.

2.2   Data
The environmental variables included in the study were daily median temperature, relative hu-
midity, and PM2.5 . Temperature and relative humidity were collected from the NOAA Integrated
Surface Database using the worldmet package in R (Carslaw, 2020), while PM2.5 data was taken
from the World Air Quality Index (https://aqicn.org/).
     We also controlled for the effects of lockdown by incorporating data from province-specific
Google Community Mobility Reports (https://google.com/covid19/mobility/), which quantify
the daily change in aggregate mobility compared to a pre-pandemic baseline. The dataset was
generated using anonymized data from Google Maps to measure daily visitors in six categories
of locations: residential areas, retail locations, transit stations, grocery stores, parks, and work-
places. In order to gain perspective on how mobility has changed due to the pandemic, these
measures were divided by a median value of visitors for that location for that day of the week,
which was measured prior the onset of the pandemic. For this study, we took our mobility vari-
able to be the change in mobility in residential areas; however, we found similar results when
we substituted data from any of the other five categories of locations provided in the Google
Community Mobility Reports.
     Daily tests counts and confirmed cases were collected directly from the Italian Department of
Civil Protection (https://github.com/pcm-dpc/COVID-19) and were used to estimate the value
Air Quality and COVID-19 3
Figure 1: A geospatial heat map with locations of the 23 provinces included in the study, colored
by the cumulative number of COVID-19 cases as of August 1, 2020.
of the effective reproductive number, Rt .
Rt was estimated using an open source model from Systrom et al. (2020) called rt.live, which
we adapted to be compatible with our data. Notably, the model estimates total cases by scaling
confirmed cases according to testing volume. It also approximates a time series of cases by day
of infection using an onset delay distribution which was empirically driven by data from Xu
et al. (2020) while assuming a five day incubation period as evidenced by work from Lauer et al.
(2020). Finally, it uses the generation time derived by Nishiura et al. (2020) with mean 4.7 days
and standard deviation 2.9 days to estimate Rt .
The time series of new COVID-19 cases, mobility, PM2.5 , median temperature, median
humidity, and Rt from February 24, 2020 to August 1st, 2020 are shown in Figure 2. The
peak in cases occurred between March 14th and April 18th in each province then cases steadily
decreased. The effective reproductive number however decreases until mid-April and starts to
increase again in most provinces over the summer. A seasonal increase in temperature is present
as the data was collected from late winter to mid-summer, while humidity and PM2.5 do not
follow any obvious trends. Descriptive statistics of our data are available in Table 1.
2.3 Statistical Model
Following other studies on the effects of ambient environmental variables on viral transmission
(Peng et al., 2005; Colon-Gonzalez et al., 2013; Prata et al., 2020; Xie and Zhu, 2020; Talmoudi
et al., 2017; Feng et al., 2016), we used a generalized additive model (GAM) to analyze the
COVID-19 pandemic. The GAM is a semi-parametric extension of the generalized linear model
in which the response variable (relative transmission rate) relies on a linear combination of4 Laura Albrecht, Paulina Czarnecki, and Bennet Sakelaris
Mean SD Min Max
Daily Cases 42.29 76.93 0 868
Daily Tests 968.93 1136.27 0 18256
Temperature (o C) 18.06 6.60 0.50 36
Relative Humidity (%) 63.84 17.67 11.50 100
PM2.5 (µg/m3 ) 48.52 21.67 5 172
Mobility Decrease (%) 15.57 12.31 -9 47
Rt 0.94 0.24 0.57 2.12
Table 1: Mean, standard deviation, minimum, and maximum of each variable considered across
all cities and days, including the estimated value of Rt .
smooth functions of the predictor variables (humidity, PM2.5 , temperature, and mobility). Our
GAM was defined using a Gaussian distribution and the following equation:
log(Rt,i ) = s(Mobilityt,i ) + s(Tempt,i ) + s(Humt,i ) + s(PM2.5t,i ) + λi , (1)
where t denotes the date, i denotes the province, and s(·) denotes the thin plate basis spline used
to smooth the data. Parameters of the splines were estimated using the GCV method, and the
splines were constrained to have at most five degrees of freedom. This constraint was imposed
to minimize overfitting while accurately describing the trends of the data. The results of the
model were robust to changes in the degrees of freedom, signifying that we effectively captured
the trends in the data.
We chose our predictor variables to be the percent decrease in mobility (Mobilityt,i ), me-
dian temperature (Tempt,i ), median humidity (Humt,i ), and median PM2.5 (PM2.5t,i ). We also
included the fixed effect of each province with the intercept λi to account for local differences.
Finally, we selected our response variable to be the log-transformed effective reproductive number
(Rt,i ). Choosing our response variable in this way allowed us to avoid lagging any of our predictor
variables, as the effective reproductive number is already adjusted for the delay between the day
of infection and the day the case was reported (Systrom et al., 2020). Furthermore, choosing the
logarithm transformation allows the model to be interpreted more naturally as we can see the
effects of the predictor variables on a relative scale rather than an absolute scale (Gelman and
Hill, 2007).
The model was tested for robustness in two ways. First, we constructed the model for
each province individually in order to ensure that the trends present in the global data set were
also present in local data sets. Next, we cross-validated the model on our data by removing
one province from the global data set, training the model on the 22 remaining provinces and
using this model to predict Rt for the removed province. We then repeated this process for each
province in order to ensure that no province had an overstated effect on the model.
The GAM was computed using the mgcv package in R (Wood, 2011).
3 Results
Output from the GAM in Equation (1) is shown in Figure 3. These plots depict the partial
effect of each predictor variable on the effective reproductive number Rt determined by the
evaluate_smooth function in the gratia package in R (Simpson, 2021). The 95% confidenceAir Quality and COVID-19 5
Daily Cases Mobility Humidity
10 100
750 0
75
−10
500
−20 50
250 −30
−40 25
0
Value
Temperature PM2.5 Rt
2.0
30 150
20 100 1.5
10 50 1.0
0 0 0.5
Mar Apr May Jun Jul Aug Mar Apr May Jun Jul Aug Mar Apr May Jun Jul Aug
Date
Campagnia Lazio PA Bolzano Toscana
Region Emilia−Romagna Lombardia Piemonte Veneto
Figure 2: The time series of daily cases, temperature, humidity, and PM2.5 in 23 Italian provinces.
Each line represents one province and the colors are grouped by region.
intervals are shown in gray. Negative values indicate a decrease in Rt , while positive values
indicate an increase in Rt . If the confidence interval includes zero, there is no effect.
The percent change in mobility had a positive effect on Rt . This is a very intuitive result; as
people stay at home more, the effective reproductive number decreases. Increased temperature
showed a negative effect on the effective reproductive number up until around 25◦ C. Humidity
had a somewhat positive effect when under 50% and a negligible effect at greater values. PM2.5
had no effect at concentrations between 0 and 70 µg/m3 , but showed a strong positive effect for
larger values. All predictor variables were significant with p-values of less than 2 × 10⁻¹⁶ . The
model had an adjusted coefficient of determination R2 = 0.67.
The model was fit to each province individually which revealed similar qualitative effects
for each predictor as observed in the global data set (Figure 4). Variability at higher PM2.5
values exists due to a small number of observations per province. Firenze (Toscana), Napoli
(Campagnia) and Roma (Lazio) do not exhibit the same increasing trend for PM2.5 as the other
provinces but all had very few observations above 75 µg/m3 and no observations above 100
µg/m3 . Similarly, variability in the effect of humidity below 50% can also be explained by a
small sample size in this range per province.6 Laura Albrecht, Paulina Czarnecki, and Bennet Sakelaris
% Change Mobility Temperature (°C)
0.2
0.2
0.1
0.0 0.1
−0.1
0.0
−0.2
−0.3 −0.1
Effect
−40 −30 −20 −10 0 10 0 10 20 30
PM2.5 (µg/m3) % Humidity
0.075
0.4
0.3 0.050
0.2
0.025
0.1
0.000
0.0
0 50 100 150 25 50 75 100
Figure 3: Each plot shows the partial effects of change in mobility, PM2.5 , temperature, and
humidity on the expected value of log(Rt ). The 95% confidence intervals are depicted in gray.
Rt increases as mobility increases, PM2.5 has negligible effect for values between 0−70µg/m3 but
displays a strong positive effect at higher values, temperature has a negative relationship with
Rt , and humidity has a slight positive effect under 50% but a negligible effect at higher values.
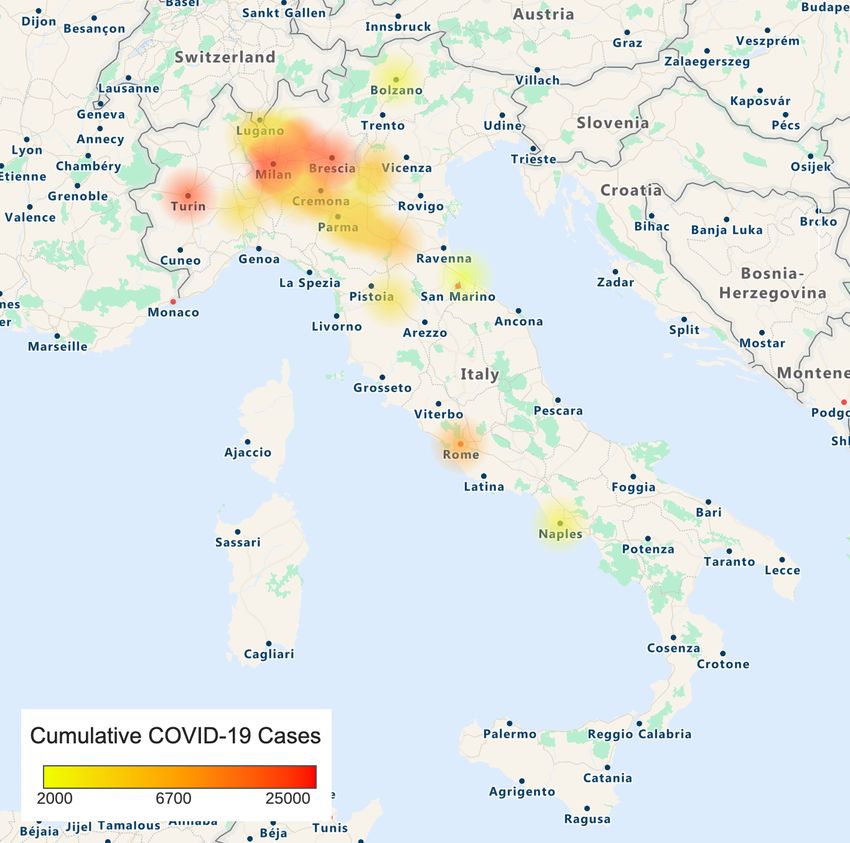
Additionally, the model was trained on the data with one province removed at a time and
the mean squared error was calculated after predicting on the removed province (Figure 5).
Prediction error was lower in regions where we had data from multiple provinces, and higher
in regions where less data was available. Illustrating this, Napoli, Roma, and Verona were the
only provinces in their respective regions from which we collected data, and they had the highest
mean squared prediction errors.
4 Discussion
The COVID-19 pandemic has affected millions of people around the world. Poor air quality is
also considered a public health issue, associated with long-term health effects such as weakened
cardiovascular health and decreasing life expectancy (Delfino et al., 2005; Krewski, 2009; Lelieveld
et al., 2015; Janssen et al., 2013). Past studies have also shown an association between highAir Quality and COVID-19 7
% Change Mobility Temperature (°C)
0.4
0.2 0.2
0.0
−0.2 0.0
−0.4
−0.2
−0.6
Effect
−40 −30 −20 −10 0 10 0 10 20 30
PM2.5 (µg/m3) % Humidity
0.6
0.3
0.4
0.2
0.2 0.1
0.0 0.0
−0.1
0 50 100 150 25 50 75 100
Campagnia Lazio PA Bolzano Toscana
Region Emilia−Romagna Lombardia Piemonte Veneto
Figure 4: Each line shows the partial effect for each predictor variable when fitting a GAM to
each province separately. Lines were colored by region which shows that the biggest outliers
come from regions with only a small number of observations.
concentrations of particulate matter less than 2.5 µm in diameter and an increase in influenza
transmission (Su et al., 2019). Thus we hypothesize that even short-term exposure to elevated
PM2.5 may lead to a higher risk of COVID-19 transmission. Although any analysis to understand
transmission is confounded by many variables, such as temperature, humidity, social distancing
or the quality of data, our results show that air pollution may be associated with a higher effective
reproduction rate of the virus. We showed the generalized additive model’s results to be robust.
When each province was removed from the data pool, a GAM constructed from the remaining
provinces could predict case counts in the excluded province.
Our study is novel in its use of effective reproductive number as the dependent variable
for the GAM. Although this parameter Rt is commonly calculated to estimate the growth of a
pandemic (Lipsitch et al., 2011; Rubin et al., 2020; Pan et al., 2020), our use of it in a GAM
analyzing the impact of other variables on disease spread is novel. As we were interested in a daily
change in virus transmission, we chose to use the assumptions of an established model to account
for the many unknowns in the data, such as the lag between contracting the virus and showing
symptoms, and the one between taking a test and receiving a positive result. Furthermore, we8 Laura Albrecht, Paulina Czarnecki, and Bennet Sakelaris
Figure 5: A geospatial heat map of mean squared prediction error from the cross validation
process. The error is lowest in the Lombardi region, where we had the most observations, and
highest in the regions of Campagni, Lazio, and Veneto where we used data from one province
each.
use a longer timescale than comparable models of the COVID-19 pandemic, including both the
initial wave of cases as well as the subsequent decline. Finally, we account for changes in human
behavior during the pandemic using Google mobility data, while the majority of contemporary
papers have not incorporated this or any similar metric.
We found statistically significant relationships of mobility, temperature, humidity, and PM2.5
on COVID-19 transmission. It is well established that the reduction in mobility as a result of
national lockdowns has been very effective at reducing the spread of COVID-19 (Kraemer et al.,
2020; Zhu et al., 2020c), which is clear from our results as well. The magnitude of this effect
explains why it was essential to include in our analysis. We also found an increase in temperature
was associated with a decrease in Rt . We are hesitant to ascribe excessive significance to this
finding given the strong serial correlation of temperature and the limited data we have available.
Nevertheless, we can still compare our findings to those of other studies of COVID-19. Lee et al.
(2020) used a linear model on data from 166 countries to note a negative correlation between
temperature and COVID-19 cases. They also found a significant correlation between humidity
and COVID-19 cases, albeit with a noticeably smaller effect than that of temperature. Both of
these are supported by our results. Furthermore, Prata et al. (2020) used a non-linear model in
Brazil to find a noticeable decrease in transmission as temperature increased from 17◦ C to 24◦ C
and little change between 24 − 27◦ C, which was similar to our findings. Studies of China such as
those by Xie and Zhu (2020) and Ma et al. (2020) have found the opposite result. They report
positive nonlinear trends between temperature and disease incidence in January and February.Air Quality and COVID-19 9
Possible reasons for this disagreement may be model selection, confounding variables, or a limited
range of data (Lee et al., 2020).
Our results regarding PM2.5 were also largely consistent with previous studies on COVID-
19 and other respiratory illnesses. Feng et al. (2016), Liang et al. (2014), Janssen et al. (2013),
Su et al. (2019), Jiang et al. (2020), Zhu et al. (2020b), and Zhu et al. (2020c) observed that
PM2.5 was positively correlated to the transmission of various viruses including coronaviruses and
influenza viruses. Although most of these studies used linear models to establish a correlation,
Feng et al. (2016) reported a nonlinear trend with little correlation between infection rates for
PM2.5 values below 70 µg/m3 , followed by a linearly increasing trend for PM2.5 values between
70 and 150 µg/m3 , a similar phenomenon to the one we observed. Overall, it seems the majority
of studies agree that a statistically significant relationship between PM2.5 and viral transmission
exists. The common hypothesis for this is two-fold. First, fine particulate matter has been
reported to damage the respiratory system, possibly resulting in “a temporary immunosuppressive
pulmonary microenvironment" (Feng et al., 2016; Donaldson and Tran, 2002; Li et al., 1996; Kim
and Kang, 1995; Lee et al., 2014). Second, PM2.5 is sufficiently small that it can stay suspended
in the air for prolonged stretches of time, making it, and any pathogen that may have bound itself
to it, susceptible to inhalation. In fact, a recent finding from the Italian province of Bergamo
provides evidence that SARS-CoV-2 does bind to particulate matter in the air (Setti et al.,
2020). Both of these hypotheses could imply that particulate matter allows greater exposure
to the virus as well as a greater susceptibility to infection following exposure. However, more
research is needed to understand the underlying mechanisms and the degree of additional risk.
As pollution levels rise around the world (Shaddick et al., 2020), it is important to study
their impact on respiratory disease. Even now, events such as wildfires in the western United
States drive PM2.5 levels to extreme highs (Liu et al., 2016; Xie et al., 2020). Thus, our findings
may predict an association between the fires and higher incidences of COVID-19 transmission.
Furthermore, as the climate continues to change, this association may be important to note in
future outbreaks of respiratory illnesses.
Another pervasive issue in the pandemic is the disproportional incidence of COVID-19 on
low-income and ethnic communities, particularly in the United States (Yancy, 2020; Hooper
et al., 2020; Brandt et al., 2020). Understanding the causes of this disparity would allow for pol-
icymakers to implement more effective measures of controlling the spread in these communities.
To this end, it has been established that low-income and ethnic communities are disproportion-
ately exposed to high levels of PM2.5 (Brandt et al., 2020; Tessum et al., 2019). The results of
our study indicate that it is possible that some of the increased disease transmission in these
communities may be attributed to higher levels of air pollution. Unfortunately due to a lack of
available data, we were unable to directly investigate this using a subgroup analysis; however,
we bring it up as an important issue that warrants further consideration.
In addition to PM2.5 , temperature, and humidity, it is possible to consider other envi-
ronmental variables. Other studies have identified possible relationships between COVID-19
transmission and PM10 , SO2 , NO2 , and O3 (Zhu et al., 2020c; Jiang et al., 2020; Fronza et al.,
2020). We did not include these in our study for a variety of reasons. There were very few days
where any province reported unhealthy NO2 levels (>150 ppb), and as a result, we unsurprisingly
found no strong effect. Likewise, O3 measurements were missing from a significant number of
provinces, and the O3 that was reported seldom reached unhealthy (>100 ppb) levels. PM10
and SO2 measurements were similarly unavailable for a large number of provinces and thus were
omitted from study.
There are several limitations to our study. While we attempt to control for the seasonal vari-10 Laura Albrecht, Paulina Czarnecki, and Bennet Sakelaris ation of atmospheric variables in our model, an entire seasonal cycle of the COVID-19 pandemic has not been observed, making a full seasonal analysis infeasible at this time. Many confounding variables may influence PM2.5 levels, and they are difficult to disentangle. Furthermore, since our study focuses on Italy, we do not know if these findings would be consistent in other areas. Future work would include expanding this study to multiple countries in different regions, such as the southern hemisphere, and to countries with a less homogeneous government response to test if our results hold on a global scale. 5 Conclusion Our results suggest that mobility, temperature, humidity, and short-term exposure to PM2.5 are all possible risk factors for COVID-19. While the effects of temperature, humidity, and mobility have all been subjects of large-scale global studies on the pandemic (Kraemer et al., 2020; Lee et al., 2020), PM2.5 has received less attention. However, because PM2.5 can change significantly due to both long-term, predictable events (such as an increase in PM2.5 in winter months) as well as short-term, less predictable events (such as wildfires), it is important to try to understand how it may impact the pandemic. We find that PM2.5 has a negligible correlation with Rt for healthy to moderate air quality, but as PM levels increase to unhealthy amounts, a strong positive correlation emerges. This provides evidence for the long-standing hypothesis that short-term exposure to air pollution is a risk factor for respiratory illnesses. Although the results of our study are consistent with other works, this should still be considered a preliminary study as larger scale data sets are needed to confirm a global trend. Supplementary Materials The data and R code used to generate these results, as well as figures for individual cities in the validation process, are included in the supplementary files. A README is provided to describe the data available, how to generate each figure presented in the paper, and where important variables should be found in the code. Acknowledgements We thank Dr. Richard McGehee, Dr. Mary Silber, and Dr. Mary Lou Zeeman for their contri- butions advising this effort as well as Dr. Jack O’Brien and Dr. Douglas Nychka for discussions regarding the development of the statistical model. This work was supported by the NSF, the American Institute of Mathematics, and the Mathematics and Climate Research Network. References Brandt EB, Beck AF, Mersha TB (2020). Air pollution, racial disparitiesm and COVID-19 mortality. J Allergy Clin Immunol, 146(1): 61–63. Carslaw D (2020). Worldmet: Import Surface Meteorological Data from NOAA Integrated Surface Database (ISD). R package version 0.9.0. Ciencewicki J, Jaspers I (2007). Air pollution and respiratory viral infection. Inhalation Toxi- cology, 19(14): 1135–1146.
Air Quality and COVID-19                                      11

Colon-Gonzalez FJ, Fezzi C, Lake IR, Hunter PR (2013). The effects of weather and climate
  change on dengue. PLoS Neglected Tropical Diseases, 7: e2503.
Contini D, Costabile F (2020). Does air pollution influence COVID-19 outbreaks?
Delfino RJ, Sioutas C, Malik S (2005). Potential role of ultrafine particles in associations between
  airborne particle mass and cardiovascular health. Environmental Health Perspectives, 113(8):
  934–946.
Donaldson K, Tran CL (2002). Inflammation caused by particles and fibers. Inhalation Toxicol-
  ogy, 14: 5–27.
Feng C, Li J, Sun W, Zhang Y, Wang Q (2016). Impact of ambient fine particulate matter
  (PM 2.5) exposure on the risk of influenza-like-illness: a time-series analysis in Beijing, China.
  Environmental Health, 15(1): 17.
Fronza R, Lusic M, Schmidt M, Lucic B (2020). Spatial–temporal variations in atmospheric
  factors contribute to SARS-CoV-2 outbreak. Viruses, 12(6): 588.
Gelman A, Hill J (2007). Data analysis using regression and multilevel/hierarchical models,
  volume Analytical methods for social research. Cambridge University Press, New York.
Hooper MW, Nápoles AM, Pérez-Stable EJ (2020). COVID-19 and racial/ethnic disparities.
  JAMA, 323(24): 2466–2467.
Jaffe D, Hafner W, Chand D, Westerling A, Spracklen D (2008). Interannual variations in
  PM2.5 due to wildfires in the western United States. Environmental Science & Technology,
  42(8): 2812–2818.
Janssen N, Fischer P, Marra M, Ameling C, Cassee F (2013). Short-term effects of PM2. 5, PM10
  and PM2.5–10 on daily mortality in the Netherlands. Science of the Total Environment, 463:
  20–26.
Jiang Y, Wu XJ, Guan YJ (2020). Effect of ambient air pollutants and meteorological variables
  on COVID-19 incidence. Infection Control & Hospital Epidemiology, 41(9): 1011–1015.
Kim CS, Kang TC (1995). Comparative measurement of lung deposition of inhaled fine par-
  ticles in normal subjects and patients with obstructive airway disease. American Journal of
  Respiratory and Critical Care Medicine, 155: 899—-905.
Kraemer MU, Yang CH, Gutierrez B, Wu CH, Klein B, Pigott DM, et al. (2020). The effect
  of human mobility and control measures on the COVID-19 epidemic in China. Science, 368:
  493–497.
Krewski D (2009). Evaluating the effects of ambient air pollution on life expectancy.
Laden F, Neas LM, Dockery DW, Schwartz J (2000). Association of fine particulate matter from
  different sources with daily mortality in six US cities. Environmental Health Perspectives,
  108(10): 941–947.
Lauer SA, Grantz KH, Bi Q, Jones FK, Zheng Q, Meridith HR, et al. (2020). The incuba-
  tion period of coronavirus disease 2019 (COVID-19) from publicly reported confirmed cases:
  Estimation and application. Annals of Internal Medicine, 172(9): 577–582.
Lee GI, Saravia J, You D, Shrestha B, Jaligama S, Hebert VY, et al. (2014). Exposure to
  combustion generated environmentally persistent free radicals enhances severity of influenza
  virus infection. Particle and Fibre Toxicology, 11: 11—-57.
Lee GI, Saravia J, You D, Shrestha B, Jaligama S, Hebert VY, et al. (2020). Effects of tem-
  perature and humidity on the daily new cases and new deaths of COVID-19 in 166 countries.
  Science of the Total Environment, 729: 139051.
Lelieveld J, Evans JS, Fnais M, Giannadaki D, Pozzer A (2015). The contribution of outdoor air
  pollution sources to premature mortality on a global scale. Nature, 525(7569): 367–371.
12                 Laura Albrecht, Paulina Czarnecki, and Bennet Sakelaris

Li XY, Gilmour PS, Donaldson K, MacNee W (1996). Free radical activity and pro-inflammatory
  effects of particulate air pollution (PM10) in vivo and in vitro. Thorax, 51: 1216–1222.
Liang Y, Fang L, Pan H, Zhang K, Kan H, Brook JR, et al. (2014). PM 2.5 incBeijing–temporal
  pattern and its association with influenza. Environmental Health, 13(1): 102.
Lipsitch M, Finelli L, Herrenan RT, Leung GM, Redd SC (2011). Improving the evidence base
  for decision making during a pandemic: The example of 2009 Influenza A/H1N1. Biosecurity
  and Bioterrorism: Biodefense Strategy, Practice, and Science, 9: 89–115.
Liu JC, Mickley LJ, Sulprizio MP, Dominici F, Yue X, Ebisu K, et al. (2016). Particulate air
  pollution from wildfires in the western US under climate change. Climatic change, 138(3-4):
  655–666.
Ma Y, Zhao Y, Liu J, He X, Wang B, Fu S, et al. (2020). Effects of temperature variation and
  humidity on the death of COVID-19 in Wuhan, China. Science of the Total Environment, 724:
  138226.
Nishiura H, Linton NM, Akhmetzhanov AR (2020). Serial interval of novel coronavirus (COVID-
  19) infections. International Journal of Infectious Diseases, 93: 284–286.
O’Dell K, Ford B, Fischer EV, Pierce JR (2019). Contribution of wildland-fire smoke to US PM2.
  5 and its influence on recent trends. Environmental Science & technology, 53(4): 1797–1804.
Pan A, Liu L, Wang C, Guo H, Hao X, Wang Q, et al. (2020). Association of public health
  interventions with the epidemiology of the COVID-19 outbreak in Wuhan, China. JAMA
  Network, 323: 1915–1923.
Peng RD, Dominici F, Louis TA (2005). Model choice in time series studies of air pollution and
  mortality. Journal of the Royal Statistical Society, 169: 179–203.
Prata DN, Rodrigues W, Bermejo PH (2020). Temperature significantly changes COVID-19
  transmission in (sub)tropical cities of Brazil. The Science of the Total Environment, 729:
  138862.
Richardson S, Hirsch JS, Narasimhan M, Crawford JM, McGinn T, Davidson KW, et al. (2020).
  Presenting characteristics, comorbidities, and outcomes among 5700 patients hospitalized with
  COVID-19 in the New York City area. JAMA, 323(20): 2052–2059.
Rubin D, Huang J, Fisher BT, Gasparrini A, Tam V, Song L, et al. (2020). Association of social
  distancing, population density, and temperature with the instantaneous reproduction number
  of SARS-CoV-2 in counties across the United States. JAMA Network Open, 3: e2016099.
Schwartz J, Dockery DW, Neas LM (1996). Is daily mortality associated specifically with fine
  particles? Journal of the Air & Waste Management Association, 46(10): 927–939.
Setti L, Passarini F, De Gennaro G, Barbieri P, Perrone MG, Borelli M, et al. (2020). SARS-
  CoV-2RNA found on particulate matter of Bergamo in northern Italy: First evidence. Envi-
  ronmental Research, 188: 109754.
Shaddick G, Thomas M, Mudu P, Ruggeri G, Gumy S (2020). Half the world’s population are
  exposed to increasing air pollution. NPJ Climate and Atmospheric Science, 3(1): 1–5.
Simpson G (2021). Graceful ’ggplot’-Based Graphics and Other Functions for GAMs Fitted Using
  ’mgcv’. R package version 0.5.1.
Su W, Wu X, Geng X, Zhao X, Liu Q, Liu T (2019). The short-term effects of air pollutants on
  influenza-like illness in Jinan, China. BioMed Central Public Health, 19(1): 1–12.
Systrom K, Vladek T, Krieger M (2020). Rt.live. GitHub repository.
Talmoudi K, Bellali H, Ben-Alaya N, Saez M, Malouche D, Chahed MK (2017). Modeling
  zoonotic cutaneous leishmaniasis incidence in central Tunisia from 2009-2015: Forecasting
  models using climate variables as predictors. PLoS Neglected Tropical Diseases, 11: e0005844.
Air Quality and COVID-19                                     13

Tessum CW, Apte JS, Goodkind AL, Muller NZ, Mullins KA, Paolella DA, et al. (2019). In-
  equality in consumption of goods and services adds to racial-ethnic disparities in air pollution
  exposure. PNAS, 116(13): 6001–6006.
Tucker WG (2000). An overview of PM2.5 sources and control strategies. Fuel Processing
  Technology, 65: 379–392.
Wood SN (2011). Fast stable restricted maximum likelihood and marginal likelihood estimation
  of semiparametric generalized linear models. Journal of the Royal Statistical Society (B), 73(1):
  3–36.
Xie J, Zhu Y (2020). Association between ambient temperature and COVID-19 infection in 122
  cities from China. The Science of the Total Environment, 724: 138201.
Xie Y, Lin M, Horowitz LW (2020). Summer PM2. 5 pollution extremes caused by wildfires
  over the western United States during 2017–2018. Geophysical Research Letters, 47(16):
  e2020GL089429.
Xing YF, Xu YH, Shi MH, Lian YX (2016). The impact of PM2. 5 on the human respiratory
  system. Journal of Thoracic Disease, 8(1): E69.
Xu B, Gutierrez B, Mekaru S, Sewalk K, Goodwin L, Loskill A, et al. (2020). Epidemiological
  data from the COVID-19 outbreak, real-time case information. Scientific Data, 7.
Yancy CW (2020). COVID-19 and African Americans. JAMA, 323(19): 1891–1892.
Yang J, Zheng Y, Gou X, Pu K, Chen Z, Guo Q, et al. (2020). Prevalence of comorbidities
  and its effects in patients infected with SARS-CoV-2: a systematic review and meta-analysis.
  International Journal of Infectious Diseases, 94: 91–95.
Zhu N, Zhang D, Wang W, Li X, Yang B, Song J, et al. (2020a). A novel coronavirus from
  patients with pneumonia in china, 2019. New England Journal of Medicine, 382: 727–733.
Zhu Y, Xie J, Huang F, Cao L (2020b). Association between short-term exposure to air pollution
  and covid-19 infection: Evidence from China. Science of the Total Environment, 138704.
Zhu Y, Xie J, Huang F, Cao L (2020c). The mediating effect of air quality on the association
  between human mobility and COVID-19 infection in China. Environmental Research, 189:
  109911.
You can also read