International Journal of Disaster Risk Reduction - Canadian ...
←
→
Page content transcription
If your browser does not render page correctly, please read the page content below
International Journal of Disaster Risk Reduction 56 (2021) 102093
Contents lists available at ScienceDirect
International Journal of Disaster Risk Reduction
journal homepage: http://www.elsevier.com/locate/ijdrr
Modelling electric vehicle charging network capacity and performance
during short-notice evacuations
Craig David MacDonald a, *, Lina Kattan a, David Layzell b
a
Department of Civil Engineering, Schulich School of Engineering, University of Calgary, 2500 University Dr NW, Calgary, T2N 1N4, Canada
b
Canadian Energy Systems Analysis Research (CESAR) Initiative, University of Calgary, 2500 University Dr NW, Calgary, T2N 1N4, Canada
A R T I C L E I N F O A B S T R A C T
Keywords: Electric vehicles (EVs) may add new challenges during mass evacuations. Understanding the magnitude of the
Electric vehicles impacts EVs may have during the pre-departure stage of mass evacuations is an essential first step when planning
Electric vehicle charging network for mass evacuations in a future where EVs are more common. In this paper, a generalized framework based on a
Charging network capacity
G/G/c/N queueing model (general arrival process, general service process, c charging stations, and N EVs) was
Mass evacuations
Wildfire evacuation
developed to estimate the number of vehicles that can be charged in the pre-departure evacuation stage and thus
Electric vehicle evacuation assess the pre-departure impacts. The model outputs are the number of vehicles that have or have not been
served during the evacuation period, as well as average queue times and maximum queue lengths. This model is
tested using the current electric vehicle fleet and charging infrastructure of Prince George, British Columbia, as a
case study with a hypothetical short notice forest fire scenario. It was found that for the present-day case of
Prince George, there is not enough charging network capacity to service all vehicles before departure. Increasing
the number of charging stations, providing earlier evacuation notices, and ensuring a balanced makeup of level 3
fast-charging of different types were all found to be effective in increasing the number of EVs that received
adequate charging before departure.
1. Introduction overall many EVs still perform worse in these metrics than conventional
vehicles in the present. While these are manageable hurdles in business-
Mass evacuations are difficult situations to manage. There are many as-usual situations, they may magnify existing challenges during evac
uncertainties and potential problems that might arise during evacua uations, especially under short-notice scenarios.
tions. Electric vehicles (EVs) may add new challenges to an already Very little research has explored the topic of EVs and during mass
difficult situation, both for evacuees and for emergency managers. evacuations. One of the leading efforts in this direction is the research by
While, in the present, EVs make up a small proportion of the total ve Adderly et al. [4]. To our best knowledge, with the exception of this
hicles on the road, their numbers continue to grow. As EVs continue to work, no other work has modelled charging or refueling of vehicles
increase in popularity [1], it will be prudent to identify what problems before an evacuation. One potential problem that EVs will magnify is
might arise from their introduction to mass evacuation situations, model vehicle refueling before evacuations. Reports of long lineups at gas
their impacts, and to explore potential solutions before being forced to stations during evacuations are quite common [5–13]. Increased
deal with them in retrospect. (FIg. 1) charging times and shorter ranges would increase the time spent refu
While EVs may promise reductions in emissions and potentially eling and the number of stops during evacuations. Any vehicle that has
reduction in fuel costs for their users, in their current form, they bring insufficient charge to evacuate will likely be temporarily abandoned,
some significant trade-offs. EVs often have longer charging times than which will at best only impede the evacuation of the passengers of that
conventional vehicles’ fueling times, leading to concerns about charging vehicle if they abandon their vehicle far to the side of the road, and at
network capacity in emergency situations. They also often have shorter worst could prompt a partial lane closure were an out-of-fuel vehicle to
ranges than conventional vehicles, leading to concerns about vehicles fully or partially block a lane of traffic. Even stalled vehicles on the
running out of charge en route to their destination. Although these range shoulder can reduce the capacity of roadways as other motorists reduce
and fueling times differ significantly among EV makes and models, their speed when passing. In an evacuation situation, stalled vehicles on
* Corresponding author.
E-mail addresses: macdoncd@ucalgary.ca (C.D. MacDonald), lkattan@ucalgary.ca (L. Kattan), dlayzell@ucalgary.ca (D. Layzell).
https://doi.org/10.1016/j.ijdrr.2021.102093
Received 18 July 2020; Received in revised form 5 January 2021; Accepted 27 January 2021
Available online 25 February 2021
2212-4209/© 2021 The Author(s). Published by Elsevier Ltd. This is an open access article under the CC BY license (http://creativecommons.org/licenses/by/4.0/).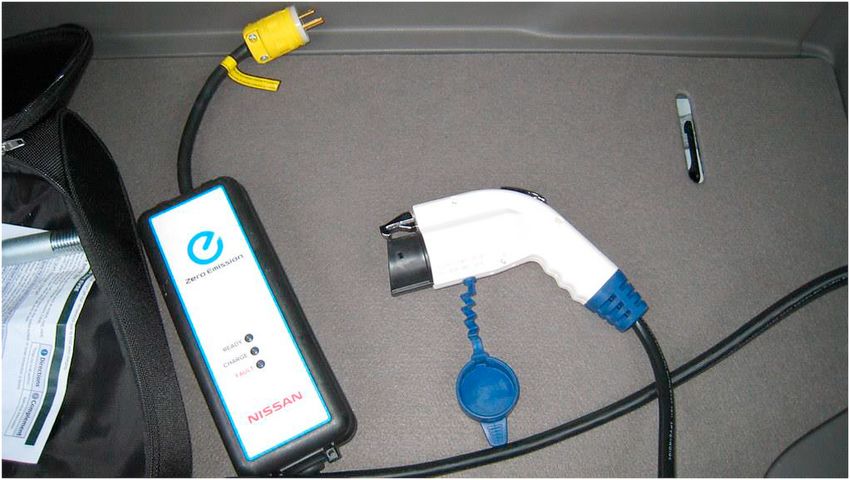
C.D. MacDonald et al. International Journal of Disaster Risk Reduction 56 (2021) 102093
that it is the first to model charging or refueling of vehicles before an
evacuation and does so by being the first to incorporate different EV
makes and models, as well as different levels of charging stations in a
model of EV charging network capacity. Furthermore, rather than using
a Poisson arrival process, this research presents the first work that in
corporates a realistic arrival process that reflects historically observed
evacuation patterns. Having a more realistic arrival process and service
processes is important because traditional queueing assumptions, like
Poisson arrival and service processes do not apply in evacuation
scenarios.
The outputs of the developed model are performance indicators in
the form of number and percentage of vehicles that have or have not
been fully charged during the evacuation period, average queue times
and maximum queue lengths. While the work in this study focusses on
evacuations, the methods used to incorporate different vehicle models
Fig. 1. Electric vehicle sales in Canada over time. Reprinted from “Market and charging station types could be used to estimate charging capacity
Snapshot: EVs in Canada” by Canadian Energy Regulator [2]. under business-as-usual scenarios as well. Thus, this newly developed
model can be used as a decision support tool for: 1) informing decision-
the shoulder can also block emergency vehicles and supplies. makers to assist in evaluating the capacity of their EV charging network,
To further complicate the issue, in the present, EV charging stations and 2) allowing emergency managers to better assess whether their
come in a variety of types and with different vehicle adapters. In contrast communities, especially those that do not have a large number of fast-
with gas stations, which are very common and are compatible with the charging stations, can handle the demand for charging generated by a
vast majority of conventional passenger vehicles, today’s limited mass evacuation. While this research uses Prince George as a case study,
availability of EV charging stations and the diversity in the types of the framework is general enough and thus transferable to other com
charging station and related compatibility with the specific EV models munities by changing the input parameters (e.g. type and number of
further limits the number of options evacuees have. Thus, not every EV charging stations) to incorporate EVs into their evacuation planning.
model may be equipped to charge at a certain station. Some vehicles can Furthermore, the trends in charging network capacity and traffic models
not make use of DC fast charging stations at all. should be similar in any remote location at risk of wildfire.
On top of pre-evacuation charging concerns, EV range concerns
become apparent when considering the kind of disasters that frequently 2. Review of the literature
cause mass evacuations. The distance that evacuees need to travel varies
heavily between different disasters. In the 1979 Mississauga train The majority of the literature on EV charging networks focusses on
derailment, 200,000 evacuees travelled an average of only 10 km optimal placement locations [17–22]; or the impacts on the electrical
outside the mandatory evacuation area [14]. In contrast, when Hurri grid [23–27]. Feng et al. [23] in particular is worth noting as it deals
cane Floyd approached Florida, Georgia, and the Carolinas in 1999, 2 directly with EV evacuations. While it does not address capacity issues
million evacuees travelled 242–402 km on average [15]. During the relating to demand for EV charging during pre-evacuation queuing, it
2016 Fort McMurray wildfire, the nearest major city, Edmonton, was as suggests that there may be electrical grid capacity issues from a surge in
far as 435 km away. A hypothetical evacuee from Key West, Florida may power demand due to increased charging in the pre-evacuation period.
have to travel over 640 km to reach Orlando. This would likely require While no work focusses on the maximum throughput of EVs under
multiple stops to refuel vehicles. Hurricanes and wildfires are the two emergency circumstances, work that models charging network capacity
most likely candidates to prompt long distance evacuations as they under business-as-usual circumstances can be drawn on. Adderly et al.
affect large areas and can pose a significant risk to human life. [4] are the only authors to date to examine the challenges that EVs may
While EVs are popular in urban areas in the present, introduction of give rise to in mass evacuations. Their work focusses on potential policy
battery-electric pickup trucks may encourage some rural residents to implications and provides simple estimates of EV charging network ca
switch from conventional fuel vehicles. Ford has recently announced a pacity and recommended distances between charging stations. This
battery-electric version of the F-150, the most popular vehicle series in study did not model the impacts of EVs after departure.
North America [16]. EVs evacuating from wildfires in Northern Alberta Aveklouris et al. [28] examine both charging station and parking
or British Columbia may not be as much of a stretch of the imagination capacity as M/M/c queues with abandonment, but do not examine
as it presently seems. different vehicle or charger classes. Said et al. [29] and Akbari & Fer
To better understand the magnitude of the impacts EVs may cause nando [30] model the problem as a M/M/c queue and M/M/1 queue
pre-departure during mass evacuations, this paper develops a frame respectively, but again do not take different vehicle models or charging
work based on a G/G/c/N queuing model to estimate the charging station types into consideration. Zhang & Grijalva [31] model residen
network capacity in an area before the departure during a short-notice tial vehicle charging station impacts on the grid as an M/G/∞/N model
evacuation. Throughout this work, Kendall’s notation will be followed where charging time is based on an empirical distribution informed by
when describing queuing models. The queuing models discussed in this smart meters at homes with level 2 charging stations. Liu & Bie [32]
work have an arrival process following a certain distribution which incorporates multiple types of different charging stations with the goal
governs arrivals to stations (general – G, or a Markovian Poisson process of determining the optimal allocation of charging stations under
– M), a service time process following a certain distribution which business-as-usual conditions. As discussed in more detail in Sections
governs the time it takes for charging to be completed (general – G, or a 3.3-3.5, pre-evacuation charging may not resemble business-as-usual
Markovian Poisson process – M), a defined number of charging stations charging, leading to different assumptions about the structure of the
(a whole number of value c), and a defined number of arriving EVs (a queueing problem than those used in the studies above. While this work
whole number of value N). builds a solid foundation, there is room to explore models that incor
Modelling the problem as a queueing problem with a wide range of porate different arrival processes, different vehicle makes and models,
input parameters provides a generalized framework capable of realisti and different types of charging stations.
cally estimating EV charging network capacity. This work is novel in Evacuations may have relatively long or relatively short notice times.
In the case of Hurricane Katrina, a voluntary and then mandatory
2
C.D. MacDonald et al. International Journal of Disaster Risk Reduction 56 (2021) 102093
evacuation notice went out 47 h and 42 h respectively before the storm the details of emergency evacuation scenarios and EV characteristics are
made landfall [33]. In the case of the 2011 Earthquake in Japan, an explored in more depth.). Only battery EVs (from here on referred to as
evacuation notice was sent out 3 min after the earthquake struck, just “EVs”) will be examined for this study as plug-in hybrid electric
leaving only 27–37 min before the tsunami made landfall [34]. Other vehicles operate similarly to conventional vehicles with their batteries
events, like the 2016 Fort McMurray wildfire fall somewhere in be often supplying only a moderate portion of total range.
tween. At 2:00PM, May 3rd, mandatory evacuation orders were given The problem is approached using Monte Carlo methods and is
for southern communities. This expanded to a full mandatory evacua simulated in the R programming language [59].
tion for all of Fort McMurray at 6:20PM the same day. During this time The model is a discrete-event simulation with randomized inputs.
period, over 45% of the population leaving the city by vehicle had Vehicles arrive with randomized vehicle makes and models, charge
evacuated. By 12:00AM that night, almost 90% of those leaving by ve levels, and arrival times. The number of vehicles, the number and type of
hicles had evacuated. Over this 10 h period, nearly 35,000 people (17, charging stations, and the time window in which vehicles are able to
500 vehicles) evacuated the city. charge are fixed based on the scenario explored. The service times for
Many authors have explored the distinction between voluntary and each charging station vary depending on initial charge levels, vehicle
mandatory evacuation notices and their accompanying impacts on when make and model, and charging station level. The outputs of the model
individuals choose to evacuate [35–39]. Voluntary and mandatory are the number of vehicles served, the maximum queue lengths, and the
evacuation notices play a significant role in predicting when evacuees average time spent in queue (Fig. 2).
choose to depart, particularly in short-notice or no-notice evacuations To compensate for the relatively low number of input vehicles and
[40–45]. Auld et al. [41] notes that during no-notice respondents who the large amount of potential variability due to the differences in
received a government order to evacuate and see others evacuating rate charging time and server availability between makes and models, the
their likelihood of evacuating as well at a 4.5 on a scale of 1-to-5. Beverly simulation was run 1000 times for each scenario and all outputs were
& Bothwell [46] found that in a 27 year study of 547 wildfire evacua averaged over this number of samples.
tions in Canada, 90% of evacuees left due to an evacuation order by the Two options present themselves for how to model multiple charging
government. stations. The first is to model each charging station as its own queue. The
There have been numerous efforts to model evacuation time based second is to model multiple stations as a single queueing problem with
on evacuee behaviour during hurricanes [47]; Dixit et al., 2012; [37,48], as many servers as there are charging ports. The first option would be
as noted by Golshani et al. [49] no studies have focused on no-notice or more accurate if arrival curves differed at the different charging stations.
short-notice behaviour-based evacuation time models. Absent further A model that takes into account travel time to charging stations would
behaviour-based models of short-notice or no-notice evacuation depar benefit from this setup. As this model does not take travel times into
ture times, reconstructed empirical departure curves will be relied on to account and assumes the same arrival curve for each charging station, it
estimate departure curves for this work. is a useful simplifying assumption to model each charging station as
Based on past events, the US National Oceanic and Atmospheric belonging to the same queue. The problem will be simulated in the R
Administration’s National Hurricane Center issues hurricane watches programming language [59]. It is also assumed that all drivers are
48h and hurricane warnings at 36h before an area experiences tropical familiar with their surroundings and have perfect information about
storm force winds [50]. Similar time frames were seen in practice during which charging stations their vehicles are compatible with and would
Hurricane Irene [51] and Hurricane Floyd in South Carolina [15]. A not queue for a charging station they would not be able to use. This
partial evacuation order for the town of Paradise, California was issued assumption is justified in part by the rise of mapping technology like
1 min after wildfires were reported in town, and the full evacuation Google Maps or ChargeHub that allows EV owners to locate EV charging
order was not given for another 1 h and 17 min [52]. In the 2016 Fort stations with adapters they can make use of. This assumption may not
McMurray wildfire, mandatory evacuation of the western communities hold in all cases, such as a scenario where communication infrastructure
like Abasand began at 2:34PM, with fires reported in the community at is not available. However, an assumption of imperfect information
4:09PM, giving the time between warning and event at 95 min. would not significantly change the results of this simulation as addi
Many authors have also tried to create empirical departure curves tional delays from EV owners who discover they are mistaken and
and fit those curves to theoretical distributions. Most notably, Lewis requeue at a different charging station are only incurred if travel time to
[53] proposed using sigmoid curves, Radwan et al. [54] proposed using and from stations is taken into account.
logistic distributions, Tweedie et al. [55] proposed using Rayleigh dis While a closed-form solution could be created, it would be a complex
tributions, Cova & Johnson [56] proposed using Poisson distributions, and inefficient undertaking. The different classes of servers and cus
and [57] proposed a sequential logit model. These studies primarily tomers would make any closed-form equations unwieldy. Approxima
focused on hurricane evacuations, while Cova & Johnson focused on tions that might simplify this effort, such as Little’s Law, would not hold
wildfire evacuations. These theoretical models are often difficult to as the system is not stationary.
validate given the changing circumstances and characteristics of each
disaster. Thankfully, some excellent studies have been carried out to 3.2. Overview of the case study
determine empirical evacuee departure curves. Li et al. [51] constructed
an evacuation curve based on traffic data during Hurricane Irene. They In 2017, wildfires in British Columbia displaced over 45,000 people
determined that Rayleigh and logit distributions best fit the empirical and caused over 10,000 people to evacuate to Prince George [60]. The
departure curves [58]. constructed an empirical evacuation curve for next year similar circumstances prompted the evacuation of nearly 3000
vehicles leaving Fort McMurray but did not fit it to any specific people from the surrounding region to Prince George [61]. While fires in
distribution. these seasons did not directly affect Prince George, Prince George has
been identified as being at high risk for wildfires [62,63].
3. Methodology Currently, Prince George has nine EV charging stations at five
different locations. There is one level 3 fast-charging station, and eight
3.1. Simulation methodology & parameterization level 2 charging stations. Prince George has a population of 86,622 as of
2016 [64]. The province of British Columbia had a population of 4.648
In this paper, the problem of modelling EV behaviour during short million in 2016. The latest estimate for total number of EVs registered in
notice evacuation will be based on a G/G/c/N queueing problem (gen British Columbia is 31,000 as of Q3 2019 [65], with approximately 51%
eral arrival process, general service process, c charging stations, and N being battery EVs [66]. There is no data available comparing sales in
EVs). The justification for this choice will be discussed further below as larger and smaller municipalities. It is assumed that EVs are not evenly
3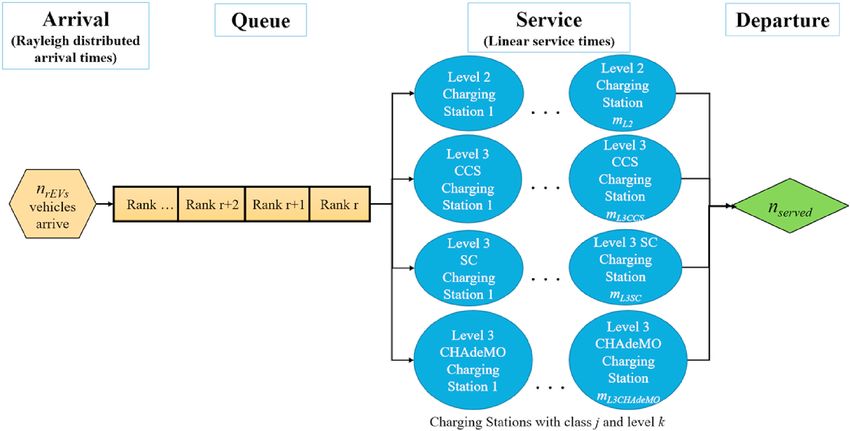
C.D. MacDonald et al. International Journal of Disaster Risk Reduction 56 (2021) 102093
Fig. 2. Inputs and outputs of the queueing model.
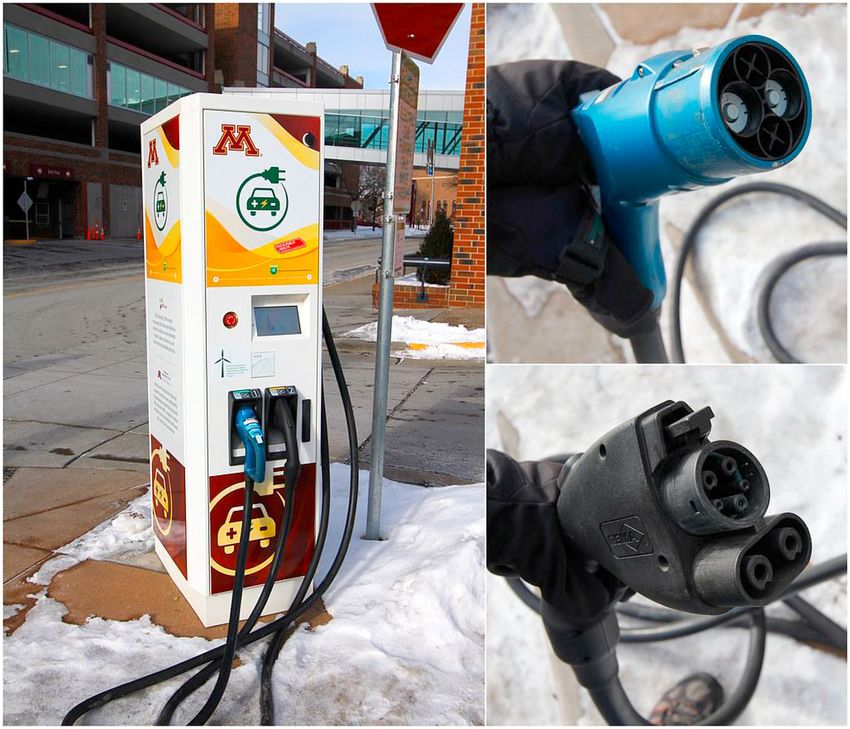
Fig. 3. Locations of charging stations in Prince George. Yellow markers are level 3 charging stations, and blue markers are level 2 charging stations. Some markers
have multiple charging stations at that location [3]. (For interpretation of the references to colour in this figure legend, the reader is referred to the Web version of
this article.)
4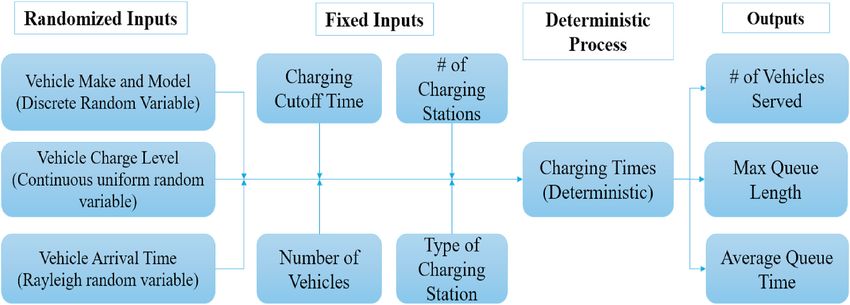
C.D. MacDonald et al. International Journal of Disaster Risk Reduction 56 (2021) 102093
distributed throughout the population, and that a mid-sized and A theoretical Rayleigh departure curve with a scale parameter σ
geographically isolated municipality like Prince George would be ex controlling the slope of the curve can be inferred from the cumulative
pected to have a smaller proportion of EV ownership than a larger departure of vehicles over time in the case studies that share similarities
municipality like Vancouver. EV sales in the Cariboo region which in with the scenario being modelled. The cumulative distribution function
cludes Prince George are only 7% of the EV sales percentage of Van for the Rayleigh distribution is given in Equation (1):
couver and Victoria (CTV News, 2019). As Prince George is the largest − x2
municipality in the Cariboo region, their EV sales percentage is likely to F(x; σ) = 1 − e(2σ2 ) (1)
be higher than in other neighboring small rural municipalities and is
Without access to the datasets used in the studies discussed, σ can
likely to bring this ratio up slightly. A conservative assumption will be
only be estimated from the reported cumulative percentage at the
made that EVs will be found at 20% the rate of the background popu
mandatory evacuation time. Fitting the Rayleigh distribution to a cu
lation in BC. This leads to an estimated nTotalEVs of 59 (Fig. 3).
mulative probability of 45% at the mandatory evacuation time (260
Prince George has EVs and EV associations, as well as EV charging
min) gives a σ of 237.78. This scale parameter models the right tail
stations and dealerships that sell EVs [67]. This location strikes a bal
reasonably well; giving an 87% cumulative percentage of departures at
ance between having a manageable level of complexity given the rela
8 h into the evacuation, compared with roughly 85% cumulative per
tively small number of EVs and charging stations, while still being large
centage of departures at the same time in the Fort McMurray departure
enough and at high enough risk to be investigated for a mass evacuation
curve (Fig. 4).
scenario.
Using inverse transform sampling, a set of independent and identi
Prince George shares similarities to Fort McMurray, Alberta, Canada,
cally distributed Rayleigh random variates, X, can be generated from
in terms of population and wildfire risk. Both are relatively far distances
Equation (2):
from other major population centers and have a limited choice of
√̅̅̅̅̅̅̅̅̅̅̅̅̅̅̅̅
evacuation routes. In summer 2017, Fort McMurray was subject to a X = σ − 2 ln U (2)
wildfire warranting a mandatory evacuation notice. With this similarity
between the two cities, the departure curves for Prince George can be Where X is a Rayleigh random variate, and U is a uniform random
inferred from past empirical work by Woo et al. [58]. variate. These variates are then sorted from least to greatest and the
For this case study we will consider a hypothetical wildfire with a differences of these sorted random variates are the inter-arrival times of
relatively short notice time. Four hours and 20 min will pass between vehicles to the system. An example of these cumulative arrival and
voluntary evacuation and mandatory evacuation, with fires reaching the interarrival time curves for a single sample are given in Fig. 5.
city by 8 h. The cutoff time Tevac at which fires enter the city and charging It should be noted that in comparison to an exponential distribution,
is no longer possible will be the 8-h mark. a Rayleigh distribution has less dispersion (coefficients of variation of 1
and 0.523 for exponential and Rayleigh distributions respectively).
3.3. Arrival process The scale parameter will need to be fit for each evacuation window
considered. Tevac will be considered the period of time between a
To estimate an arrival rate for vehicles at EV charging stations, one voluntary evacuation notice being issued, and the interruption of
must determine what type of distribution the arrival to stations follows, charging services (e.g. fires entering the affected community forcing
how many vehicles may need to be serviced in a location, how much immediate departure or losing power at a charging station). It will be
time is available for charging in an emergency scenario, and the period assumed that this is the period of time between the voluntary evacuation
of time in which charging can occur. Any fueling of vehicles would have notice and a cutoff time when cumulative evacuation percentage passes
to be done either in preparation for evacuation (during evacuation alerts roughly 85%. It can be reasonably assumed that stations at this time will
or during voluntary evacuation notices, if there are any), or in the no longer be able to operate for the reasons listed above.
evacuation time period.
Departure curves for the city can be inferred from past empirical 3.4. Service time distribution
work, as discussed in Section 2. The departure curve created by Woo
et al. [58] is the closest analogue to the case study examined in this Each EV model has its own battery size, charging profile, and type of
paper. During the Fort McMurray wildfire, a mandatory evacuation charger it is compatible with. Service times will vary between models
notice was given 4 h and 20 min after evacuation began, and the time at and chargers. As such, it is appropriate to use a class-based system to
which 90% of vehicles had evacuated was approximately 11 h after model service times. Each vehicle is assigned a class that represents its
evacuation began. The left tail of each curve is much shorter than the model and the type of charging station(s) it is compatible with. The
right tail indicating rapid mobilization prior to mandatory evacuation number of EVs of each model can be estimated from the ratio of sales of a
notices, followed by long delays for the last 10% of evacuees. specific model to the total number of EVs sold. Each vehicle entering the
Caution should always be taken when trying to generalize theoretical system is not likely to have the same initial charge. It will be assumed
departure curves from the limited data available for two very different that vehicles will have some preexisting charge between 20% and 100%.
types of emergency. With this in mind, a Rayleigh distribution will be EV owners are unlikely to let their vehicles drain completely to prevent
chosen due to the existing evidence in its favor in both hurricane battery capacity reductions from deep discharges. Lithium-ion batteries
evacuations and the Fort McMurray evacuation. under 20% and above 80% battery charge have severe diminishing
From these departure curves, we can theorize an arrival curve for returns on charging per unit time [71]. It will be assumed that vehicles
charging stations. In short warning notice situations like wildfires, it will above 80% battery charge leave the system immediately (having chosen
be assumed that refueling will likely be the last action before departing, to evacuate without spending further time charging). The number of EVs
taking place during or after the process of gathering family members, requiring charging after removing the EVs already above 80% battery
belongings and supplies, and making other arrangements [42,68–70]. charge, nrEVs , is 44 (rounded to the nearest whole). It can be assumed
This means it can be assumed that for all vehicles that need to charge that preexisting charge is uniformly distributed absent any prior evi
before departure, the cumulative arrival curve at charging stations will dence to the contrary. No abandonment of queues will be assumed
take the same shape as the evacuee departure curve. This simplifies (Fig. 6).
matters greatly, however, it is important to note that significant delays Given the many different factors that go into charging time, charge
due to charging could slow down the rate of departures from the times for EVs using level 2 and level 3 chargers are estimated from
charging stations, and these new delays due to charging would not be manufacturer information. Detailed charging profiles are not supplied
represented in the departure curves of the empirical studies in Section 2. by manufacturers. Service times are assumed to be linear given that
5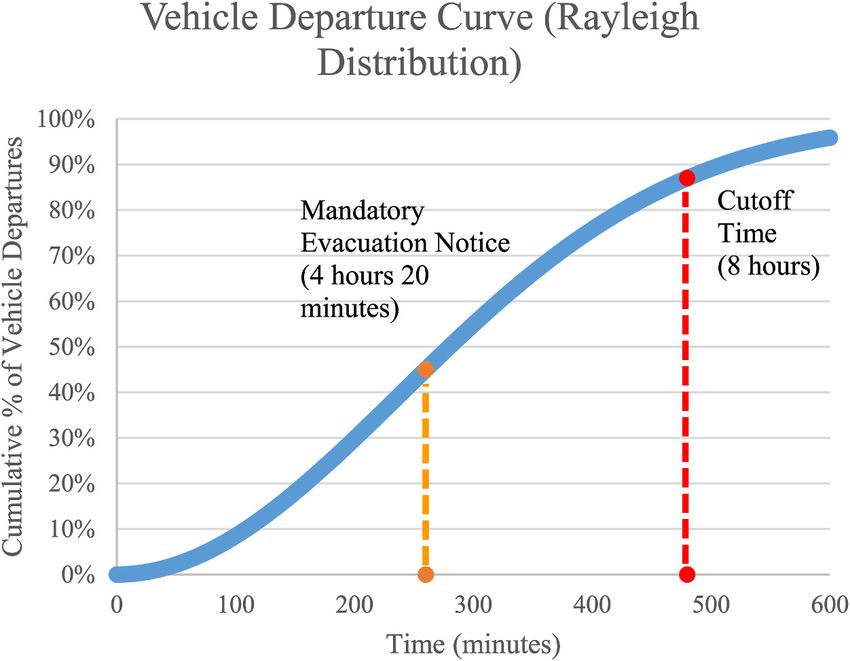
C.D. MacDonald et al. International Journal of Disaster Risk Reduction 56 (2021) 102093
Fig. 4. Departure curve for σ = 237.78.
Fig. 5. Single sample cumulative arrival and interarrival curves for σ = 237.78 and nTotalEVs = 59.
charging speed is roughly constant between 20% and 80% charge level. take into account the actual and perceived levels of service (defined as
The service times are given by Equation (3): the number of gas stations and hotels that actually exist and are the
number believed to exist along the route respectively) when selecting
Sijk = x*Cijk (3)
evacuation routes during hurricanes, and the importance of these factors
Where Sijk is the service time for an EV model i with a charge-to-80% increases as the hurricane approaches. However, accessibility, distance,
time Cijk for a charging class j on a charging station of level k. x is a and road type are significantly more important factors for route choice
uniformly distributed variable between 0.2 and 0.8 that represents the than level of service. It is important to distinguish that these factors help
preexisting charge level of the vehicle. determine route choice, but further research is needed to determine how,
For this scenario, it will be assumed that EVs will charge fully until or if, evacuees take fuel or charge levels of their vehicles into account
reaching 80% charge level. Although there are no destination-surveys when determining destination choice. Range anxiety, which is a concern
for Prince George, evacuation route choice is constrained, and evac for even urban EV owners may combine with imperfect information
uees would need to travel along one of the four evacuation routes out of about charging station availability along their chosen evacuation route
town 228 km westward to Burns Lake, 403 km to northward to Dawson (the perceived level of service), as well as the EV owner’s uncertainty
Creek, 209 km eastward to McBride, or 121 km southward to Quesnel. In about the additional mileage gained per minute of charging, and these
comparison, a mid-size EV such as a Nissan Leaf has a maximum range of factors could further encourage charging to full. As such, for this sce
243 km in older models and 364 km in newer models. There are no nario it will be assumed that EV owners charge without cutoff until the
Research by Akbarzadeh and Wilmot [72] suggests that evacuees do 80% point of steep diminishing returns. Empirical studies of charging
6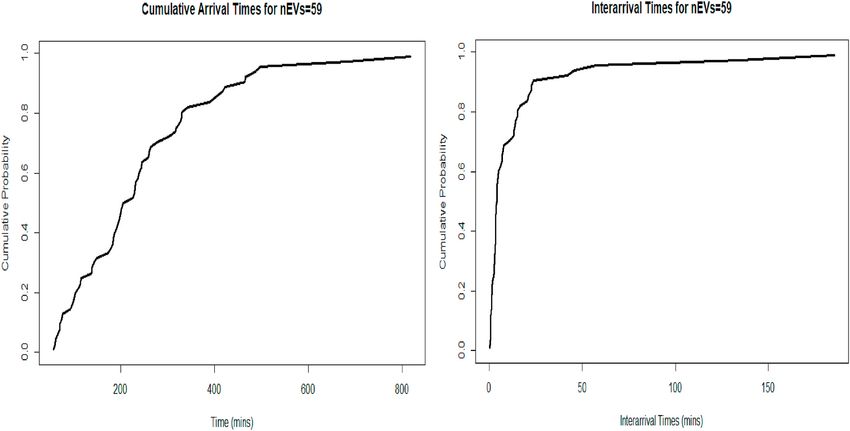
C.D. MacDonald et al. International Journal of Disaster Risk Reduction 56 (2021) 102093
Fig. 6. Relation of battery capacity (State-Of-Charge) and charging speed. Reprinted from "Estimating the charging profile of individual charge sessions of electric
vehicles in the Netherlands" by Mies, J. J., Helmus, J. R., & Van den Hoed, R, 2018, World Electric Vehicle Journal, 9(2), 17. CC BY-NC-ND [71].
behaviour will be needed to generalize this assumption to locations with takes for an EV battery to charge. Charging speed also depends on the
charging stations located along evacuation routes. type of charging station used. Level 1 charging stations are 120V con
Vehicles may only charge at charging stations of compatible nections such as a standard household wall outlet. Level 2 charging
charging classes and compatible charging station levels. Charging is stations are 240V connections and can be installed in homes or parking
first-come, first-served to charging stations that are able to serve vehi lots for an additional cost. Level 3 fast-charging stations have connec
cles of that particular class. A rank r is assigned to each vehicle based on tions of 480V or more. The difference in charging times between levels is
its position in the queue with the oldest arrivals having the lowest rank. quite substantial. A Nissan Leaf can charge to 80% of its capacity in 40
As charging stations of class j become available, the vehicle of the min with a level 3 charger. The charge time increases to 6.5–11 h for a
minimum rank with class j may leave the queue and begin service. If level 2 charger, and 18.5 h for a level 1 charger [73].
multiple stations are available, evacuees will choose to charge at the While recent studies such as Lee et al. [74] examining
charging station with the highest level k compatible with their vehicle business-as-usual EV charging behaviour in California indicate that a
class. It is assumed that evacuees will use the first charging station majority of users make use of home-charging in the present, there are
available of their vehicle class j rather than waiting in the queue in hopes reasons to believe that in an evacuation public charging stations may
that a charging station with a higher level k will open up. Choosing play a larger role when evacuees may value their time differently. A
realistic values for Cijk will involve exploring the characteristics of EVs Nissan Leaf using a public level 3 fast-charging station takes only 6% of
and EV charging stations in more depth (Fig. 7). the time to charge an equivalent amount at a home level 2 charging
EVs charge at different speeds in different situations. Current level of station. During a short-notice evacuation like the wildfire in this sce
charge, battery age, and external temperature can all affect the time it nario, a hypothetical evacuee faces a decision about whether to charge
Fig. 7. Basic structure of the G/G/c/N queueing model used.
7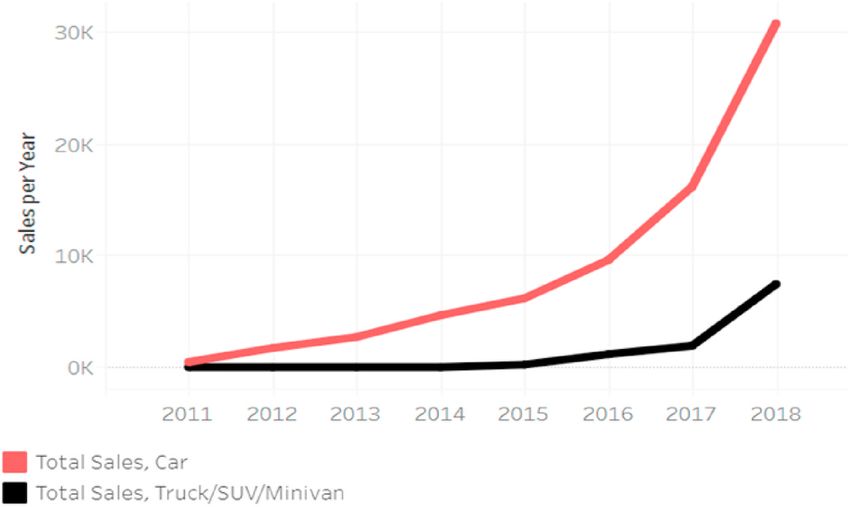
C.D. MacDonald et al. International Journal of Disaster Risk Reduction 56 (2021) 102093
at home for a period of multiple hours or seek out a level 3 fast-charging of this kind and tracks this data. Level 1 charging stations can be dis
station and charge in 20–40 min (the evacuee must also take into ac counted in short-warning scenarios as they have prohibitively long
count the length of time they believe they would spend waiting in the charge times during a short-notice scenario and are theoretically
queue when making this decision). Further research is needed to ‘available’ at any location with a wall outlet.
determine whether evacuees in an emergency situation are likely to
choose to charge faster and depart earlier, potentially avoiding traffic
3.6. Performance measures
and possible danger, or prioritize a shorter charging time so they could
use their EV to gather family and supplies or make other trips.
The most important outputs of this simulation are number of EVs
While home charging is the most frequent mode of charging for EV
requiring charging that were served (nserved ), the total number of EVs
owners in the present day, it is uncertain that it will continue to play
served (ntotalCharged which includes the number of EVs that already had
such a primary role in the future. Early EV adopters are more likely to
above 80% charge before entering the system), percentage of total EVs
have higher incomes and have the resources to install home-charging
served, maximum global queue lengths (Nmaxqueue ), and average queue
stations, as well as own homes which are suitable for installing level 2
times (Tavgqueue ). Taken on its own, the number of vehicles served is an
chargers. Lee et al. [74] note that >80% of respondents in their survey
indication of whether EV charging networks can handle the sudden
had incomes above the California median income, and >80% of re
influx of demand posed by a mass evacuation. The number of EVs un
spondents owned detached single-family homes. As EVs continue to
served will also give an indication of how many vehicles will likely run
decrease in price and the demographics of EV owners shift, it is likely
out of charge en route to their destination. Maximum and average queue
that there will be more reliance on public charging facilities for people
lengths may be a useful indicator of congestion from blocked in
that can not afford to install home charging stations, or do not have the
tersections due to charging; however, these statistics are more useful in
ability to install their own home chargers (renters, people living in areas
predicting area-specific congestion when queues for individual stations
with only on-street parking, people living in multi-family residences
are modelled.
where access to charging stations is limited or shared among multiple
residences). Engels et al. [75] predict that the demand for public
charging infrastructure will continue to increase over time as middle and 4. Results
low-income households without home charging options begin to pur
chase more EVs. As EV ownership becomes more widespread, it is likely The simulation was run 1,000 times for each scenario examined and
that during an evacuation these demographics without access to home all outputs are averages over this number of samples. While there is no
charging will compete with time-sensitive evacuees that have home empirical data to validate the model, the outputs were verified. No runs
charging for public level 3 DC fast-charging charging stations. experienced errors with unexpectedly high or low service times, or with
Level 3 fast-charging stations are commonly found with three very high or very low numbers of EVs served. Queue times and lengths
different specialized connectors: Combined Charging System (CCS), were reported correctly at very high and very low numbers of charging
CHAdeMO, and Tesla Superchargers. Each have the same basic func stations and over long and short cutoff times.
tionality, but different EV models are compatible with one or more of The parameters used for the baseline case are given in Table 1:
these connectors with adapters (see Appendix A for further discussion on The results for the Prince George baseline case are given in Table 2:
charger types). Some models are only capable of making use of level 1 In the baseline case, the charging networks in the city were shown to
and level 2 chargers. Not every level 3 station provides the same charge be not enough to accommodate demand during a mass evacuation under
rate, however, the EV models that have been selected tend to have an the present-day conditions described above. While this insight alone
upper ceiling by design on how quickly they are able to charge. Future may be useful for Prince George as it currently is, what generalizations
EV models and future level 3 charging stations are likely to provide can be extracted for other communities facing similar challenges?
faster charging rates [76]. Not every EV has the same charging profile. The number of EVs (nTotalEVs ) and the number of EVs requiring
To determine which EV charging classes will be used, total EV sales charging (nrEVs ), the cutoff time period (Tevac ), and the number and type
by model up to the year 2017 in Canada are used to determine which of charging stations can be changed to explore potential trends. Sensi
EVs are most common. For Canada, the total vehicle sales by model are tivity analysis is conducted to examine the impact of important pa
available for the country as a whole and by province. Charge times and rameters on the network charging capacity. The parameters examined
ranges for models with shares of greater than 1% of total battery-EV are given in Table 3:
sales were examined. As a simplifying assumption, charge times and For each scenario, for nserved , Nmaxqueue , and Tevac the results were not
ranges are given for the latest make and model of each vehicle. This will normally distributed (Shapiro-Wilk test for normality, p«0.05). Given
increase the average ranges and likely increase charge times for the that the results are not normally distributed, a non-parametric Kruskal-
models chosen. This will provide a less accurate assessment of current Wallis H-test (one-way ANOVA on ranks) was used. All trials resulted in
scenarios which have vehicles of older makes on the road, but is in line statistically significant differences between results (p«0.05).
with the trend of battery improvements to EVs when predicting the The results of the trial in which the number of EVs is changed are
impacts of scenarios that take place in the future. given in Table 4:
As expected, when the number of EVs increases, the percentage of
3.5. Number and type of charging stations EVs in the system that are charged to completion decreases (a difference
The number of public chargers cjk of class j and level k is known with Table 1
some confidence. Resources like ChargeHub [3] offer maps of public Parameters for the Prince George baseline scenario.
charging stations in a location. Other local resources may be used as well Parameter Value
to determine the number, location, and type of charging ports available. nTotalEVs 59
It is up to the judgement on the modeler whether level 2 charging sta nrEVs 44
tions should be included as their long service times may only allow 2–4 Tevac (hours) 8
vehicles to be serviced from 20% to 80% in a 24-h period. It may also be Scale Parameter σ 237.78
difficult to account for the number of private level 2 chargers installed in Level 2 Chargers 8
homes. Data on how many level 2 charging stations have been installed Level 3 SC 0
in homes could potentially be estimated from the number of rebates Level 3 CCS 1
Level 3 CHAdeMO 0
given for installing said chargers, if the location in question has rebates
8
C.D. MacDonald et al. International Journal of Disaster Risk Reduction 56 (2021) 102093
Table 2 an hour before the potential cutoff time, leaving them unable to receive
Results from the Prince George baseline case study. a full charge. Future research will be needed to determine how actual or
Output Mean SD perceived queues at EV charging stations impact the timing at which EV
owners decide to charge their vehicles (Figs. 8–10).
nserved 16 3.58
(# vehicles) The results of the trial in which the evacuation cutoff time is changed
nserved 0.36 are given in Table 5:
nrEVs As expected, when the cutoff time increases, the percentage of EVs in
Nmaxqueue 17 3.62
the system requiring charging that charge to completion increases (a
(# vehicles)
difference of 25% when cutoff time doubles) while maximum queue
Tavgqueue 91.7 21.33
(mins) length decreases (a 53% decrease when cutoff time doubles). Of interest
is that as the cutoff time increases, average queue times increase before
decreasing. These non-monotonic results are due to EVs having a longer
time period in which they can wait in the queue before the simulation
Table 3 cutoff time forces them to leave the system. As the cutoff time continues
Parameters for different scenarios.
to increase, interarrival times become further apart. This means that EVs
Independent Parameters are more likely to show up to an available charging station, as a result
Variable Ratio
decreasing average queue time of the system (Figs. 11–13).
Ratio of # of EVs nTotalEVs nrEVs The results of the trial in which the number of EV charging stations is
Compared to 0.25 15 11
Baseline 0.5 30 23
0.75 44 33
1 59 44
1.25 74 56
1.5 88 66
1.75 103 77
2 118 89
Ratio of Cutoff Time Tevac Scale
Compared to (hours) Parameter σ
Baseline 0.5 4 118.89
1 8 237.78
1.5 12 356.67
2 16 475.56
2.5 20 594.45
Ratio of number of # Level 2 # Level 3
Charging Stations Chargers Chargers
Compared to 0.5 4 0
Baseline 0.5 4 1 (1 CCS)
1 8 1 (1 CCS)
Fig. 8. Percentage of EVs requiring charging charged to completion at different
2 16 2 (2 CCS)
ratios of number of EVs.
3 24 3 (3 CCS)
3 24 3 (1 CCS, 1
CHAdeMO, 1 SC)
of 10.6% when the number of EVs double), while the maximum queues
and average queue times increase (182% increase and 55% increase
respectively when the number of EVs doubles). One thing to note is that
as the number of EVs increases, the number of EVs served increases as
well. Shorter interarrival times as a result of more EVs needing to charge
within the same time period lead to fewer unused charging stations
towards the beginning of the time period examined. However, the de
mand quickly outstrips the number of charging stations available and
the queue becomes saturated.
Even in cases where the number of EVs was reduced to 25% of the
baseline level, 46% of EVs that required charging still did not charge to
completion before evacuating. This is due to the arrival time curves to
the stations not changing. Some vehicles may still choose to arrive only Fig. 9. Maximum queue length at different ratios of number of EVs.
Table 4
Results when ratio of nrEVs to baseline is changed.
Ratio of nrEVs to baseline nrEVs nserved σserved nserved
x 100 Nmaxqueue σmaxqueue Tavgqueue σavgqueue
(# EVs) nrEVs (# EVs) (mins)
0.25 15 6 1.92 54.5% 1 0.133 4.79 6.49
0.5 30 11 2.62 47.8% 3 2.06 26.97 19.67
0.75 44 14 3.23 42.4% 9 3.05 66.27 23.67
1 59 16 3.58 36.4% 17 3.63 91.7 21.33
1.25 74 18 3.57 32.1% 25 3.87 112.05 20.40
1.5 88 20 3.93 30.3% 32 4.43 123.83 18.19
1.75 103 21 3.91 27.3% 40 4.52 134.44 18.41
2 118 23 3.96 25.8% 48 4.68 141.88 17.00
9
C.D. MacDonald et al. International Journal of Disaster Risk Reduction 56 (2021) 102093
The results of the trial in which the level 3 charging stations are
balanced evenly by type (see Appendix A for discussion of level 3
charger types) are given in Table 8:
When the three level 3 CCS charging stations are replaced with a
Fig. 10. Average queue time at different ratios of number of EVs.
changed are given in Table 6:
As expected, when the number of charging stations increases, the
maximum queue length and average queue time decreases (a 76.5%
decrease and 75% decrease respectively when number of charging sta Fig. 11. Percentage of EVs requiring charging charged to completion at
tions doubles, and a 94.1% decrease and 92.8% decrease when the different ratios of cutoff time.
number of charging stations triples). Of interest is that as number of
charging stations increases, the number and percentage of EVs in the
system requiring charging that charge to completion increases before
decreasing (from 27.3% of EVs charged at baseline to 45.5% at twice the
number of charging stations, before falling to 40.9% at triple the number
of charging stations). This is a side effect of the queueing behaviour
implemented. EVs will always take the first available charger of the
highest level available to them. Instead of waiting for a level 3 charger to
be available, an EV will always take an unoccupied level 2 charger. This
has the effect of slotting more EVs that could potentially make use of a
level 3 charger into a level 2 charger instead. Queueing reduces the
likelihood of this happening, as an EV that could make use a Level 3
charger might become placed in queue behind vehicles that can only
make use of level 2 chargers. When a level 3 charger opens up, the EV
that could make use of it “jumps the queue” ahead of the vehicles that
could only make use of level 2 chargers. In effect some amount of
queueing increases the likelihood that a vehicle that can make use of a Fig. 12. Maximum queue length at different ratios of cutoff time.
level 3 chargers uses it instead of a level 2 charger. This behaviour
represents a very risk averse evacuee who would rather take a guaran
teed slot at a level 2 charger rather than gamble additional time spent in
a queue to try and get a slot at a level 3 charger. In reality, some people
would be likely to take this gamble (Figs. 14–16).
Two final trials were conducted to determine the impact of the types
of charging stations in the system. Both trials were compared with each
other and were found to have statistically significant differences be
tween results (p < 0.05). The results of the trial without and with a level
3 charging station are given in Table 7:
As expected, when the one level 3 charging station is replaced with a
level 2 charging station, there is a significant decrease in charging
network capacity, in this case a 33.3% decrease in the number of EVs
requiring charging served. The percentage of EVs in the system that are
charged to completion decreases (a difference of 9.1%), while the
maximum queues and average queue times increase (a 12.0% increase
and a 13.8% increase respectively) (Fig. 17). Fig. 13. Average queue time at different ratios of cutoff time.
Table 5
Results when ratio of Tevac to baseline is changed.
Ratio of Tevac to baseline Tevac nserved σserved nserved
x 100 Nmaxqueue σmaxqueue Tavgqueue σavgqueue
(h) (# EVs) nrEVs (# EVs) (mins)
0.5 4 10 2.79 22.7% 22 3.11 59.99 10.64
1 8 16 3.58 36.4% 17 3.63 91.70 21.33
1.5 12 22 3.79 50.0% 12 3.60 100.20 31.91
2 16 27 3.87 61.4% 8 3.36 88.59 38.78
2.5 20 30 4.01 68.2% 5 2.83 67.31 38.64
10C.D. MacDonald et al. International Journal of Disaster Risk Reduction 56 (2021) 102093
Table 6
Results when ratio of number of charging stations to baseline is changed.
Ratio of # of Charging Stations to baseline # of Level 2 Chargers # of Level 3 Chargers nserved σserved nserved
x 100 Nmaxqueue σmaxqueue Tavgqueue σavgqueue
(# EVs) nrEVs (# EVs) (mins)
0.5 4 1 12 3.00 27.3% 25 3.17 146.25 24.53
(1 CCS)
1 8 1 16 3.58 36.4% 17 3.63 91.70 21.33
(1 CCS)
2 16 2 20 3.53 45.5% 4 3.01 22.71 13.37
(2 CCS)
3 24 3 18 3.12 40.9% 1 0.213 6.56 4.59
(3 CCS)
CCS, CHAdeMO, and SC station, there is a significant increase in
charging network capacity, in this case a 61.1% increase in the number
of vehicles served. The percentage of EVs requiring charging in the
system that are charged to completion increases (a difference of 25%),
while the maximum queues and average queue times decrease (a dif
ference of 9.0%). While this may not have as large an effect in the future
when charging stations with different adapters become more prevalent,
or charging adapters become standardized, in the present systems with
an unbalanced makeup of level 3 charging stations are at a disadvantage
when compared with systems where the makeup of level 3 charging
stations is more evenly balanced (Fig. 18).
It was found that with respect to maximum queue lengths, the model
is most sensitive to decreasing the number of EVs, followed by
increasing the number of chargers, followed by increasing Tevac . With
respect to the number of vehicles served, the model is most sensitive to
increasing the window of time between the voluntary evacuation notice
Fig. 14. Percentage of EVs requiring charging charged to completion at
different ratios of number of charging stations. and the interruption of charging, Tevac , followed by decreasing the
number of vehicles, followed by increasing the number of chargers
available. With respect to average queue times, the model is most sen
sitive to increasing the number of chargers, followed by decreasing the
number of vehicles, followed by increasing Tevac . Ensuring a balanced
makeup of level 3 chargers will increase the number of vehicles that can
be charged in a mass evacuation.
5. Discussion
The results of the case studies modelled indicate that EVs will likely
pose problems in a mass evacuation scenario in the present. Whether
these problems will persist into the future will depend on a number of
factors, particularly how fast EV ownership grows, how many EV
charging stations are installed and when they are installed, and trends in
battery capacities and charging speeds.
The results from the queueing model indicated that Prince George
Fig. 15. Maximum queue length at different ratios of number of does not have enough charging network capacity to accommodate all
charging stations. EVs in a mass evacuation. Only 36% of vehicles requiring charging were
charged to completion before being forced to depart. In addition to this,
queue times were found to be very long at 92 min. There is a significant
opportunity cost for evacuees waiting in queues, as they could spend this
time gathering family members and supplies or making other prepara
tions for the evacuation. Max queue lengths were found to be 17 vehicles
long. Maximum queue lengths will be of more interest when they are
location-specific. Unlike gas stations, many charging stations are today
located in parking lots. It will depend on the layout of these charging
stations whether queues may spillover into nearby streets, or whether
there will be enough parking spots to accommodate maximum queues.
As the number of EVs increase, potential traffic disruptions from long
queues will become a more pressing consideration. The trends found
during this case study should hold for most locations.
It would be wise to keep in mind what factors policymakers have
control over. The number of EVs and the models of those vehicles will
largely be out of policymaker’s hands and to some extent, so too will the
Fig. 16. Average queue time at different ratios of number of charging stations.
period of time in which the evacuation takes place (Tevac ). Tevac will
depend on the type of emergency being planned for, and emergency
11C.D. MacDonald et al. International Journal of Disaster Risk Reduction 56 (2021) 102093
Table 7
Results without and with a level 3 charging station.
Ratio of # of Charging Stations to baseline # of Level 2 Chargers # of Level 3 Chargers nserved σserved nserved
x 100 Nmaxqueue σmaxqueue Tavgqueue σavgqueue
(# EVs) nrEVs (# EVs) (mins)
0.5 5 0 8 2.29 18.2% 28 2.87 160 23.52
0.5 4 1 12 3.00 27.3% 25 3.17 146.25 24.53
(1 CCS)
Fig. 17. Percentage of EVs requiring charging charged to completion without and with level 3 chargers, maximum queue length without and with level 3 chargers,
and average queue time without and with level 3 chargers.
Table 8
Results with unbalanced and balanced level 3 charging station types.
Ratio of # of Charging Stations to # of Level 2 # of Level 3 Chargers nserved σserved nserved
x Nmaxqueue σmaxqueue Tavgqueue σavgqueue
baseline Chargers (# nrEVs (# EVs) (mins)
EVs) 100
3 24 3 18 3.12 40.9% 1 0.213 6.56 4.59
(3 CCS)
3 24 3 (1 CCS, 1 CHAdeMO, 1 29 3.60 65.9% 0 0 5.97 4.45
SC)
Fig. 18. Percentage of EVs requiring charging charged to completion without and with a balanced makeup of level 3 charging station types, maximum queue length
without and with a balanced makeup of level 3 charging station types (no queue for the balanced makeup scenario), and average queue time without and with a
balanced makeup of level 3 charging station types.
12C.D. MacDonald et al. International Journal of Disaster Risk Reduction 56 (2021) 102093
managers can be aware that a shorter Tevac by moving up mandatory Thus, while the analysis in this paper focusses on evacuations, with some
evacuation notices will increase problems associated with EV charging extensions the model can estimate the charging capacity under business-
and as a result on the number of EVs stalled en route to their destination as-usual or other planning scenarios.
post-departure. Charging and fueling will have to be weighed against A computer simulation model was developed and tested using Prince
other considerations when determining when to give a mandatory George, British Columbia, as a case study. The model agrees with trends
evacuation notice, as discussed in Chapter 5 of Lindell et al. [39]. intuitively expected and provides quantitative estimates that can be
Emergency managers may be able to reduce the time between voluntary adjusted to fit a variety of communities and situations, particularly those
and mandatory evacuations and as a result shift departure curves for the involving remote communities at risk from wildfires. Sensitivity analysis
evacuation to encourage vehicles to charge and fuel earlier before loss of was conducted to examine the impact of a larger number EV ownership
services at charging and fueling stations. Even if earlier notices can be rate, the number and type of charging stations and duration of evacu
given, there are further trade-offs to be considered when issuing ation window on the charging capacity of the examined network. The
voluntary and mandatory evacuation notices. Vehicle charging needs to results of the queueing model indicated that, in the present, Prince
be weighed against the cost of issuing earlier warnings which may not George’s EV charging network does not have the capacity to handle a
end up requiring mandatory evacuations. This imposes significant op short-notice mass evacuation. The results of the sensitivity analysis
portunity costs on evacuees who choose to evacuate unnecessarily [77]. indicate that as the number of EVs increased and the number of charging
Policymakers may have some element of control over how many EV stations decreased, the percentage of EVs that could be served signifi
charging stations there are, and the type of charging stations available. cantly decreased, as expected. Providing a longer window for evacua
Subsidies to build EV chargers of certain classes that have adapters that tion by giving earlier voluntary and mandatory evacuation notices
are not currently available would help ensure all vehicles have some increases the number of vehicles that can be served. Emergency man
access to a level 3 charging station (if they can make use of level 3 agers may consider issuing earlier notices to EVs to charge and fuel
chargers). Policymakers can also subsidize the construction or operation earlier. However, there are some related risks to be considered when
of new level 3 public charging stations, or level 2 home charging sta issuing earlier warnings that may not end up requiring a mandatory
tions, if there is a risk of their location needing to undergo a mass evacuation. Another important finding that policymakers potentially
evacuation. Of course, the cost of these subsidies needs to be weighed have a degree of control over is that of increasing the capacity of
against the likelihood of a mass evacuation occurring and the costs charging station network especially in jurisdictions where it is deemed
associated with the total delays imposed by stalled EVs as a result of insufficient for evacuations. For instance, for the examined case study,
inadequate charging capacity. while maintaining the same number of charging stations having a
To reduce demand on charging networks in the pre-departure stages, balanced makeup of level 3 fast chargers of different types substantially
another potential policy intervention is to reduce the distance between increases the capacity of charging networks.
charging stations along evacuation routes to reduce the amount of time Future work could examine how charging network capacity changes
EVs would need to charge before departing. Some work to determine as charging station adapters become standardized and as EV battery
optimal interurban placement of fueling and charging stations has sizes increase over time. Future work could also further explore the
already been done by Gao et al. [78] and Colmenar-Santos et al. [18] behavioural dynamics of charging or refueling before evacuations to
respectively. While it is likely that there will be a greater number of better understand arrival times to stations and queueing behaviour.
interurban charging stations in the future, subsidies to accelerate the More complex models aimed at fully understanding a certain location’s
rate at which they are built could be justified in part on the grounds of evacuation dynamics could also incorporate travel time from residences
increased performance during evacuations. to charging stations and consider the effects of evacuation traffic on
It is possible that as the number of charging stations along evacua those travel times, as well as the potential impacts of EV charging on
tion routes increases, EV charging networks will perform better than evacuation traffic patterns, such as queues of EVs backing up onto streets
conventional fuel networks. While conventional fueling stations may and impeding traffic. Incorporating imperfect information about
have fuel shortages during periods of high demand, EV charging stations charging station locations, charger adapters and compatibility, and
can continue to operate as long as they have access to a power supply. If unknown queue lengths is another level of complexity which could be
charging stations have grid access or are able to make use of off-grid explored. Incorporating charging cutoff times if evacuees are knowl
solar, they may be able to service more vehicles than a fueling station edgeable of EV charging stations could add a further level of precision to
that runs out of fuel during an evacuation. Legislation exists in Florida future work, however, there are unsettled behavioural questions about
and New York that requires gas stations along evacuation routes to have charging behaviour during an evacuation that would need to be
back-up power generators at gas stations [79,80]. No similar require explored first. These considerations would aid both evacuation planning
ment exists for EV charging stations along evacuation routes. This in the present day and planning for the location of future charging
legislation would not guarantee that charging stations could be used stations.
during evacuations due to the inadequacy of back-up generator power Research is needed to explore charging and refueling behaviour, and
output to meet EV charging needs, as well intermittency issues with whether pre-evacuation charging behaviour for EVs is significantly
off-grid solar photovoltaic charging systems [81]. Evacuations with different than refueling behaviour for internal combustion-engine ve
compounding factors, like large amounts of smoke from wildfires or hicles. More specifically, research is needed to determine how actual or
heavy cloud cover during hurricanes, could interrupt service at off-grid perceived queues at EV charging stations impact the timing at which EV
systems. owners decide to charge their vehicles. Determining whether there is a
Emergency preparedness may be just one reason among many to maximum amount of time EV owners are willing to wait in a queue to
subsidize EV charging infrastructure. charge vehicles could inform whether it is reasonable to assume there is
no abandonment in the queueing model. Research is also needed to
6. Conclusion and future research determine whether EV owners, particularly those with level 2 charging
stations at home, would risk leaving their home to queue for a level 3
In summary, EVs bring a number of benefits to society, however, charging station.
mass evacuations may be one area where at the present time they may be More research could be done to determine the likelihood that evac
more of a liability than an asset. The problem of EV charging during uees will take an EV if they own an ICEV as well. Some households might
evacuations will magnify over time as EVs continue to grow in popu choose to leave an EV behind and only take a single ICEV if they are
larity. The model developed has the flexibility to incorporate different concerned about charging times or vehicle range during an evacuation.
EV makes and models, as well as different levels of charging stations. Understanding these changes in behaviour would be valuable to inform
13You can also read