Integrated Water Resource
Management for the Cardrona River
←
→
Page content transcription
If your browser does not render page correctly, please read the page content below
Integrated Water Resource Management for the Cardrona River
© Copyright for this publication is held by the Otago Regional Council. This publication may
be reproduced in whole or in part provided the source is fully and clearly acknowledged.

Published December 2011

ISBN: 978-0-478-37615-9

Prepared by Matt Dale and Jens Rekker
Integrated Water Resource Management for the Cardrona River                                    i

Foreword
Otago’s rivers and streams are a major feature of any Otago landscape and help make the
region what it is. The clean waters provide a rich ecological environment, serve rural and
urban communities, and act as a tourist attraction. In many parts of the region, surface waters
are vital for irrigation water, which enables or enhances primary production during the dry
summer months. The future development and prosperity of Otago depends on water.
However, much of Otago has long been recognised as a water-short area, and consequently
the province is constantly at the forefront of water management in New Zealand.

A key thrust of the Regional Plan: Water is its emphasis on the progressive implementation of
minimum flow regimes for streams and rivers throughout the region. The goal of these
minimum flows is to maintain the stream’s aquatic ecosystem and natural character during
periods of low flow, while providing for the socio-economic and cultural values of the
community. Furthermore, setting appropriate allocation limits for surface water and
groundwater as well as promoting water-use efficiency are integral for ensuring reliable
access to the water resource.

The Cardrona catchment drains into the Upper Clutha River/Mata-Au and the underlying
aquifer includes parts of the Wanaka Township. This area has experienced recent substantial
growth in residential development, expansion in tourism and agricultural intensification. The
changes all bringing increased pressure on the surface and underground water resources. It is
essential to fully understand the natural hydrology or an area before effective and efficient
sustainable management decisions can be made for the future.

In Otago, surface water supplies are heavily allocated. Over abstraction can result in
degradation of a stream’s natural values and character. Therefore, careful management is
required to keep rates of taking sustainable. The best way forward is to use this valuable water
resource to our advantage and to implement allocation limits and minimum flows so that over
abstraction does not occur.

This report has drawn together historical surface and groundwater information,    along with a
recent series of low flow gauging and an assessment of instream values to         help in that
decision making process. The selection of an appropriate minimum flow             depends on
evaluating instream values and attempting to balance these against flow           management
objectives that keep in mind the value of the water for other users.

Cardrona River Water Resource Management Report
ii                                    Integrated Water Resource Management for the Cardrona River

Executive Summary
The water resources of the Cardrona River will potentially undergo a substantial shift in
future water management for reasons which include:
    • the proposed setting of the Cardrona River minimum flow;
    • the proposed setting of the Wanaka – Cardrona Aquifer maximum allocation volume;
    • establishment of surface water – groundwater management regime for the Cardrona
        Alluvial Ribbon Aquifer under Water Plan Change 1C; and,
    • the transition from mining privilege water rights to conventional water permits.

To assist with these changes the Council has completed work which has improved the
technical understanding of the Cardrona River, Cardrona Alluvial Ribbon Aquifer and the
Wanaka – Cardrona Aquifer in terms of aquatic habitat, surface hydrology and groundwater
hydrology.

The investigation of water resources both above and below ground are reported together
recognising the strong interconnection between the surface and groundwater for future
integrated management options. This report provides a technical description for any future
water allocation and management regime and in turn, may provide mining privilege holders
more certainty as to the eventual regulatory environment in transitioning to conventional
water permits.

The Cardrona River catchment comprises the slopes and high altitude valley between the
Cardrona and Criffell Ranges. Below The Larches Station, the Cardrona River empties out
onto the Wanaka – Cardrona flats. From here the river flows over the Wanaka – Cardrona
Aquifer before joining the Clutha River/Matau-Au at Albert Town.

The Cardrona River can be separated into three main hydrological sections; a neutral reach
(upstream of The Larches), a losing reach in which surface water in lost to groundwater
(between The Larches and SH6), and a gaining reach (downstream of SH6) in which surface
flows are recharged from groundwater. Flow monitoring undertaken during the winter
months (in the absence of surface water abstraction) indicates that approximately 0.7m³/s of
surface flow is the net loss to groundwater in the losing reach. When surface flows cease
upstream of SH6, there is still a perennial base flow of approximately 0.3m³/s in the Cardrona
River at the Clutha River/Mata-Au confluence.

The Cardrona River in the vicinity of The Larches is turned out into four major water races
managed within the mining privilege system under nine mining rights with at least two dozen
shareholders. A legal potential take of 1.278m³/s is apportioned to these rights. Although
these represent the largest takes in the catchment they are not able to take their full allocation
for the latter half of the irrigation season due to low flows in the Cardrona main stem.

There are 27 consumptive surface water takes upstream of The Larches, with a combined
consented take of 1.13m³/s. Many of these takes are from small tributaries that flow much
less than consented rates of take during late summer, therefore it is likely that the actual take
is significantly less than that consented for much of the irrigation season.

                                                   Cardrona River Water Resource Management Report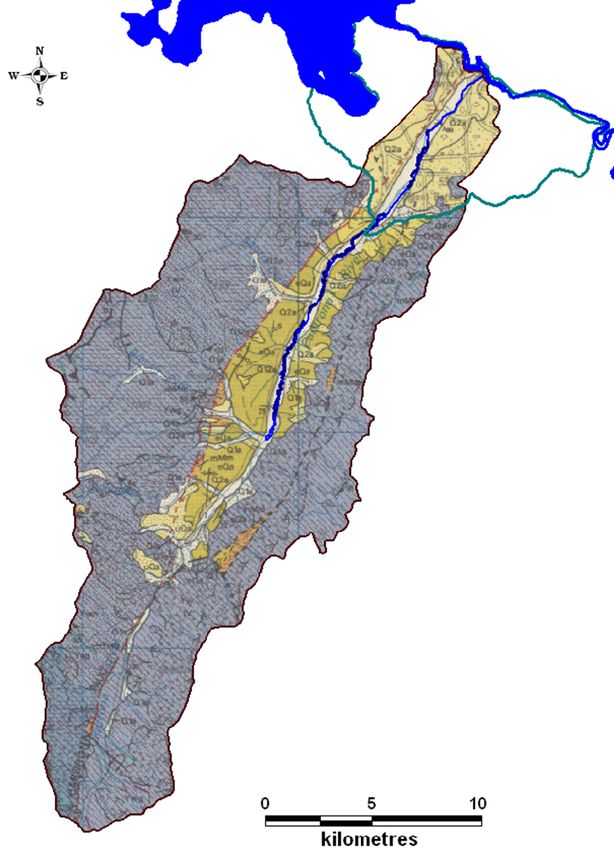
Integrated Water Resource Management for the Cardrona River                                    iii

The river is well known for drying up in the reach between The Larches and State Highway 6
during distinct periods within Summer and Autumn. The onset of one such drying event was
measured intensively by ORC at the end of January 2010. At this time 0.9m3/s flowed past
the Larches flow recorder from the upper valley, 0.5m3/s was taken by water races around The
Larches (after by-wash back to the river was accounted for) and the remaining 0.4m3/s soaked
into the river bed and aquifer downstream of the last water race intake.

The Wanaka – Cardrona Aquifer responds directly to changes in the rate of infiltration from
the river to the aquifer. The aquifer water table drops up to 1.5m in the weeks following
drying phases. However, the interaction between the river and aquifer upstream of Ballantyne
Road is one-way, being infiltration through an unsaturated thickness of gravel. The lower
Cardrona River downstream of State Highway 6 receives a steady augmentation from the
aquifer of approximately 0.3m3/s regardless of dry events in the upstream river. Changes in
the water table can have a low to moderate effect on the rate of seepage to the lower river.

The Cardrona River is listed in the Regional Plan: Water as having a significant presence of
eels, rare invertebrates and adult trout. In addition, there is significant habitat for juvenile
trout and trout spawning. The Cardrona River supports four species of native fish (upland
bully, longfin eel, koaro and Clutha flathead galaxias) and three species of introduced sports
fish (brown trout, rainbow trout and brook char).

Upland bully are considered to be common and inhabit the edge habitat of the river where
they are relatively unaffected by reductions in flow. Longfin eel are classified as being in
“gradual decline”, although the barriers to migration (Clyde and Roxburgh dams) have all but
removed this species from the catchment. Clutha flathead galaxias are listed as being in
gradual decline and are considered to be of high conservation importance, however they are
not able to coexist with large trout and their distribution is limited to small tributaries were
trout are absent. Because of this restriction in distribution, they will be relatively unaffected
by a minimum flow set on the main stem of the Cardrona.

The middle and upper reaches of the Cardrona River supports a locally important brown trout
fishery. Many trout from the upper Clutha River/Mata-Au remain in the Cardrona River
throughout spring and are targeted by anglers early in the fishing season.

An Instream Flow Incremental Methodology (IFIM) study was undertaken in the Cardrona
River in the vicinity of The Larches flow recorder. The survey reach was dominated by
shallow riffles with very few runs and pools. IFIM measures changes in available habitat for
fish species over a range of flows. Using IFIM, flows that provide optimum habitat have been
identified as well as thresholds below which there is a significant increase in the rate of
habitat reduction with decreasing flow (point of inflection). Where there is no clear point of
inflection, the flow that provides 70% of the habitat available at MALF is used. The results
of the IFIM study showed that there was very little available habitat for adult brown trout and
adult longfin eels throughout the range of flows modelled, though a substantial amount of
habitat is available for juvenile trout between 1m³/s and 1.5m³/s. This is consistent with the
riffle-dominated nature of the survey reach.

Among the options for future water management would be to reduce reliance on the water
race system in favour of bore water supplies for irrigation. This option would maximise the

Cardrona River Water Resource Management Report

iv                                  Integrated Water Resource Management for the Cardrona River

amount of time that the Cardrona River was wet from headwaters to confluence and
consequently the amount of river recharge to the aquifer. The bore water supplies, being
piped at bore head, could be employed in higher efficiency methods of irrigation, thereby
freeing up further water resource while sustaining the same level of agricultural production.

     Management      Predicted   Predicted
     flow: Clutha     flow at     flow at
     River/Matau-       SH6         The                 Effects on instream values
     Au confluence    bridge      Larches
         (m³/s)        (m³/s)      (m³/s)
                                             Flows at SH6 are equal to the flow recommended to
                                             maintain a juvenile brown trout fishery. Flows at
          0.7           0.4         1.1
                                             The Larches are close to MALF. Significant
                                             increase in recharge to Wanaka aquifer.
                                             Flows at Clutha confluence are equal to the flow
                                             recommended to maintain a juvenile brown trout
          0.4           0.1         0.8      fishery. Flow continuity is maintained throughout
                                             the losing reach. Increase in recharge to Wanaka
                                             aquifer.

Based on this work a Maximum Allocation Volume (MAV) of five million m3/y should be
considered for the Wanaka – Cardrona Aquifer. Should it be shown that the options for
management flows in the lower Cardrona River would definitively result in greater recharge
to the aquifer, this may provide latitude to increase the MAV of the Wanaka – Cardrona
Aquifer.

It is also suggested based on this work that the Cardrona Alluvial Ribbon Aquifer be managed
in conjunction with the Cardrona River, including observance of any minimum flow and
allocation limits.

                                                  Cardrona River Water Resource Management Report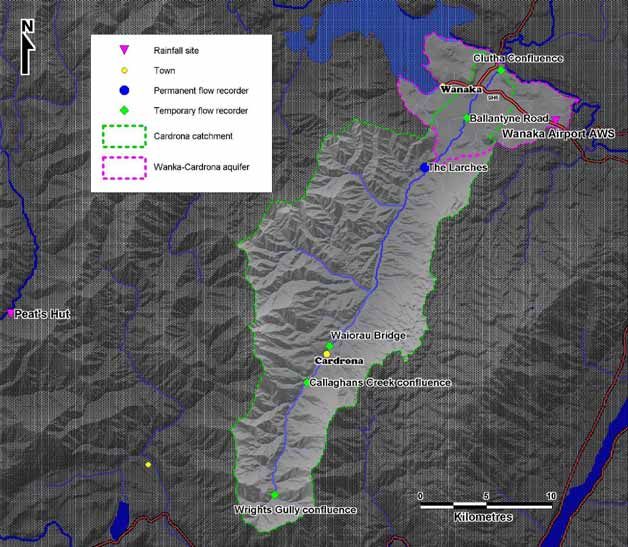
Integrated Water Resource Management for the Cardrona River                                                                          v

Table of Contents

1        Introduction                                                                                                                1
         1.1       Background .................................................................................................... 1
         1.2       Aims and objectives ....................................................................................... 1
         1.3       Previous studies ............................................................................................. 2
2        Setting                                                                                                                     3
         2.1       Location and topography ............................................................................... 3
         2.2       Climate and rainfall........................................................................................ 3
         2.3       Geology .......................................................................................................... 7
         2.4       Hydrology .................................................................................................... 11
                   2.4.1        Cardrona River: Summary ............................................................. 11
                   2.4.2        Surface water/groundwater interactions ........................................ 13
                   2.4.3        Flow statistics ................................................................................ 15
                   2.4.4        Annual 7-day low flows and their frequency analyses .................. 16
         2.5       Water quality ................................................................................................ 19
                   2.5.1        Surface water quality ..................................................................... 19
                   2.5.2        Groundwater quality ...................................................................... 19
3        Groundwater hydrology                                                                                                     20
         3.1       Basin margins............................................................................................... 20
         3.2       Aquifer properties ........................................................................................ 20
         3.3       Groundwater flow pattern ............................................................................ 21
         3.4       Aquifer water balance .................................................................................. 23
                   3.4.1        River recharge ................................................................................ 23
                   3.4.2        Rainfall recharge ............................................................................ 29
                   3.4.3        Irrigation recharge ......................................................................... 29
                   3.4.4        Bullock Creek discharge ................................................................ 29
                   3.4.5        Cardrona River discharge .............................................................. 30
                   3.4.6        Clutha River/Mata-Au discharge ................................................... 30
                   3.4.7        Lake Wanaka discharge ................................................................. 30
                   3.4.8        Water balance: Summary ............................................................... 30
4        Instream values of the Cardrona River                                                                                     31
         4.1       Fish species .................................................................................................. 31
                   4.1.1        Native fish ...................................................................................... 31
                   4.1.2        Sports fish ...................................................................................... 33
         4.2       Natural values of the Cardrona River .......................................................... 35

Cardrona River Water Resource Management Report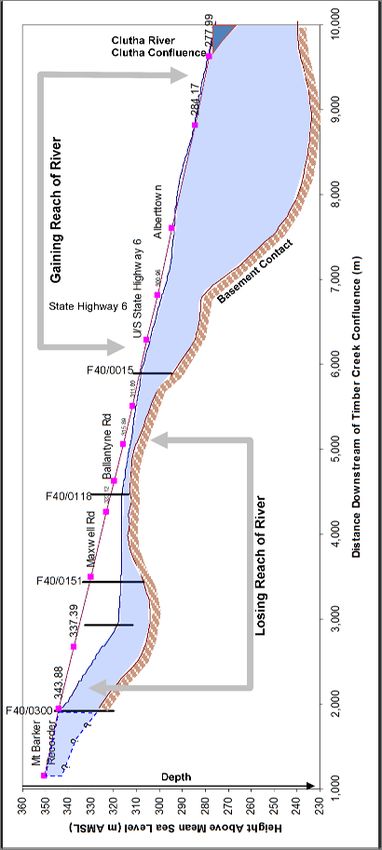
vi                                            Integrated Water Resource Management for the Cardrona River

                  4.2.1        Sports fishery values ...................................................................... 35
                  4.2.2        Biodiversity values ........................................................................ 35
5    Water management                                                                                                            37
     5.1          Historic management ................................................................................... 37
     5.2          Current management .................................................................................... 37
                  5.2.1        Surface water ................................................................................. 37
                  5.2.2        Groundwater .................................................................................. 37
                  5.2.3        Alluvial Ribbon Aquifer ................................................................ 38
     5.3          Current surface water management setting .................................................. 38
6    Groundwater modelling                                                                                                       41
     6.1          Model framework......................................................................................... 41
     6.2          Permeability and other parameters............................................................... 41
     6.3          Rainfall and irrigation .................................................................................. 41
     6.4          Interfaces with surface water ....................................................................... 41
     6.5          Calibration.................................................................................................... 42
                  6.5.1        Calibration data sets ....................................................................... 42
                  6.5.2        Steady-state calibration .................................................................. 42
                  6.5.3        Transient calibration ...................................................................... 42
     6.6          Scenario modelling ...................................................................................... 43
                  6.6.1        Groundwater levels ........................................................................ 44
                  6.6.2        Aquifer outflows ............................................................................ 44
7    Instream habitat requirements for flow                                                                                      46
     7.1          Physical habitat survey ................................................................................ 46
     7.2          Instream Flow Incremental Methodology (IFIM): Summary ...................... 46
                  7.2.1        Habitat preferences and suitability curves ..................................... 46
     7.3          IFIM for the Cardrona River ........................................................................ 47
                  7.3.1        Effects of changes in flow for available habitat for introduced
                               sports fish ....................................................................................... 48
                  7.3.2        Effects of changes in flow for available habitat for native fish ..... 50
8    Evaluation of allocation and management options                                                                             52
     8.1          Suggested management flows and their effects on instream values ............ 52
     8.2          Relationship between suggested management flows and current flow
                  conditions ..................................................................................................... 53
9    Concluding discussion                                                                                                       56
     9.1          Options for combined water management ................................................... 56
10   References .................................................................................................................. 58

                                                                  Cardrona River Water Resource Management Report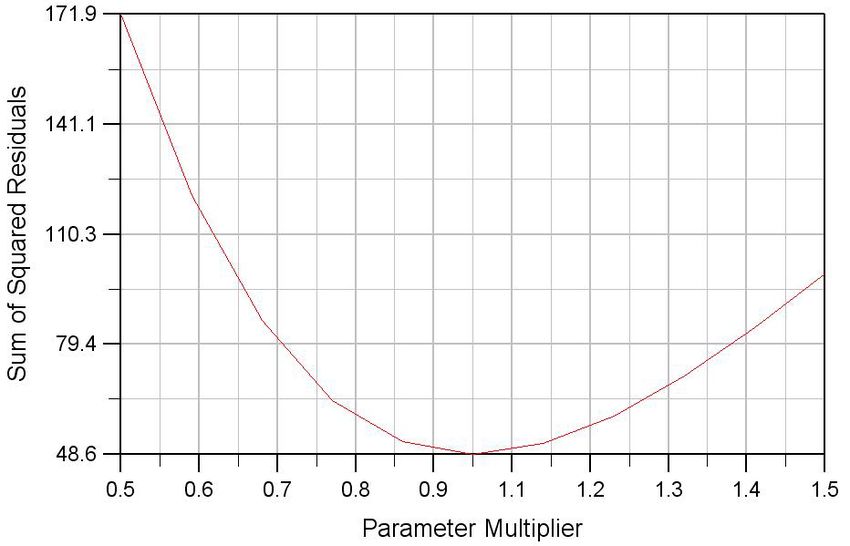
Integrated Water Resource Management for the Cardrona River                                                                            vii

Appendix A: Recharge modelling .......................................................................................... 61
Appendix B: Groundwater modelling: Technical development ............................................ 66
Appendix C: Consented groundwater takes within the Wanaka-Cardrona Aquifer and
            Cardrona Alluvial Ribbon Aquifer ................................................................... 75
Appendix D: Guidelines of habitat retention required for instream values (Jowett & Hayes,
            2004) ................................................................................................................. 78

Table of Figures

Figure 1:       Catchment location, plus low flow and rainfall sites used in the Cardrona
                management flow study........................................................................................... 4
Figure 2:       Average monthly rainfall totals for Wanaka AWS and Peat's Hut ......................... 5
Figure 3:       Long-term rainfall trends for Wanaka AWS ........................................................... 6
Figure 4:       Long-term rainfall trends for Peat's Hut .................................................................. 6
Figure 5:       Cardrona Catchment geology from 1:250,000 scale Geological and Nuclear
                Sciences QMap ........................................................................................................ 9
Figure 6:       Outline geology of the Wanaka Basin ................................................................... 10
Figure 7:       Flow recorders in the Cardrona catchment............................................................ 12
Figure 8:       Neutral, losing and gaining reaches of the Cardrona River .................................. 13
Figure 9:       A disconnected loosing reach, where surface water and groundwater become
                decoupled and separated by an unsaturated zone (Winter et al, 1998) ................. 14
Figure 10: A gaining reach, where the stream gains water from a connected shallow aquifer
                (Winter et al, 1998) ............................................................................................... 14
Figure 11: Surface flows in the lower Cardrona River during the 2009-10 irrigation season 16
Figure 12: Comparison of annual 7-day low flows at The Larches flow recorder ................. 17
Figure 13: Comparison of flow and rainfall trends between The Larches flow recorder and
                Wanaka AWS rainfall site ..................................................................................... 18
Figure 14: Comparison of flow and rainfall trends between The Larches flow recorder and
                Peat's Hut rainfall site ............................................................................................ 18
Figure 15: Water table contour map drawn from May 1995 measurements .......................... 22
Figure 16: Cross section along Cardrona River from The Larches recorder to Clutha
                confluence ............................................................................................................. 24
Figure 17: Schematic profile of the lower Cardrona River, illustrating changes in flow rate on
                31 March 1999 and inflocation of losing and gaining reaches of the river ........... 26

Cardrona River Water Resource Management Report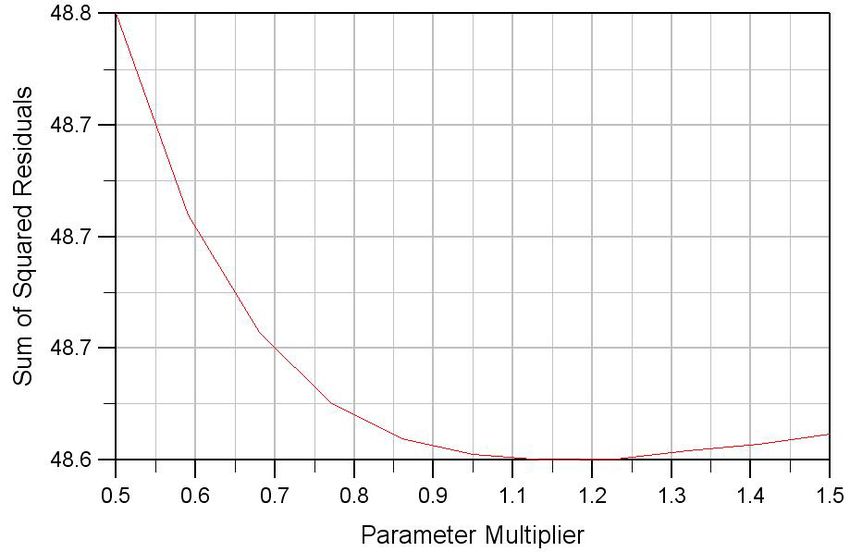
viii Integrated Water Resource Management for the Cardrona River
Figure 18: Flow in the Cardrona River and groundwater level measured either side of
Ballantyne Road, beginning in late January 2010, illustrating the effect of the river
drying up in the middle reaches ............................................................................ 27
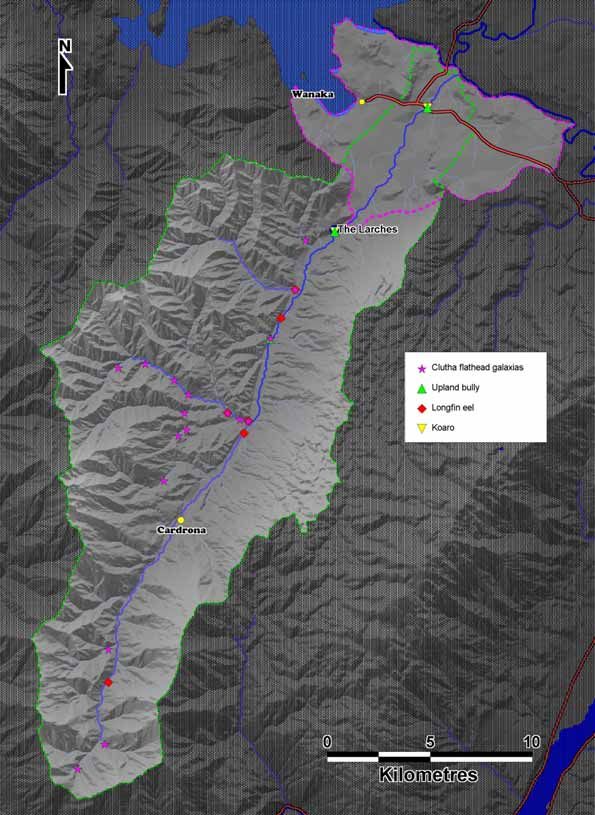
Figure 19: Distribution of native fish species in the Cardrona catchment .............................. 32
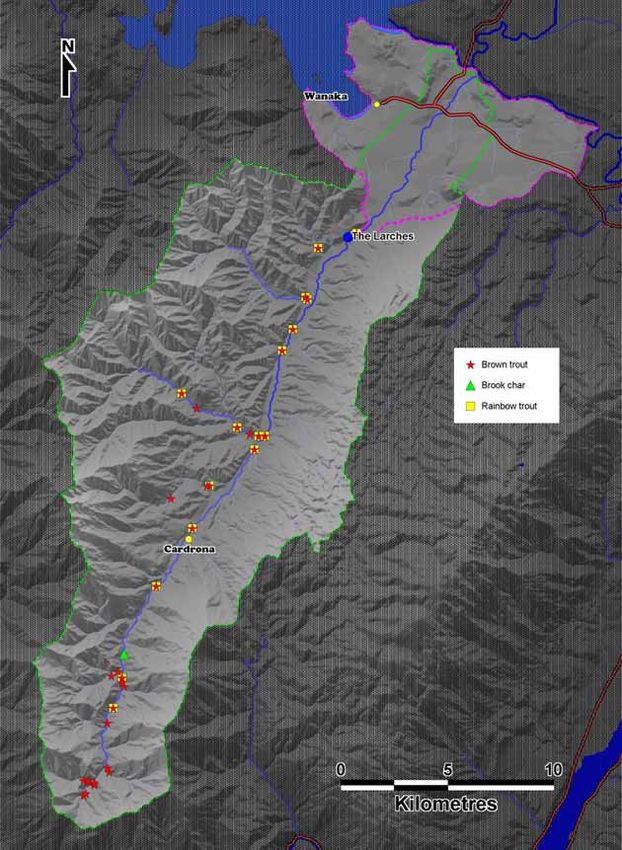
Figure 20: Distribution of introduced sports fish in the Cardrona catchment ........................ 34
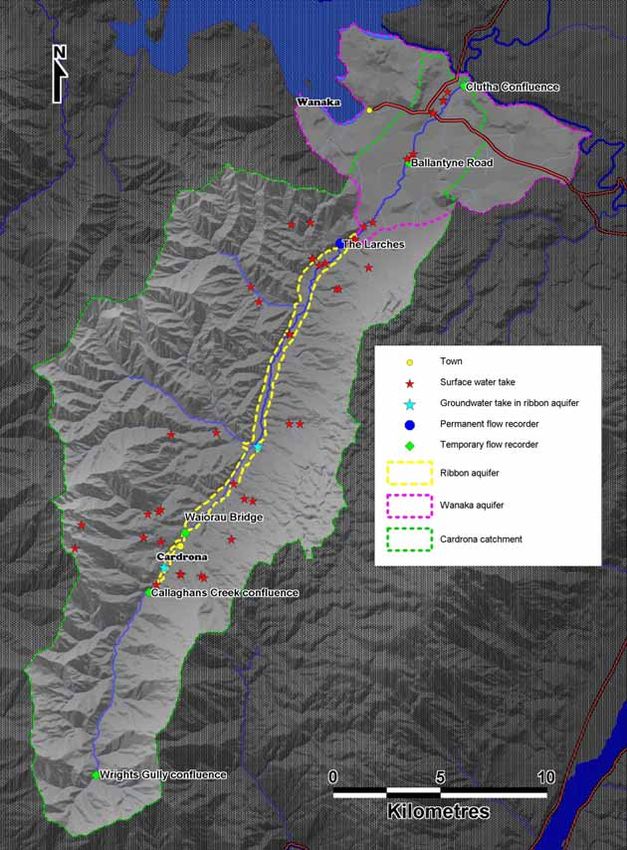
Figure 21: Location of surface water takes in the Cardrona catchment ................................. 39
Figure 22: Measured vs modelled groundwater level for the Envirowaste bore (F40/0014) as
part of transient calibration.................................................................................... 43
Figure 23: Variation of instream habitat in the Cardrona River for adult and juvenile trout . 48
Figure 24: Variation of instream habitat in the Cardrona River for brown and rainbow trout
spawning ................................................................................................................ 49
Figure 25: Variation of instream habitat in the Cardrona River for longfin eel, invertebrates
and koaro ............................................................................................................... 50
Figure 26: River flow alongside management flow options for juvenile trout and maintenance
of flow continuity in the Cardrona River .............................................................. 54
Figure 27: River flow, alongside management flow options for trout spawning ................... 55
Figure 28: Modelled recharge response for Soil Zone 8......................................................... 65
Figure 29: Modelled recharge response for Soil Zone 4......................................................... 65
Figure 30: Steady state model sensitivity to horizontal hydraulic conductivity ..................... 71
Figure 31: Steady state model sensitivity to Cardrona river bed conductance ....................... 72
Figure 32: Final calibration history matching (calibration) to Envirowaste bore record ....... 73
Table of Tables
Table 1: Annual and seasonal rainfall statistics for Wanaka AWS and Peat's Hut rainfall
recorders .................................................................................................................. 5
Table 2: Summary of annual statistics of the Cardrona River flow sites ............................ 15
Table 3: Summary of annual statistics in the Cardrona catchment flow sites ..................... 17
Table 4: Estimated Aquifer water balance for Wanaka-Cardrona Aquifer ......................... 30
Table 5: Level reduction statistics for modelled increases in abstraction ........................... 44
Table 6: Changes in modelled Wanaka-Cardrona Aquifer outflows for six scenarios of
varying abstraction ................................................................................................ 45
Table 7: Critical thresholds for instream habitat for fish in the lower Cardrona River ....... 49
Cardrona River Water Resource Management ReportIntegrated Water Resource Management for the Cardrona River ix
Table 8: Flows requirements for native fish and invertebrate habitat in the Cardrona River
based on IFIM analysis.......................................................................................... 51
Table 9. Suggested management flows for instream values in the Cardrona River ............ 53
Table 10: Soil properties used in the Rushton soil moisture balance model. Soil zones
represent an amalgamation to eight predominant types ........................................ 64
Table 11: Groundwater model zones and hydraulic conductivities ...................................... 68
Table 12: Steady state mass balance...................................................................................... 70
Cardrona River Water Resource Management ReportIntegrated Water Resource Management for the Cardrona River 1
1 Introduction
1.1 Background
The Cardrona River has a total catchment area of 337km2 and flows northwest through the
steep Cardrona Valley onto the Wanaka-Cardrona Flats before joining the Clutha River/Mata-
Au at Albertown. The catchment is divided from the Wakatipu Catchment by the Crown
Range, separated from adjoining Upper Clutha catchments of the Motutapu River by the
Cardrona Range, and from Luggate Creek by the Criffell Range.
The Wanaka-Cardrona Flats sit astride a sedimentary basin characterised by glacial deposits
and glacial outwash gravels. These deposits are defined in the Otago Groundwater Resource
Management Scheme as the Wanaka Basin-Cardrona Gravel Aquifer (abbreviated hereafter to
Wanaka-Cardrona Aquifer). This aquifer is responsible for the flow of Bullock Creek through
Wanaka Township, the availability of groundwater in the rural areas, and the periodic drying-
up of sections of the Cardrona River during summer.
In recent years, Wanaka Township and the Wanaka-Cardrona Flats have experienced
substantial growth in residential development and land values. In the 2006 census, the
population and the number of dwellings in the Wanaka area had almost doubled (93% and
88% increase, respectively) over the previous ten years1. Construction in the township on
medium to high density residential and accommodation buildings has spiked significantly in
the last five years. Several of these buildings have included underground car parks or utility
rooms that imposed dewatering requirements during construction and post-construction. On
the Wanaka-Cardrona Flats, rural residential construction, tourism facilities, crop
diversification and agricultural intensification have been trends in the last 15 years. Snow and
alpine tourism has also led to residential and hospitality development of the upper Cardrona
River. Pastoral agriculture in the Cardrona Valley is also in transition from extensive pastoral
systems to more intensive systems to increase production and surety of returns.
These developments have occurred against a backdrop of developing regional council water
management and allocation planning documents. The Regional Plan: Water (RPW) came into
operation in January 2004, bringing with it several groundwater policies. More recently, the
proposed Plan Change 1C introduced more specialised groundwater allocation measures and
surface water interaction provisions which are likely to come into operation in 2010. Otago
Regional Council (ORC) has also announced that the Cardrona River is on a schedule for
setting management flows to allow universal surface water allocation into primary and
supplementary volumes. To date, ORC has issued groundwater take consents of up to 3.5
million m3/y of groundwater for water supply and irrigation on the Wanaka -Cardrona Flats,
and a further 5 million m3/y for construction dewatering in Wanaka Township from the
Wanaka-Cardrona Aquifer resource. Setting the technical specifics to these water
management measures is the fundamental objective of this report.
1.2 Aims and objectives
This study is directed towards the following technical support objectives:
• identifying a management flow for the Cardrona River that caters for instream values.
1
Source: Statistics New Zealand (StatsNZ) 2006 Census Data
Cardrona River Water Resource Management Report2 Integrated Water Resource Management for the Cardrona River
• identifying the sustainable size of the aquifer’s water resource at a technical level
• supporting the future phases of consultation and decision making that are involved in
setting a groundwater allocation limit for the aquifer
• other aspects of groundwater management that can be addressed concurrently, such as
surface water interaction.
1.3 Previous studies
ORC has published two previous studies of the Cardrona catchment. The first study looked at
surface water quality and covered the Cardrona and Lindis rivers (ORC, 2006). The second
entailed a hydrological data review of the Cardrona and Bullock Creek catchments (ORC,
2007), and contained recommendations for intensified data gathering that were implemented
to provide the basis for this study.
Studies into the groundwater conditions of the Wanaka-Cardrona Aquifer began in 1976.
Thomson (1976) prepared an engineering geology report for the DSIR Geological Survey
after visiting the Wanaka hatchery and reviewing available information on the geology of the
Wanaka area. Subsequently, the Institute of Geological and Nuclear Science undertook a
wider investigation of the water quality and flow dynamics of the Wanaka-Cardrona Flats
(Rosen et al, 1997). ORC helped with this investigation, which included extensive water
chemistry characterisation and the use of environmental isotopes to illuminate flow dynamics,
such as groundwater source and residence time. ORC also surveyed bore heads and employed
three water level surveys to draw up water table contour maps covering the basin. To
consolidate the information obtained in the 1994 / 95 surveys, ORC undertook an analysis of
all available field data for what became known as the Wanaka-Cardrona Aquifer in 2000 and
2001 (ORC, 2001). This analysis incorporated the accumulated data and utilised a steady-state
computer model to develop a basin-wide water balance accounting for flows between surface
water and the aquifer.
Cardrona River Water Resource Management ReportIntegrated Water Resource Management for the Cardrona River 3 2 Setting 2.1 Location and topography The Cardrona River catchment consists of a steep river valley at an elevation of between 300m at the confluence with the Clutha/Mata-Au River and 1000m at the top of the Crown Range. Tussock and low producing grassland is prevalent in the higher catchment, while in the lower catchment, high producing exotic grassland predominates. Sheep and beef farming on tussock dominates the catchment, with the high producing grasslands in the lower catchment supporting some deer farming. The Wanaka-Cardrona Aquifer is set between Lake Wanaka, the Upper Clutha River/Mata- Au and the ranges to the south and west, namely Criffell Range and Mount Roy. The bedrock remnants termed roche moutonnees were formed during glaciation and represent gaps in the ice sheets, particularly at the confluence of two or more glaciers. Mount Iron and Mount Barker are recognised as prominent roche moutonnees, projecting above the surface of the glacial outwash gravels. The Mount Iron terminal moraine forms the backdrop to Wanaka Township and runs between Mount Iron and the western edge of the basin. Glacial outwash gravels and tills also form prominent terraces in the northwest and east of the aquifer area. Figure 1 shows the location of these features. 2.2 Climate and rainfall Cardrona catchment lies between two contrasting climate zones: the drier Mediterranean climate of the Upper Clutha River/Mata-Au (represented by Wanaka Airport Automatic Weather Station-Wanaka AWS) and the mountain climate, which is affected by the spill-over rain which crosses the Main Divide (represented by Peat’s Hut). Figure 1 shows the location of the flow and rainfall sites used in this study. Cardrona River Water Resource Management Report
4                                        Integrated Water Resource Management for the Cardrona River

                       Wanaka-Cardrona aquifer

Figure 1:     Catchment location, plus low flow and rainfall sites used in the Cardrona
              management flow study

The topography of the wider Wanaka area results in a number of climatic rain-shadow effects,
where areas in the lee of mountains display lower precipitation totals. Spill-over rain during
north-west airstream events that bring heavy rain to the West Coast on the far side of the Main
Divide extends heavier rainfall to the Wanaka Basin.

Catchment potential evapotranspiration between January and March ranges from 2.5mm to
3.7mm, and averages 3.4mm/d across most of the lower Cardrona catchment. The annual
mean daily evapo-transpiration in the wider catchment takes into account the cooler, wetter
months of the year and approximates 1.1mm/d for the period 1975-2005. Annual mean air
temperature for the lower Cardrona catchment is approximately 10.5⁰C. Approximately 13
megajoules per square metres per day (MJ/m2/d) of solar energy fall onto the surface of the
lower Cardrona catchment. The first frost on lowlands typically occurs in early April and the
latest frost typically occurs in early November.

Table 1 provides annual and seasonal summary rainfall statistics for the Wanaka AWS and
Peat’s Hut rainfall recorders. A “season”, which refers to the irrigation season, is defined as
being from October to April, inclusive.

                                                      Cardrona River Water Resource Management Report
Integrated Water Resource Management for the Cardrona River 5
Table 1: Annual and seasonal rainfall statistics for Wanaka AWS and Peat's Hut rainfall
recorders
Seasonal total rainfall statistics
Annual total rainfall statistics
(Oct-Apr)
Site Maximum Minimum Mean Maximum Minimum Mean
Wanaka Aero AWS 863 358 605 659 206 353
Shotover at Peat's Hut 1075 666 900 628 381 490
The higher totals experienced by the Peat’s Hut rainfall recorder are consistent with the
greater exposure to spillover from westerly rainfall events.
A severe rainfall deficit occurs in the lower Cardrona catchment during summer, with
January-April rainfall totals in the lower catchment generally ranging from 50 to 100mm
(Figure 2). Potential evapotranspiration during this period is considerably higher, however,
and ranges from 206 to 210mm (ORC, 2007). This summer moisture deficit leads to a high
demand for irrigation water.
100 Wanaka AWS Peat's Hut
Average monthly total rainfall (mm)
90
80
70
60
50
40
30
20
10
0
Oct Nov Dec Jan Feb Mar Apr May Jun Jul Aug Sep
Figure 2: Average monthly rainfall totals for Wanaka AWS and Peat's Hut
Figure 2 shows that the lowest periods of rainfall occur between February and April, with
some precipitation falling as snow between June and August.
Analysis of long-term annual and seasonal rainfall patterns has been undertaken for both
Wanaka AWS and Peat’s Hut rainfall recorders (Figure 3 and Figure 4).
Cardrona River Water Resource Management Report6 Integrated Water Resource Management for the Cardrona River
Wanaka AWS annual total
1000 Wanaka AWS seasonal rainfall total
900
800
Total rainfall (mm)
700
600
500
400
300
200
100
0
Figure 3: Long-term rainfall trends for Wanaka AWS
Figure 3 shows that there has been a slight downwards trend in seasonal rainfall at Wanaka
AWS since 1992; however, this trend is skewed by unusually high rainfall early in the term of
record. The 5-year moving average for seasonal rainfall has remained at approximately
350mm for the past decade, although there were some particularly dry irrigation seasons in
2005/06 and 2006/07.
Peat's Hut annual rainfall total
1200 Peat's Hut seasonal rainfall total
1000
Total rainfall (mm)
800
600
400
200
0
Figure 4: Long-term rainfall trends for Peat's Hut
Long-term trend analysis of rainfall is limited at Peat’s Hut, due to the relatively short period
of record; however, seasonal rainfall totals have been relatively stable over this time, at
Cardrona River Water Resource Management ReportIntegrated Water Resource Management for the Cardrona River 7
around 450mm. As expected, annual and seasonal rainfall totals are significantly higher than
that at Wanaka AWS (Figure 3).
2.3 Geology
The Wanaka Basin rests in the Haast Schist basement crustal unit. This regionally
metamorphosed marine sedimentary sequence is several kilometres thick and has been
subjected to profound and extremely rapid (by geological measures) deformation by folding
and faulting in mountain-building periods, particularly during the last two million years (Ma).
The Cardrona Valley coincides with the trace of the Cardrona-Nevis Fault system.
The flanks of the Cardrona Valley and floor of the Wanaka-Cardrona Flats are in-filled by
tertiary lake sediments of the Manuherikia group. The Manuherikia group is a composite set
of formations associated with lake, deltaic and river deposits dating from the Miocene
geological era. The original deposits covered most of the underlying Haast schist basement
rocks throughout the region, but have been subsequently disrupted and partially stripped away
by crustal movements of the last 2Ma. The composition of the Manuherikia group sediments
in the Wanaka Basin ranges from fine silty clay through silt to carbonaceous clay. A
stratigraphic drilling project in 1979, near Luggate, encountered an 87m thickness of
Manuherikia formation sediments; however, drilling was abandoned without hitting Haast
schist basement. A test bore of similar depth located immediately to the east of Mt Barker
penetrated 75m of silt and clay also without hitting basement. Manuherikia formation
sediments are considerably thinner and often absent on the western side of the Cardrona-
Nevis Fault (i.e. beneath Wanaka Township) that bisects the Wanaka Basin from the north-
east to the south-west.
A rough terrace sequence is preserved in parts of the Cardrona Valley flanks. The course of
the valley was initially formed in the presence of the Cardrona -Nevis Fault. The pre-history
of the valley includes the possibility that the proto-Cardrona River flowed south-west into the
Wakatipu catchment before reverting to its current pattern after the stabilisation of tectonics
and drainage patterns. A sequence of fragmentary deposits have been left behind, including
the Hawkdun group piedmont gravels, Early Quaternary deposits of the Lochar formation,
Late Quaternary outwash and modern Cardrona River alluvium. Figure 5 shows that more
than 80% of the Cardrona catchment consists of basement schist, coloured blue-grey; while
the remainder is shown as being of various shades of yellow, indicating that there are glacial
or alluvial deposits either side of the valley axis.
The Quaternary geology, in particular, the glacial processes and deposits of the last 2Ma, is
very complex in the Wanaka Basin. At least four glacial periods have resulted in the Wanaka
valley systems being filled with valley glaciers on separate occasions. In the aftermath of each
glacial event, glacier retreat and riverine outwash tend to dominate landforms, with glacial
deposits often having been re-worked and over-printed by the latest glacial event. The glacial
and post-glacial geology of the Wanaka Township area comprise the following features:
• glacial till deposits, comprising sands, silts, clays and melt-water fine gravels
• glacial moraine deposits, particularly the Mt Iron Terminal Moraine
• post-glacial lake shore deposits associated with Lake Wanaka
• post-glacial outwash gravels resting atop terminal moraine
Cardrona River Water Resource Management Report8 Integrated Water Resource Management for the Cardrona River
• younger alluvial deposits, associated with the Cardrona River flood plain
• melt-water deposits traversing the Wanaka-Cardrona Flats
• outwash gravels associated with the Clutha River/Mata-Au and Cardrona River also
forming surfaces on the Wanaka-Cardrona Flat
• erosional and modern flood deposits of the Cardrona River to either side of its current
course.
These features form a complex patchwork caused by the depositional environments and
sediment supply available at the time of deposition. Figure 6 illustrates the distribution of
principal geological formations in the Wanaka Basin.
Cardrona River Water Resource Management ReportIntegrated Water Resource Management for the Cardrona River 9
Figure 5: Cardrona Catchment geology from 1:250,000 scale Geological and Nuclear
Sciences QMap
Cardrona River Water Resource Management Report10 Integrated Water Resource Management for the Cardrona River
Figure 6: Outline geology of the Wanaka Basin
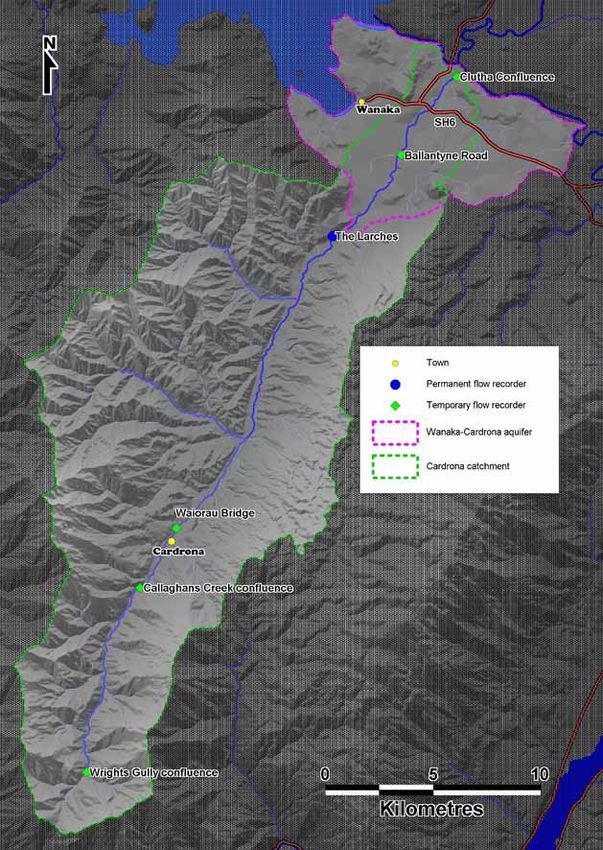
Cardrona River Water Resource Management ReportIntegrated Water Resource Management for the Cardrona River 11 2.4 Hydrology 2.4.1 Cardrona River: Summary Hydrological monitoring in the Cardrona catchment has consisted of a permanent flow recorder at The Larches (also known as “Mt Barker” flow recorder) and five temporary flow recorders, located at the Clutha River/Mata-Au confluence, Ballantyne Road, Waiorau Bridge, Callaghans Creek confluence and Wrights Gully confluence (Figure 7). The three upper flow recorders (Waiorau Bridge, Callaghans Creek confluence and Wrights Gully confluence) were installed as part of a water resource study of the upper Cardrona catchment, but were not used for the management flow study, which focused on the hydrology of the lower catchment. Cardrona River Water Resource Management Report
12                              Integrated Water Resource Management for the Cardrona River

Figure 7:   Flow recorders in the Cardrona catchment

                                             Cardrona River Water Resource Management Report
Integrated Water Resource Management for the Cardrona River 13 2.4.2 Surface water/groundwater interactions The Cardrona River can be separated into three main sections: a neutral reach (upstream of The Larches); a losing reach, in which surface water is lost to groundwater (between The Larches and SH6); and a gaining reach (downstream of SH6), in which surface flows are recharged from groundwater (Figure 8). Figure 8: Neutral, losing and gaining reaches of the Cardrona River Cardrona River Water Resource Management Report
14                                   Integrated Water Resource Management for the Cardrona River

A neutral reach occurs when the bed of the river is in equilibrium with the underlying ribbon
aquifer, with no net exchange of water. The ‘losing reach’ is classed as a ‘disconnected losing
reach’, and occurs when there is a continuous loss of surface flows to the groundwater,
regardless of changes in groundwater level (Figure 9). Reduction of surface flow in a
disconnected losing reach leads to a corresponding reduction in groundwater recharge.

Figure 9:      A disconnected loosing reach, where surface water and groundwater become
               decoupled and separated by an unsaturated zone (Winter et al, 1998)

An important feature of a disconnected losing reach is that continued pumping and subsequent
reduction of groundwater levels do not cause a corresponding increase in surface water losses.
Once groundwater and surface water become decoupled, the rate of surface flow loss is more
consistent, although changes in river height and wetted perimeter would result in changed loss
rate.

Flow monitoring undertaken during the winter months (in the absence of surface water
abstraction) indicates that the net loss to groundwater in the losing reach is approximately
0.7m³/s of surface flow. The loss is less over the summer because the size of the wetted
channel is reduced, both laterally and longitudinally.

Gaining reaches occur when the stream gains water from the surrounding aquifer, and
requires the aquifer to be higher in altitude than the surface of the stream channel (Figure 10).

Figure 10:     A gaining reach, where the stream gains water from a connected shallow aquifer
               (Winter et al, 1998)

                                                   Cardrona River Water Resource Management Report
Integrated Water Resource Management for the Cardrona River 15
When surface flows cease upstream of SH6, there is still a perennial base flow of
approximately 0.3m³/s in the Cardrona River at the Clutha River/Mata-Au confluence.
Groundwater/surface water interactions are discussed further in the Groundwater Flow Pattern
section (3.3).
2.4.3 Flow statistics
Information gathered from flow recorder sites at The Larches, Ballantyne Rd and the Clutha
River/Mata-Au confluence have been analysed to provide stream flow statistics within the
catchment (Table 2). Note that flow statistics for Ballantyne Rd and Clutha River/Mata-Au
confluence are based on less than two years of data and are heavily influenced by surface
water abstraction.
The Otago Catchment Board operated The Larches hydrological recorder site from 1976 to
1988; it then closed for several years before ORC re-opened it in February 2001. There are a
large number of gaps in the early Larches record, most of which occurred during summer.
These gaps comprise less than 1% of the record, however, and should therefore have only a
minor effect on summer low flow calculations.
Table 2: Summary of annual statistics of the Cardrona River flow sites
Term of Min Max
Catchment Mean flow
Site Name record recorded recorded
area (km²) (m³/s)
(years) flow (m³/s) flow (m³/s)
Cardrona at The Larches 293 22 0.308 145.299 3.137
Cardrona at Ballantyne Road 307 2 0 24.366 1.868
Cardrona at Clutha confluence 347 2 0.297 22.024 1.747
The Cardrona River downstream of The Larches is subject to losses due to groundwater
recharge and abstractions for irrigation, and in most years, the Cardrona dries up along parts
of its lower reach during summer. As of June 2006, 52% of the volume of the consented
irrigation takes in the Cardrona catchment was below The Larches (1.44m3/s). There was
some recovery of flow by the time the river reached the Clutha River/Mata-Au confluence, as
groundwater and excess irrigation water re-entered the river. Table 2 shows that the Clutha
confluence recorder, which has been operating since 2008, did not record any periods of zero
flow during this period.
Figure 11 shows surface flows during the 2009-10 irrigation season (October-April, inclusive)
at The Larches, Ballantyne Road and the Clutha confluence flow recorders.
Cardrona River Water Resource Management Report16 Integrated Water Resource Management for the Cardrona River
6
5.5 Cardrona at The Larches
Cardrona at Ballantyne Road
5
Cardrona at Clutha Confluence
4.5
4
Flow (m³/s)
3.5
3
2.5
2
1.5
1
0.5
0
1‐Oct‐09 1‐Nov‐09 1‐Dec‐09 1‐Jan‐10 1‐Feb‐10 1‐Mar‐10 1‐Apr‐10
Figure 11: Surface flows in the lower Cardrona River during the 2009-10 irrigation season
The flow differential between The Larches and Ballantyne Road reveals that there is a
significant loss of surface flows between these sites, due to abstraction and losses to
groundwater. The steady base flow observed at the Clutha confluence is due to inflows from
the Wanaka-Cardrona Aquifer downstream of State Highway 6.
2.4.4 Annual 7-day low flows and their frequency analyses
Mean annual 7-day low flows2 (MALF), and the corresponding specific catchment yield at
MALF3 (SMALF) at the three flow recorder sites in the lower Cardrona catchment, are given
in Table 3. The 7-day low flow in any year is the lowest average flow over a consecutive 7-
day period. After this has been calculated for every year of record, the MALF is determined
by adding the lowest 7-day low flows for every year of record and dividing by the number of
years in the record.
The Larches flow recorder is prone to freezing during winter, giving false low flow readings
and negatively skewing MALF and low flow return periods. To correct this, MALF and low
flow return periods have also been calculated using data from October to April (inclusive).
This data is also more applicable when considering management flows as it focuses on the
period where demand for water resources is greatest.
2
The mean of the lowest 7-day average flow for each hydrological year of record
3
Specific discharge from 1km² of catchment area at MALF
Cardrona River Water Resource Management ReportIntegrated Water Resource Management for the Cardrona River 17
Table 3: Summary of annual statistics in the Cardrona catchment flow sites
Term of Catchment MALF SMALF
Site
record area (km²) (m³/s) (l/s/km²)
Cardrona at The Larches 22 293 1.02 3.609
Cardrona at Ballantyne Road 2 307 0 0.000
Cardrona at Clutha confluence 2 347 0.331 0.954
Figure 12 compares the 7-day low flow and minimum recorded flows over the whole term of
record for The Larches flow recorder.
3.00
7‐day low flow
2.50 Min recorded flow
7‐day MALF
2.00
1.50
1.00
0.50
0.00
Figure 12: Comparison of annual 7-day low flows at The Larches flow recorder
As seen in Figure 9, there has been a significant reduction in low flows since the 2005/06
irrigation season. To investigate whether the reduction is due to lower rainfall over this
period, or to other factors such as changes in land use or irrigation practice, a comparison has
been made between 7-day low flows and rainfall totals at Wanaka airport AWS and Peat’s
Hut rainfall recorders (Figure 13 and Figure 14).
Cardrona River Water Resource Management Report18 Integrated Water Resource Management for the Cardrona River
Wanaka AWS (rainfall)
The Larches 7‐day low flow
Wanaka at AWS polynomial trendline
450 The Larches polynomial trendline 1.60
400 1.40
Seasonal rainfall total (mm)
350 1.20
7‐day low flow (m³/s)
300
1.00
250
0.80
200
0.60
150
100 0.40
50 0.20
0 0.00
Figure 13: Comparison of flow and rainfall trends between The Larches flow recorder and
Wanaka AWS rainfall site
Figure 13 shows that there has been a noticeable divergence between 7-day low flows at The
Larches and seasonal rainfall totals at Wanaka AWS over the period in which the two data
sets overlap.
Shotover at Peats Hut (rainfall)
The Larches 7‐day low flow
Shotover at Peats Hut polynomial trendline
700 1.60
7‐day low flow polynomial trendline
600 1.40
Seasonal rainfall total (mm)
1.20
7‐day low flow (m³/s)
500
1.00
400
0.80
300
0.60
200
0.40
100 0.20
0 0.00
Figure 14: Comparison of flow and rainfall trends between The Larches flow recorder and
Peat's Hut rainfall site
Cardrona River Water Resource Management ReportIntegrated Water Resource Management for the Cardrona River 19 Figure 14 shows that while rainfall at Peat’s Hut has increased slightly since 2000/01, 7-day low flows have exhibited a noticeable downward trend during the same period. Several factors may contribute to base flow reductions in the Cardrona River. In the past 5-8 years, many irrigators have switched from flood to spray irrigation (I. Anderson & T Scurr, pers comm.). Although spray irrigation is a more efficient application technique, allowing more land to be irrigated using the same volume of water, this increased efficiency leads to a decrease in irrigation by-wash entering the river. Another factor that contribute to declining base flows is the reduction in tussock cover, due to invasion of the pest plant, Hieracium pilosella (hawkweed). Snow tussock is well known for its ability to intercept and retain water (Mark & Rowley, 1976), contributing significantly, therefore, to catchment yields at low flows. Conversely, Hieracium is a flatweed that increases runoff and reduces water retention. Changes in vegetation cover, including the replacement of snow tussock by Hieracium, have the potential to reduce base flows in the Cardrona catchment; however, the magnitude of this effect is unclear at this stage. 2.5 Water quality 2.5.1 Surface water quality The water quality of the Upper Clutha River/Mata-Au is generally extremely good. Nutrient and microbiological parameters measured in the area’s water show little indication of being compromised by human activity (ORC, 2006). The principal potential area for water quality degradation is that of the Cardrona Valley, where tourism and residential discharges are increasing due to the growth in population. 2.5.2 Groundwater quality Groundwater quality in the Wanaka Basin is relatively good. Any detrimental water quality results have arisen from the presence of faecal coliforms or iron in excess of the drinking water standard of
20                                   Integrated Water Resource Management for the Cardrona River

3      Groundwater hydrology
3.1    Basin margins

Margins of a groundwater system are commonly termed ‘boundaries’. In the case of the
Wanaka-Cardrona Aquifer, the margins are clearly defined at the Manuherikia formation or
schist rock geological contacts. The Quaternary age gravels forming the aquifer overlie or lap
onto the edges of these formations. Figure 6 shows the geological contacts of the older
Quaternary gravels that comprise the Wanaka-Cardrona Aquifer: specifically, the Haast Schist
basement, Pliocene sediments and hydrologic margins, which are principally found along
Lake Wanaka and the Clutha River/Mata-Au. The schist rock roche moutonnees of Mount
Iron and Mount Barker also protrude through the Quaternary outwash gravels and thus create
impermeable plugs of rock in the aquifer.

3.2    Aquifer properties

The properties or parameters of permeability (or strictly speaking, hydraulic conductivity),
transmissivity and storativity are those primarily considered in groundwater hydrology. The
internal properties of the Wanaka-Cardrona Aquifer have been measured in a few instances by
aquifer testing. In the south-west corner of the aquifer, there would appear to be two distinct
outwash deposits with distinct aquifer properties. Thomson (2002) observed younger
alluvium of moderate permeability and older alluvium of low permeability in drilling at the
narrowing of the Cardrona Valley. The distinction was largely based on the silt/ clay matrix,
which was higher in the older alluvium due to greater weathering. Thomson (2002) found that
test flow rates during the drilling of pilot holes declined as the drill bit passed from the
younger alluvium into the older alluvium. Aquifer testing of the younger alluvium, in bore
F40/0335 on the opposite bank of the Cardrona River near Mt Barker, derived a
transmissivity of 1200 square metres per day (m2/d). ORC holds data for only ten aquifer tests
undertaken in the Wanaka Basin-Cardrona Gravel Aquifer. Only a handful of the available
aquifer tests provide values for transmissivity. The transmissivity values derived in
interpreted aquifer tests ranged from 25m2/d to 1,220m2/d. However, other aquifer tests for
which transmissivity could not be quantitatively derived still point to high transmissivity,
probably in the thousands of m2/d.

Over a hundred specific capacity tests have been conducted at the conclusion of drilling bores
in the aquifer. While specific capacity test results are subject to a wide range of potential
interferences and inaccuracies, they are a general guide as to the permeability of the aquifer in
the direct vicinity of the bore screen. Plotting the hundred or so specific capacity test results
on the map of the aquifer reveals that very high values of specific capacity, say values in the
thousands of cubic metres per day per metre of drawdown (m3/d/m), lie in close proximity to
low results of only tens of m3/d/m. While such variability makes generalisation as to the
aquifer properties more difficult, it is to be expected in a heterogeneous aquifer such as
outwash gravels mixed with melt-water deposits and glacial till.

Bulk aquifer permeability was estimated from the results of specific capacity test available in
2001 (ORC, 2001). Zoning of the aquifer was undertaken in this manner with the lower end of
the permeability range at 10 metres per day (m/d) and the upper end at 70m/d. The median
permeability was inferred to lie at approximately 35m/d.

                                                   Cardrona River Water Resource Management Report
You can also read