Insights into the single-particle composition, size, mixing state, and aspect ratio of freshly emitted mineral dust from field measurements in the ...
←
→
Page content transcription
If your browser does not render page correctly, please read the page content below

Research article
Atmos. Chem. Phys., 23, 3861–3885, 2023
https://doi.org/10.5194/acp-23-3861-2023
© Author(s) 2023. This work is distributed under
the Creative Commons Attribution 4.0 License.

             Insights into the single-particle composition, size,
              mixing state, and aspect ratio of freshly emitted
                mineral dust from field measurements in the
                Moroccan Sahara using electron microscopy
                 Agnesh Panta1 , Konrad Kandler1 , Andres Alastuey2 , Cristina González-Flórez3 ,
       Adolfo González-Romero2,3 , Martina Klose4 , Xavier Querol2 , Cristina Reche2 , Jesús Yus-Díez2,5,a , and
                                         Carlos Pérez García-Pando3,6
                              1 Atmospheric     Aerosol Group, Institute of Applied Geosciences,
                                     Technical University of Darmstadt, Darmstadt, Germany
           2 Institute of Environmental Assessment and Water Research (IDAEA-CSIC), 08034, Barcelona, Spain
                                  3 Barcelona Supercomputing Center, 08034 Barcelona, Spain
              4 Department Troposphere Research, Institute of Meteorology and Climate Research (IMK-TRO),

                                  Karlsruhe Institute of Technology (KIT), Karlsruhe, Germany
                       5 Grup de Meteorologia, Departament de Física Aplicada, Universitat de Barcelona,

                                         C/Martí i Franquès, 1, 08028, Barcelona, Spain
                   6 ICREA, Catalan Institution for Research and Advanced Studies, 08010 Barcelona, Spain
                             a now at: Center for Atmospheric Research, University of Nova Gorica,

                                            Vipavska 11c, 5270 Ajdovščina, Slovenia
                              Correspondence: Agnesh Panta (agnesh@geo.tu-darmstadt.de)

                               Received: 28 October 2022 – Discussion started: 7 November 2022
                         Revised: 13 March 2023 – Accepted: 13 March 2023 – Published: 31 March 2023

      Abstract. The chemical and morphological properties of mineral dust aerosols emitted by wind erosion from
      arid and semi-arid regions influence climate, ocean, and land ecosystems; air quality; and multiple socio-
      economic sectors. However, there is an incomplete understanding of the emitted dust particle size distribution
      (PSD) in terms of its constituent minerals that typically result from the fragmentation of soil aggregates during
      wind erosion. The emitted dust PSD affects the duration of particle transport and thus each mineral’s global
      distribution, along with its specific effect upon climate. This lack of understanding is largely due to the scarcity
      of relevant in situ measurements in dust sources. To advance our understanding of the physicochemical proper-
      ties of the emitted dust PSD, we present insights into the elemental composition and morphology of individual
      dust particles collected during the FRontiers in dust minerAloGical coMposition and its Effects upoN climaTe
      (FRAGMENT) field campaign in the Moroccan Sahara in September 2019. We analyzed more than 300 000
      freshly emitted individual particles by performing offline analysis in the laboratory using scanning electron mi-
      croscopy (SEM) coupled with energy-dispersive X-ray spectrometry (EDX). Eight major particle-type classes
      were identified with clay minerals making up the majority of the analyzed particles both by number and mass,
      followed by quartz, whereas carbonates and feldspar contributed to a lesser extent. We provide an exhaustive
      analysis of the PSD and potential mixing state of different particle types, focusing largely on iron-rich (Fe oxide-
      hydroxides) and feldspar particles, which are key to the effects of dust upon radiation and clouds, respectively.
      Nearly pure or externally mixed Fe oxide-hydroxides are present mostly in diameters smaller than 2 µm, with
      the highest fraction below 1 µm at about 3.75 % abundance by mass. Fe oxide-hydroxides tend to be increas-
      ingly internally mixed with other minerals, especially clays, as particle size increases; i.e., the volume fraction
      of Fe oxide-hydroxides in aggregates decreases with particle size. Pure (externally mixed) feldspar represented

Published by Copernicus Publications on behalf of the European Geosciences Union.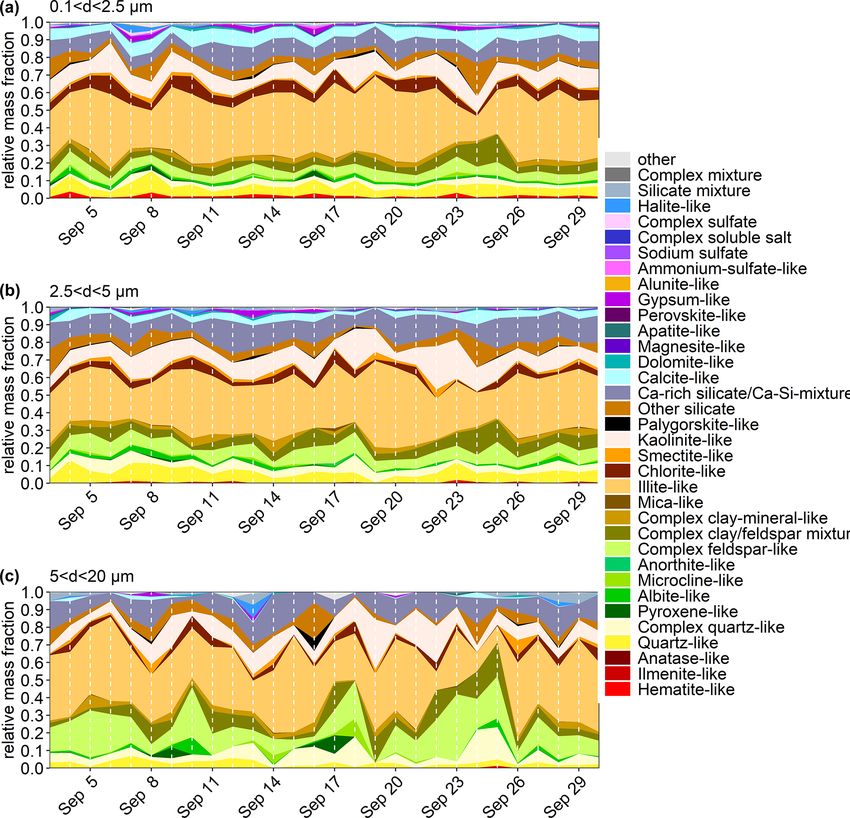
3862                                                                  A. Panta et al.: Single-particle analysis of Saharan dust

       3.2 % of all the particles by mass, of which we estimated about a 10th to be K-feldspar. The externally mixed
       total feldspar and K-feldspar abundances are relatively invariant with particle size, in contrast to the increasing
       abundance of feldspar-like (internally mixed) aggregates with particle size with mass fractions ranging from 5 %
       to 18 %. We also found that overall the median aspect ratio is rather constant across particle size and mineral
       groups, although we obtain slightly higher aspect ratios for internally mixed particles. The detailed information
       on the composition of freshly emitted individual dust particles and quantitative analysis of their mixing state
       presented here can be used to constrain climate models including mineral species in their representation of the
       dust cycle.

1   Introduction                                                       The physicochemical properties of mineral dust aerosols,
                                                                    including their particle size distribution (PSD), composition,
Mineral dust, as one of the most important natural aerosols         mixing state, and shape determine their impact on climate
in the atmosphere, is a key player in influencing the global        and atmospheric chemistry (Formenti et al., 2011). The emit-
climate system (Shao et al., 2011). It is the most abundant         ted PSD, spanning from a few nanometers to hundreds of
aerosol type in terms of mass (Choobari et al., 2014; Textor        micrometers, is critical in constraining the dust atmospheric
et al., 2006), with an estimated emission flux between 3400         lifetime, as coarser particles tend to deposit faster due to
and 8900 Tg yr−1 for particles smaller than 20 µm geometric         gravity, albeit less than previously thought (van der Does
diameter (Kok et al., 2021b). In particular, northern Africa is     et al., 2018; Adebiyi and Kok, 2020; Adebiyi et al., 2023).
responsible for an estimated 50 % of global windblown min-          The chemical and mineralogical composition is another key
eral dust emissions (Engelstaedter et al., 2006; Kok et al.,        factor to consider; for example, the absorption properties and
2021a). Dust directly affects the Earth’s radiative budget via      ice nucleation ability of dust depend upon its mineralogy,
scattering and absorption of radiation (Sokolik et al., 2001;       mainly upon the presence of iron oxides (Li et al., 2021)
Pérez et al., 2006; Strong et al., 2018) and indirectly by influ-   and K-feldspar (Atkinson et al., 2013; Kiselev et al., 2017;
encing cloud development on a microphysical level by acting         Welti et al., 2019; Yun et al., 2020), respectively. The mix-
as cloud condensation nuclei and ice nuclei (Zimmermann             ing or aggregation state of the different dust minerals is also
et al., 2008; Kumar et al., 2011; Hoose and Möhler, 2012;           important in determining the behavior of dust in the atmo-
Froyd et al., 2022), and thus it impacts cloud optical proper-      sphere in terms of its reactivity, chemical processing, op-
ties and radiation. Once uplifted over the source areas, dust       tical properties, ice nucleation ability, and dust deposition
can travel thousands of kilometers away from these areas            (Fitzgerald et al., 2015; Kandler et al., 2018). For example,
and can act as a carrier for micronutrients, such as iron and       dust is more optically absorbing when iron oxides are inter-
phosphorous, to the ocean (Jickells et al., 2005; Schulz et al.,    nally mixed with other minerals than when they are exter-
2012; Rodríguez et al., 2021; Myriokefalitakis et al., 2022)        nally mixed (Sokolik and Toon, 1999). The feldspar fraction
and the Amazon rainforest (Yu et al., 2015), with implica-          in desert soils also varies considerably. In parts of northern
tions for biogeochemical cycles and ocean uptake of atmo-           Africa (southern Algeria, northern Mauritania, and northern
spheric carbon dioxide by promoting phytoplankton growth            Niger) it can reach ∼ 12 % to 20 %, whereas in the western
(Mahowald et al., 2009). Additionally, dust can be deposited        Sahel the feldspar fraction is less than 2 % (Nickovic et al.,
on snow or ice, thereby reducing snow and ice reflectance           2012; Perlwitz et al., 2015a). In addition, the ice nucleation
(surface darkening) and consequently changing the climate           property of mineral dust depends not only on the source com-
and water cycle by accelerating snow melting (Painter et al.,       position but also on the feldspar PSD, which among other as-
2010; Sarangi et al., 2020). Dust can also interact with air        pects, dictates its lifetime in the atmosphere. Moreover, the
pollutants by acting as a catalyst and providing a surface for      ice-nucleating properties of K-feldspar vary significantly de-
heterogeneous reactions (Cwiertny et al., 2008; Ndour et al.,       spite having a comparable crystal structure and composition,
2008). Finally, dust might negatively impact human health           leading to a variety of ice nucleation abilities (Harrison et al.,
(Querol et al., 2019; Pérez García-Pando et al., 2014; Gian-        2016). K-feldspar also dominates the number of ice nuclei in
nadaki et al., 2014), induce a decrease in solar energy yield       both the internally mixed and externally mixed cases (Atkin-
by dust deposition to solar panels (Piedra and Moosmüller,          son et al., 2013). Particle shape influences the dust single-
2017), and negatively impact aircraft operations due to re-         scattering properties (Lindqvist et al., 2014; Nousiainen and
duced visibility (Middleton, 2017; Monteiro et al., 2022).          Kandler, 2015; Saito and Yang, 2021). Accurate quantifica-
Most of these processes rely not only on the total mass of dust     tion of dust shape is important for calculating the dust im-
but also on its microphysical properties and mineral compo-         pact on radiative forcing (Ito et al., 2021) and the terminal
sition (Mahowald et al., 2014).                                     velocity of dust particles (Ginoux, 2003; Huang et al., 2020),
                                                                    albeit with high uncertainties for both of these effects (Nou-

Atmos. Chem. Phys., 23, 3861–3885, 2023                                               https://doi.org/10.5194/acp-23-3861-2023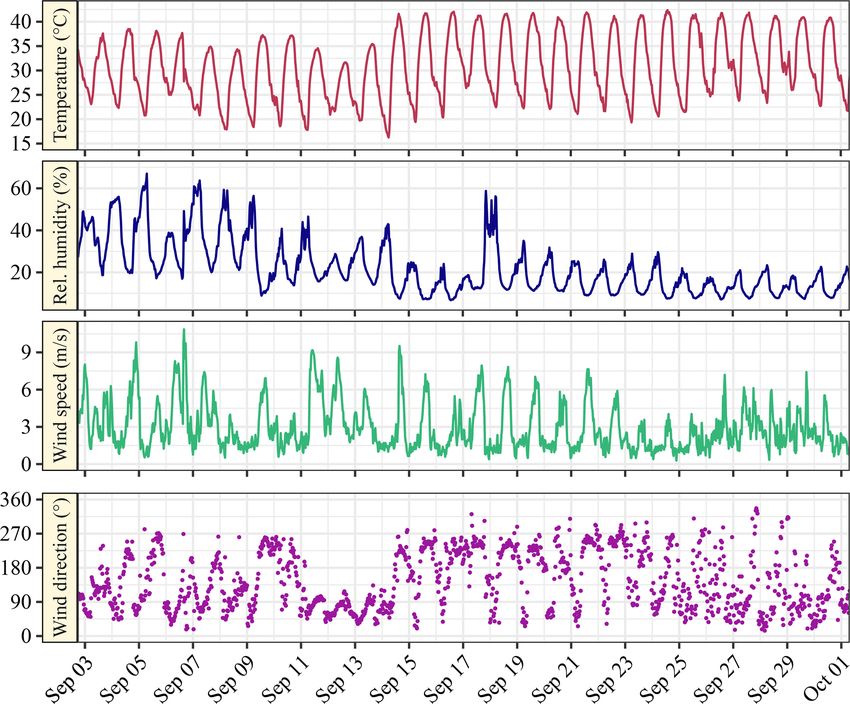
A. Panta et al.: Single-particle analysis of Saharan dust                                                                     3863

siainen et al., 2011). Mineral dust also contributes signifi-      their importance, very few ground-based, in situ measure-
cantly to the atmospheric aerosol mass loadings, which are         ment studies to characterize the particle composition and mi-
retrieved from satellite measurements and ground-based lidar       crophysical properties exist. This is mainly due to the diffi-
measurements applying algorithms that use particle shape as        culty in dust sampling at source areas, as source areas are
one of the input parameters (Dubovik et al., 2006; Gliß et al.,    often remote harsh environments. Also, frequent dust storms
2021). The importance of realistic size equivalence and shape      result in high particulate concentrations and filter overload,
of spheroidal Saharan dust particles on optical properties and     which pose a challenge when these samples are analyzed by
the radiative effect was studied in Otto et al. (2011) with data   automated SEM.
gathered during SAMUM-1 in Morocco. Furthermore, scan-                In this contribution, we investigate the size, morphology,
ning electron microscopy (SEM) was used to characterize the        elemental (and mineralogical) composition, and mixing state
mineralogical composition and shape of mineral dust parti-         of freshly emitted individual dust particles based on samples
cles collected during the SAMUM campaign over Morocco              collected during a major wind erosion and dust emission field
in 2006 (Lindqvist et al., 2014). They found great variation       campaign in the Moroccan Sahara within the framework of
between the scattering properties of spheres, spheroids, and       the FRontiers in dust minerAloGical coMposition and its Ef-
mineral dust particles characterized by SEM (Lindqvist et al.,     fects upoN climate (FRAGMENT) project. Three different
2014). Moreover, for non-symmetrical particles, a preferen-        instruments were used to sample mineral dust for the mea-
tial orientation in the atmosphere is observed where a shape-      surement of chemical and physical properties of individual
dependent settling behavior comes into effect (Li and Osada,       dust particles by SEM coupled with an energy-dispersive X-
2007). There is also a shape-dependent separation of mineral       ray analyzer (EDX). Our detailed chemical and physical spe-
dust into layers of different altitudes during cross-Atlantic      ciation represent a first step towards advancing our knowl-
transport of Saharan dust, which strongly points to a shape-       edge of the emitted PSD of individual dust minerals, and
preferential settling of particles (Yang et al., 2013). In addi-   this will ultimately help in understanding the relationship be-
tion, dust nonsphericity could enhance the snow albedo re-         tween the size-resolved composition of the emitted dust and
duction by up to 20 % relative to spherical dust (Shi et al.,      that of the parent soil. Such knowledge is needed to better
2022). As the shape of dust particles is highly aspherical         constrain climate models that consider mineralogical varia-
(Huang et al., 2020), this can further influence their optical     tions in their representation of the dust cycle (Perlwitz et al.,
properties (Ito et al., 2021; Otto et al., 2009; Mishchenko        2015a; Scanza et al., 2015; Li et al., 2021). This is timely
et al., 1997; Nousiainen and Kandler, 2015; Klose et al.,          given the prospect of global soil mineralogy retrievals using
2021). Finally, the dust lifetime in the atmosphere is also        high-quality spaceborne hyperspectral measurements (Green
affected by particle shape and density (which depends on           et al., 2020).
mineralogy), with more spherical and denser particles be-
ing deposited more quickly (Huang et al., 2020; Mallios
                                                                   2     Materials and methods
et al., 2020). Other potentially important aspects that have
been largely unexplored are the potential interdependencies        2.1    Measurement site
among particle size, composition, mixing state, and shape.
For example, while it is well known that composition is size       In situ aerosol sampling was conducted in a small study area
dependent (Kandler et al., 2009, 2011; Ryder et al., 2018; Liu     in southeastern Morocco during the FRAGMENT wind ero-
et al., 2018), very little is known about the potential depen-     sion and dust emission field campaign between 3 Septem-
dencies of shape and mixing state upon both particle compo-        ber and 1 October 2019. A suite of meteorological and
sition and size.                                                   aerosol instruments was deployed as depicted in Fig. 1 to
   Models that include spatiotemporal variations in miner-         measure key meteorological and aerosol quantities. Below
alogical composition of windblown dust are relatively new          we describe only the instruments and measurements used in
(Perlwitz et al., 2015a, b; Scanza et al., 2015) and currently     this contribution. Measurements performed during the cam-
use rather crude soil mineralogy maps (Claquin et al., 1999;       paign with other instruments displayed in Fig. 1b are dis-
Nickovic et al., 2012; Journet et al., 2014) as a lower bound-     cussed in companion papers (González-Flórez et al., 2022;
ary condition. Soil mineralogy maps are based on massive           Yus-Díez et al., 2023). The study area, locally known as
extrapolation from a limited amount of soil mineralogical          L’Bour (29◦ 490 3000 N, 5◦ 520 2500 W ≈ 500 m a.s.l.), is a small
analyses, ancillary information on soil texture and color, and     ephemeral lake located in the lower Drâa valley of Morocco
several additional assumptions. This limited knowledge, to-        and lies at the edge of the Sahara approximately 15 km to the
gether with our incomplete understanding and the scarcity of       west of the small village of M’Hamid El Ghizlane. The re-
measurements of the emitted dust physicochemical proper-           gion is characterized by high aerosol optical depth (Ginoux
ties and their relationship with the PSD and composition of        et al., 2012). The location was chosen primarily based on its
the parent soil, precludes accurate model assessment of the        dust emission potential and logistical feasibility. L’Bour is
effects of dust upon climate (Perlwitz et al., 2015a; Pérez        approximately flat and devoid of vegetation or other obsta-
García-Pando et al., 2016; Li et al., 2021). However, despite      cles within a radius of ∼ 1 km and is surrounded by small

https://doi.org/10.5194/acp-23-3861-2023                                           Atmos. Chem. Phys., 23, 3861–3885, 2023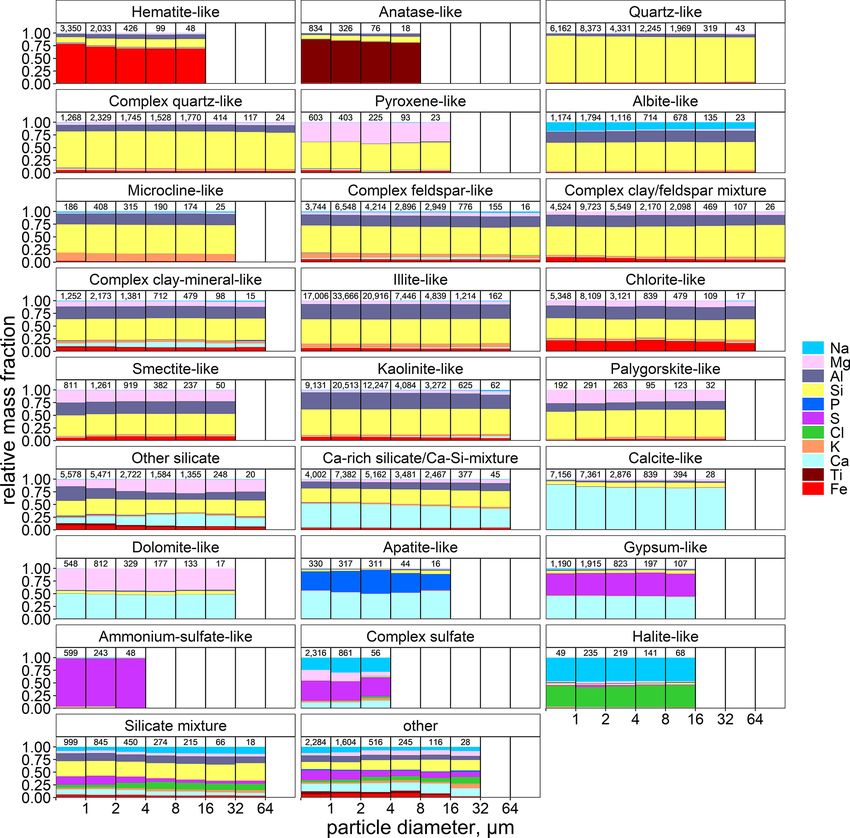
3864                                                                A. Panta et al.: Single-particle analysis of Saharan dust

sand dune fields. The surface consists of a smooth hard           2.2.2    Flat-plate sampler (FPS)
crust (paved sediment) mostly resulting from drying and eo-
                                                                  The flat-plate sampler used in this work is based on the orig-
lian erosion of paleo-sediments, as analyzed in detail in a
                                                                  inal flat-plate sampler used in Ott and Peters (2008). It con-
companion paper (González-Romero et al., 2023). Under fa-
                                                                  sists of two round brass plates (top-plate diameter of 203 mm,
vorable weather conditions, dust is frequently emitted from
                                                                  bottom-plate diameter of 127 mm, thickness of 1 mm each)
this source area (González-Flórez et al., 2022). PSDs of the
                                                                  mounted with a distance of 16 mm separating them. The
paved sediment were analyzed using dry dispersion (mini-
                                                                  plates protect the substrate from precipitation and reduce the
mally dispersed) and wet dispersion (fully dispersed) tech-
                                                                  effects of wind speed by reducing the smallest turbulence via
niques and displayed two prominent modes at ∼ 100 and
                                                                  the distance between the parallel plates. In this setup, larger
∼ 10 µm (González-Romero et al., 2023). According to the
                                                                  particles (> 1 mm) cannot enter the sampling stub surface at
fully dispersed PSD, the texture of the surface paved sedi-
                                                                  low wind speed (Ott and Peters, 2008). The main controls
ment is loam (Valentin and Bresson, 1992).
                                                                  for particle deposition on the substrate are diffusion, gravity
                                                                  settling, and turbulent inertial forces.
2.2     Sampling techniques
Particles were collected near ground level (∼ 1.5 m) us-          2.2.3    Cascade impactor (MOUDI)
ing three different sampling techniques, namely using a
                                                                  Sampling was conducted using a five-stage micro-orifice uni-
flat-plate sampler (FPS), a free-wing impactor (FWI), and
                                                                  form deposit impactor (MOUDI, MSP Corp., MN, USA)
a micro-orifice uniform deposit impactor (MOUDI, MSP
                                                                  with a 100 L min−1 flow rate. The impactor has stages avail-
Corp. Model 110), all of which are briefly described in
                                                                  able with a 50 % cut-point aerodynamic diameter (Da ) of
the section below. A detailed description and methodology
                                                                  10, 2.5, 1.0, and 0.25 µm. Particles were collected on 25 mm
of sampling techniques have both been provided in previ-
                                                                  sticky carbon substrates attached to the 75 mm impaction
ous publications (Kandler et al., 2018; Waza et al., 2019).
                                                                  plate using a double-sided adhesive. The sampling time
All aerosol samples were collected on pure carbon adhesive
                                                                  was chosen to provide optimum particle loading for single-
substrates (Spectro Tabs, Plano GmbH, Wetzlar, Germany)
                                                                  particle analysis, which was usually limited to a few minutes.
mounted on standard SEM aluminum stubs. Pure carbon sub-
                                                                  The short sampling time resulted in fewer particle collections
strate was chosen because of its excellent smooth surface re-
                                                                  in the first two stages, and therefore only the third and fourth
sulting in a clear image-analytical separation of particles and
                                                                  stages were selected for detailed analysis.
background (Ebert et al., 1997). All adhesive samples were
                                                                     Particle bounce can be an issue with an inertial impactor
stored in standard SEM storage boxes (Ted Pella Inc., Red-
                                                                  such as the MOUDI and occurs when particles impact on
ding, CA, USA) in dry conditions at room temperature. Sub-
                                                                  the collection substrate but are not retained. Studies have
strates in the MOUDI and FWI were collected twice daily
                                                                  shown that particle bounce reduces at the relative humidity
with a typical sampling duration of a few minutes to avoid
                                                                  of > 70 % depending on the mineralogical properties of par-
overloading the substrate for individual particle analysis. For
                                                                  ticles (Bateman et al., 2014; Fang et al., 1991; Vasiliou et al.,
the flat-plate sampler, the average exposure time was half a
                                                                  1999). During the measurement campaign, the relative hu-
day.
                                                                  midity was usually below 60 % with a maximum of 71 %
                                                                  (see Fig. A1). Therefore, particle bounce can occur, which
2.2.1    Free-wing impactor (FWI)                                 could lead to biases in the particles collected. Additionally,
A free-rotating wing impactor (Kandler et al., 2009, 2018;        the shattering and asphericity of dust particles can further in-
Waza et al., 2019) was used to collect particles larger than      duce bias in collected particles.
∼ 3 µm (projected diameter). The FWI has a sticky carbon
substrate as an impaction surface and is attached to a rotating   2.3     Scanning electron microscopy (SEM)
arm that moves through the air; particles deposit on the mov-
                                                                  Size, morphology, and elemental composition of a large
ing plate due to their inertia. The rotating arm is moved at a
                                                                  number of individual particles were investigated by SEM
constant speed by a stepper motor, which is fixed on a wind
                                                                  as has been done in previous studies (Kandler et al., 2007;
vane, aligning the FWI to the wind direction. The substrate
                                                                  Chou et al., 2008; Engelbrecht et al., 2009b; Jish Prakash
itself is oriented perpendicular to the air stream vector (re-
                                                                  et al., 2016; Engelbrecht et al., 2017; Ryder et al., 2018; Kan-
sulting from wind and rotation speeds) by a small wind vane
                                                                  dler et al., 2020). About 64 000 (FWI), 100 000 (FPS), and
attached to the rotating arm. The particle size cutoff is de-
                                                                  176 000 (MOUDI) individual particles were analyzed with a
termined by the impaction parameter, i.e., by rotation speed,
                                                                  scanning electron microscope (FEI ESEM Quanta 400 FEG
wind speed, and sample substrate geometry.
                                                                  instrument, Eindhoven, The Netherlands) equipped with an
                                                                  X-Max 150 energy-dispersive X-ray spectroscopy (EDX) sil-
                                                                  icon drift X-ray detector (Oxford, Oxfordshire, UK) con-
                                                                  trolled by AZtec 4.4 Oxford software. The AZtecFeature

Atmos. Chem. Phys., 23, 3861–3885, 2023                                             https://doi.org/10.5194/acp-23-3861-2023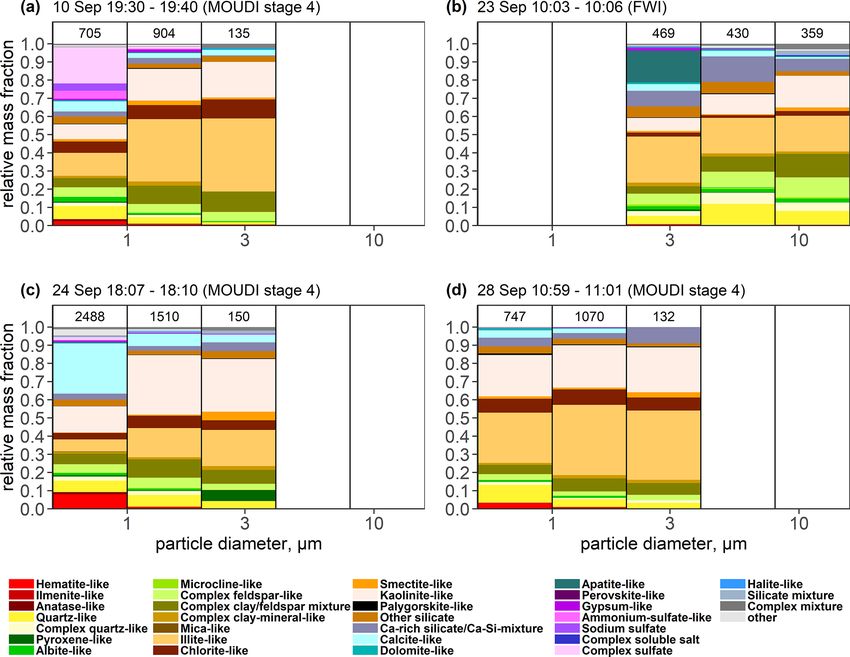
A. Panta et al.: Single-particle analysis of Saharan dust                                                                             3865

Figure 1. (a) Northwestern Africa showing the area of operation of the FRAGMENT campaign. The main location of L’Bour is shown
by a star and is located close to the Drâa river basin. (b) Schematic representation of different instruments used in the campaign, with
green dots highlighting those instruments used for single particle analysis. (c) Flat-plate deposition sampler (FPS). (d) Free-wing impactor
(FWI). (e) Cascade impactor (micro-orifice uniform deposit impactor, MOUDI). (f) Sampling schedule of particle collection using different
techniques. The horizontal bar represents the start and end of the sampling time. Note that due to very short sampling time for FWI and
MOUDI, the two bars (start and end) appear as one. Panel (a) was created using Google Earth (US Dept of State Geographer, Data SIO,
NOAA, US Navy, NGA, GEBCO, © 2020 Google, Image Landsat/Copernicus).

software expansion was used to obtain particle data from                with the AZtec software. A final sorting step is done to re-
thousands of particles in an efficient way. All of the samples          move particles with low X-ray counts due to shading effects.
were analyzed in high-vacuum conditions without any pre-
treatment. Backscattered electron (BSE) imagery was used                2.4     Particle morphology determination
for particle detection, as dust particles are composed of el-
ements with atomic numbers greater than carbon and are                  2.4.1    Projected-area and volume-equivalent diameters
therefore visible as detectable bright spots in the BSE image.          In the present study, the image analysis integrated into the
An acceleration voltage of 12.5 kV, beam current of 18 nA,              SEM-EDX software AZtec is used to determine the size of
“spot size 5.0” (beam diameter of ∼ 3 nm), and working dis-             particles as a projected area diameter. Projected area diam-
tance of approximately 10 mm were used to produce the opti-             eter, dp , is the diameter of a circle having the same area as
mum number of input counts by the EDX detector. The scan-               the dust particle projected in a two-dimensional image and is
ning resolution was tuned to particle size. For MOUDI and               calculated as follows:
FPS, 160 nm per pixel was used to identify particles with                     r
minimum size of 0.5 µm projected area diameter, and for                           4×A
                                                                        dp =             ,                                         (1)
FWI 360 nm per pixel was used to identify particles larger                          π
than 2.5 µm in projected area diameter. Chemistry informa-
                                                                        where A is the area covered by the particle on the sample
tion is derived by EDX. The internal ZAF correction (Z
                                                                        substrate.
being atomic number, A being absorption, and F being flu-
                                                                           Following Ott and Peters (2008), the volume-equivalent
orescence, accounting for matrix-dependent efficiencies) of
                                                                        diameter (sphere with the same volume as an irregularly
the detector and software system – based on inter-peak back-
                                                                        shaped particle) also called the geometric diameter, dv , is
ground radiation absorption measurements for correction –
                                                                        estimated from the projected area diameter via volumetric
was used for obtaining quantitative results. The SEM-EDX
                                                                        shape factor expressed by particle projected area and perime-
results are normalized to 100 %, including those of the ele-
                                                                        ter (P ) as follows:
ments C, N, O, Na, Mg, Al, Si, P, S, Cl, K, Ca, Ti, V, Cr, Mn,
Fe, F, Zn, and Pb. The detection limits of each element are                   4π A         1 p
determined based on 2σ of the peak intensity and calculated             dv = 2 dp = 2 64π A3 .                                    (2)
                                                                                P         P

https://doi.org/10.5194/acp-23-3861-2023                                                 Atmos. Chem. Phys., 23, 3861–3885, 2023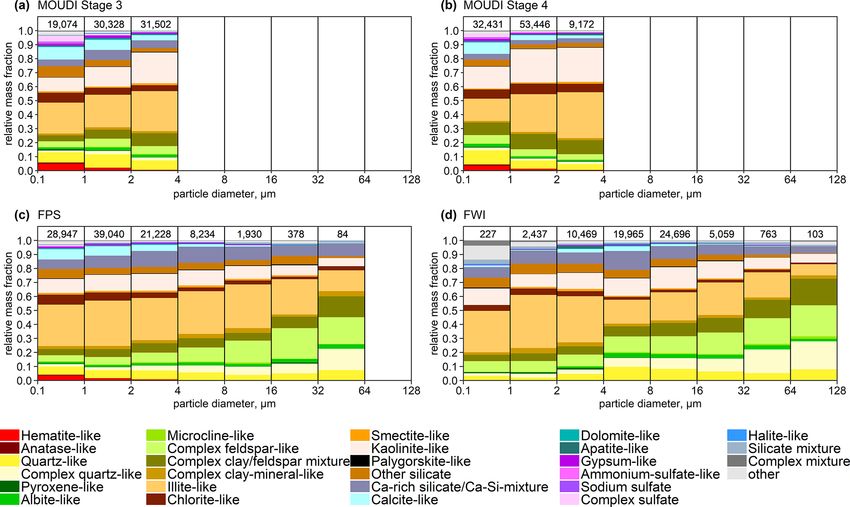
3866                                                                 A. Panta et al.: Single-particle analysis of Saharan dust

   All particle diameters (d) presented here are con-              where A is the total analyzed area, v is the impaction veloc-
verted from projected area-equivalent diameter to volume-          ity, t is the sample collection time, and i is the index of the
equivalent (geometric) diameter (unless stated otherwise).         particle.
The reason for this conversion is that geometric diameter
is used in global aerosol models to quantify dust size (Ma-        2.5.2    Determining the size distributions from the
howald et al., 2014) and optical properties depend on the par-              flat-plate sampler and cascade impactor
ticle volume.                                                               measurements

2.4.2    Aspect ratio                                              Obtaining atmospheric concentrations from the NDR re-
                                                                   quires the use of different deposition velocity models for the
The two-dimensional (2D) shape of individual dust particles        flat-plate sampler. There are a variety of models to estimate
is presented here as aspect ratio (AR) and was calculated by       particle deposition speed based on a set of assumptions and
the image analysis integrated into the SEM-EDX software            neglected factors (Noll et al., 2001; Aluko and Noll, 2006;
AZtec. The AZtec software manual defines AR as the ratio           Piskunov, 2009; Petroff and Zhang, 2010). However, none of
of the major to the minor axis of the elliptical fit on the pro-   these models fitted the observed deposition velocities, which
jected particle area. Symmetrical features, such as spheres        appeared to be rather uniform in Waza et al. (2019). There-
or cubes, have an AR that is approximately 1 whereas fea-          fore, for the present work, a constant deposition velocity for
tures that have shapes like ovals or needles have an AR that       the size range of interest was assumed, and the PSD were
is greater than 1. A critical shortcoming of 2D imaging is         normalized by fitting the number (N) size distribution to the
that it can yield different shapes of 3D particles depending       power law dN / d log Dp = cDp−2 and dividing all measure-
on their orientations on the sampling substrate (Huang et al.,     ments by the fitted proportionality constant c (Kok, 2011).
2020).                                                             For the MOUDI samples, atmospheric concentrations cannot
                                                                   be determined with the analytic approach used in this work
2.5     Number deposition rate calculation                         because the size of the impaction spot cannot be retrieved
                                                                   with high accuracy to get the total number of particles de-
The number deposition rate (NDR) is calculated from de-
                                                                   posited at each spot. Therefore, the same approach as FPS is
posited particle numbers per area and individual particle size.
                                                                   applied to the MOUDI samples to get the PSD. In addition,
First, a window correction (cw ) was applied (Kandler et al.,
                                                                   direct comparison is often difficult among different instru-
2009) to the particle deposition rate as
                                                                   ments due to the different nature of particle collection from
              wx wy                                                each technique (Chou et al., 2008; Price et al., 2018).
cw =                         ,                              (3)
        (wx − dp )(wy − dp )
                                                                   2.6     Particle classification and composition
where wx and wy are the dimensions of the analysis rectan-
gle.                                                               SEM-EDX measures the elemental composition of individ-
   The NDR is then calculated as                                   ual dust particles. Some minerals have well-defined com-
         1 X                                                       positions and can therefore be readily identified (e.g., gyp-
NDR =            cw (dv , i),                          (4)         sum, quartz, calcite). Others, e.g., clay minerals, are vari-
        A×t i
                                                                   able in nature, so their identification is more ambiguous.
where A is the total analyzed area, t is the sample collection     Moreover, dust particles are commonly found in the form
time, and i is the index of the particle.                          of internal mixtures or aggregates rather than in their pure
                                                                   mineral forms, and therefore the method used in this study
                                                                   identifies the major mineral type in each particle. As there
2.5.1    Determining the size distributions from free-wing
                                                                   is no standardization that is suitable for characterization of
         impactor measurements
                                                                   mineral dust aerosols using SEM, different approaches have
Obtaining the atmospheric PSD from FWI requires consider-          been developed, ranging from a simple scheme (Kandler
ation of window correction and the collection efficiency de-       et al., 2007, 2009) to more complex ones (Kandler et al.,
pendence on the impaction speed and geometry. These cor-           2011, 2018). In comparing different desert aerosols (Kan-
rections are applied to every individual particle as a function    dler et al., 2020), plausible differences related to geology
of its size and composition to get the overall collection effi-    and weather conditions were observed; however, various bi-
ciency (ce ) (for detailed formalism, see Sect. S4). The atmo-     ases also exist between different techniques (Marsden et al.,
spheric concentration (C) is then computed from the deposi-        2019).
tion rate and velocity as                                             Particle classification in this study is supported by the
                                                                   analysis of dust and soil samples for the major mineral com-
         1  X
                                                                   position from X-ray diffraction (XRD) measurements re-
C=             cw (dv , i)ce ,                              (5)
       A×v×t i                                                     ported in a companion paper (González-Romero et al., 2023).

Atmos. Chem. Phys., 23, 3861–3885, 2023                                              https://doi.org/10.5194/acp-23-3861-2023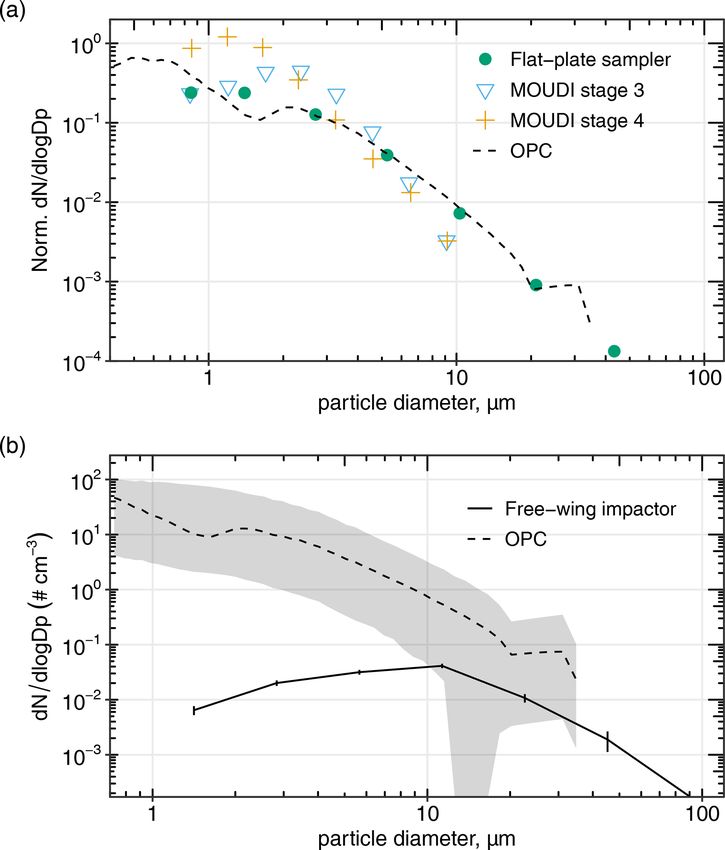
A. Panta et al.: Single-particle analysis of Saharan dust                                                                    3867

Furthermore, to assess artifacts, a few clean blank samples        dust geometric diameters assuming dust asphericity and as-
taken during the campaign were scanned, and certain parti-         pect ratios obtained with SEM aspherical dust. The details
cle types could be identified as contaminants and are thus         are described in a companion paper (González-Flórez et al.,
discarded from the analysis. The contaminants detected con-        2022) that thoroughly analyzes the emitted flux PSD and its
sisted of pure iron (apparently already from the manufactur-       variability.
ing process) and F + Si. The contaminants were mostly rare
compared to the abundance of dust particles.                       2.8    Statistical analysis
   Based on the single-particle composition quantification, an
elemental index for the element X is defined as the atomic         The uncertainty in the counting statistics for various parti-
ratio of the concentration of the element considered and the       cle groups was determined by generating confidence inter-
sum of the concentrations of the elements quantified (Kan-         vals assuming binomial distribution; i.e., for a relative num-
dler et al., 2007, 2018)                                           ber abundance of a particular particle group r, the two-sided
                                                                   95 % confidence interval is approximated (Hartung et al.,
                       X                                           2012).
|X| =                                    ,                  (6)
         Na + Mg + Al + Si + P + S + Cl
        +K + Ca + Ti + Cr + Mn + Fe + Co
                                                                   3     Results and discussion
where the element symbols represent the relative contribu-
tion (in atom percentage) measured for each particle. Note         3.1    Observed particle types
that the given method was not applied to quantify the per-
centage of C, N, and O due to their high uncertainty and           Typical chemical compositions of a set of minerals and
substrate contributions. The method used to analyze particles      boundary rules were used to define particle groups (see
collected on substrates follows our previous work (Kandler         Sect. S1). Based on set classification rules, particles were
et al., 2018), and therefore the approach is only described        assigned to different types. Each of these particle types is
briefly here. Classification was done using a set of rules,        discussed further in Sect. S2. Figure 2 and Table S3 show the
which use the elemental index and additional elemental ra-         average elemental composition of these groups. However, it
tios and are defined by the dominance of one or more spe-          is important to treat this classification scheme with caution as
cific elements or their ratios (e.g., Al, Si, Ca, Fe, Al / Si).    each particle can be composed of different minerals, which
Particle classes are named for their most prevalent chemical       can in part have variable or ambiguous compositions. As a
component(s), which may contain terms for mineral phases           result the groups used do not uniquely identify a mineral but
to simplify the naming (e.g., gypsum, quartz). The mineral         instead show the most probable mineral matching a particle
labels were assigned from the best match to the measured           composition. This is reflected in the suffix “-like” being used
elemental concentrations. There was no actual phase identi-        in the group nomenclature. As there are other potential iden-
fication of individual particles (e.g., by transmission electron   tification approaches, with their own associated advantages
microscopy) carried out. Therefore, all the particle classes       and limitations, the full data set generated and used in this
are termed “-like” to express the similarity in chemical fin-      study is provided for future studies.
gerprints. Details of the classification procedure are given in
Sect. S1.                                                          3.2    Comparison of PSD of different techniques for
                                                                          particle collection
2.7   Ancillary data
                                                                   Figure 3a presents normalized PSD obtained by FPS,
Aerosol PSDs of suspended mineral dust were also obtained          MOUDI, and OPC as described in Sect. 2.5.2. The normal-
by using an optical particle counter (OPC, FIDAS 200, Palas        ization allows us to easily compare the shape of the PSD ob-
GmbH, Germany). The measurement range of FIDAS was                 tained with the different techniques, i.e., the relative contri-
0.2–19 µm with a time resolution of 2 min and a flow of            bution of particles of different sizes. The PSD obtained by
4.80 L min−1 . Data acquisition was performed by a data log-       the FPS shows good agreement with that obtained from the
ger, averaging measurements over 2 min. In addition, meteo-        OPC. The PSD of the measured volume equivalent diameter
rological data were acquired with a time resolution of 1 s. Air    is towards the higher end of the cutoff aerodynamic diameter
temperature and relative humidity were measured by HC2A-           expected on individual MOUDI stages. In stage 3, the mode
S3 sensor (Campbell Scientific), and wind speed and wind di-       is at around 3 µm (nominal cut point 2.5 µm) and for stage
rection were recorded by a two-dimensional sonic anemome-          4 the mode is at 1 µm (nominal cut point 1 µm). Figure 3b
ter (Campbell Scientific WINDSONIC4-L) during the sam-             shows the PSD obtained by the FWI and is compared with
pling period at approximately 0.4, 0.8, 2, 5, and 10 m height      the PSD from the OPC. A clear discrepancy is observed be-
facing north above ground level (see Fig. A1). The average         tween FWI and OPC that is larger than the statistical uncer-
OPC concentration PSD is used here for comparison pur-             tainties. Here, the FWI substantially underestimates particles
poses. The default optical diameters were transformed into         < 10 µm. The collection efficiency of the FWI is 50 % for

https://doi.org/10.5194/acp-23-3861-2023                                           Atmos. Chem. Phys., 23, 3861–3885, 2023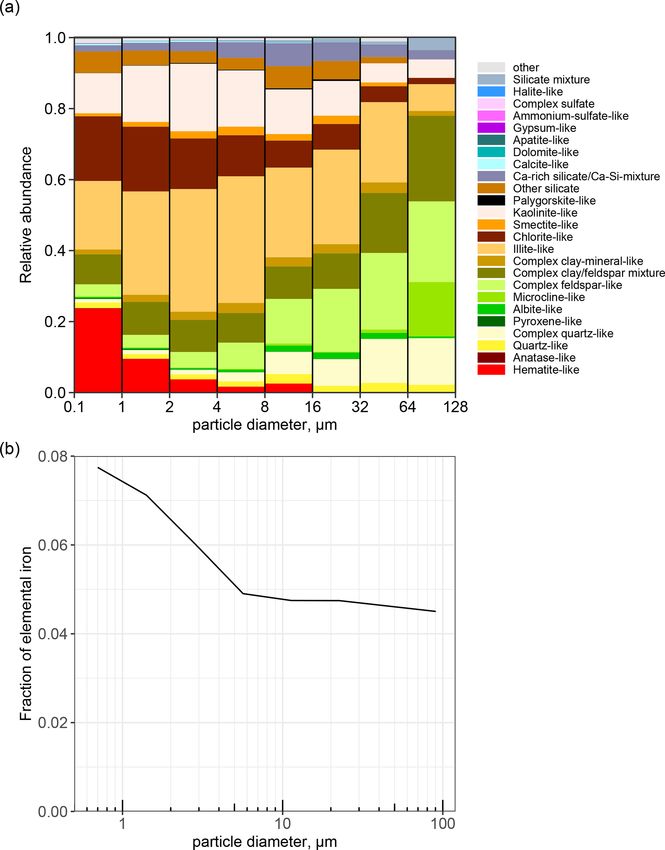
3868                                                                        A. Panta et al.: Single-particle analysis of Saharan dust

Figure 2. Average elemental composition as a function of particle size for different particle groups. The legend shows element index for
each respective element. The numbers on top represent total particle counts in the given size bin. Abundance bars are not shown for size bins
with fewer than 10 particles.

11 µm aerodynamic diameter particles (Kandler et al., 2018)              3.3   Particle composition
and therefore for fine mode particles the efficiency correc-
tion function can result in unrealistic values. For diameters            The dependence of composition on size is shown in Fig. 4
> 10 µm, the shape of the PSD is similar to that of the OPC              and Table 1 for aerosol samples collected with three dif-
but the observed concentrations are still an order of magni-             ferent sampling techniques. Since the composition of the
tude smaller. The discrepancy may be linked to one or more               aerosol particles in each sample does not exhibit a large
of the following potential sources of uncertainty: a poorly              sample-to-sample variability (see Figs. S2, S3, and S4 for in-
defined efficiency curve for the FWI and/or particle density             dividual samples), all of the dust sample compositions were
estimation from SEM to calculate volume equivalent diam-                 merged for further comparison. Furthermore, the collection
eter for efficiency correction. In this contribution, the shape          efficiency by size is less relevant to the fractional contribu-
(and not absolute concentration) of the PSD is relevant and              tion of each mineral type per size, and therefore integrating
is quite similar among the different measurement techniques              all the techniques together improves the statistics for each
used and OPC. It therefore provides confidence in the size-              size with a higher number of particles analyzed.
resolved elemental composition derived by SEM.                              A clear trend is seen among the different particle groups
                                                                         based on their size. Clay minerals are the most abundant
                                                                         and are present across all size ranges. Quartz-like particles
                                                                         are found in each size class with almost similar mass abun-

Atmos. Chem. Phys., 23, 3861–3885, 2023                                                     https://doi.org/10.5194/acp-23-3861-2023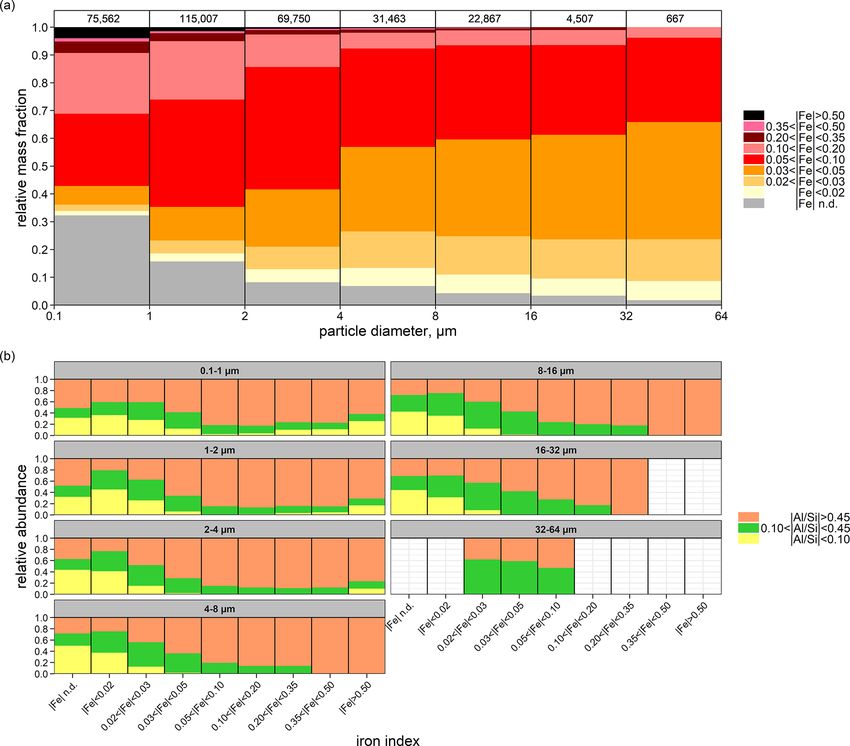
A. Panta et al.: Single-particle analysis of Saharan dust                                                                          3869

                                                                       because of the iron content. Similarly, the proportion of Ca-
                                                                       rich particles (calcite, dolomite, gypsum, apatite) are mainly
                                                                       confined to particles smaller than 4 µm. The Ca–Si mixture
                                                                       is slightly enhanced at dv > 4 µm, which could be due to
                                                                       the availability of more silicates to form aggregates with cal-
                                                                       cite, and the depletion of illite-like particles could also partly
                                                                       form aggregates with calcite as well. Sulfate-like particles
                                                                       are mainly present in the smallest size bin of < 1 µm. These
                                                                       are most probably anthropogenic or secondary aerosol as cor-
                                                                       roborated with measurements of optical properties (Yus-Díez
                                                                       et al., 2023) and PSD (González-Flórez et al., 2022).
                                                                          Studies on individual particle analysis of mineral dust by
                                                                       SEM and EDX have provided insights into the composi-
                                                                       tional variability, size, and morphological characteristics of
                                                                       dust particles from different regions. Kandler et al. (2009)
                                                                       presents the composition of Saharan mineral dust collected
                                                                       during the SAMUM campaign from in situ measurements at
                                                                       Tinfou, Morocco, in May–June 2006, thus providing an ideal
                                                                       comparison to our findings. On average, their particle com-
                                                                       position between 0.5 and 50 µm diameter is also primarily
                                                                       aluminosilicates with a smaller contribution of quartz and
                                                                       calcium-rich particles. However, one finding of note from
                                                                       Kandler et al. (2009) is the observation of quartz fraction to
                                                                       increase with particle size, mainly for particles larger than
Figure 3. (a) Normalized particle size distribution obtained by dif-   20 µm in diameter. Although our results reveal that quartz-
ferent sampling techniques averaged over the entire campaign pe-       like and complex-quartz-like fractions increase with parti-
riod. (b) Comparison of the atmospheric particle size distribution     cle size, these are not the dominant components as reported
between FWI and OPC. The bold line is for FWI, with the error bar      in Kandler et al. (2009). Marsden et al. (2019) present the
showing the Poisson counting error, the dashed line indicates the      mineralogy and mixing state of particles smaller than 2.5 µm
field campaign mean size distribution from OPC, and the shaded         in laboratory-suspended northern African dust using SEM.
region shows the 95th and 5th percentiles. Note that the collection
                                                                       They found a dominance of clay minerals in the size <
efficiency of the FWI drops significantly below ∼ 15 µm diameter.
                                                                       2.5 µm, which is similar to the observations reported in the
                                                                       current study. Scheuvens et al. (2011) observed composi-
                                                                       tional homogeneity of dust over southern Morocco, consis-
dance (around 5 %–8 %), whereas the mass fraction for com-             tent with our results, indicating dust at source regions to
plex quartz-like particles grows with particle size from 2 % in        not usually be affected by anthropogenic components. Addi-
dv < 1 µm to 22 % in dv > 64 µm. This suggests that as par-            tionally, compositional and morphological homogeneity was
ticle size increases, quartz particles get internally mixed with       also reported by Chou et al. (2008) for dust samples taken
elements like Al and Fe, forming complex aggregates. Like-             over Niger. Nevertheless, our study shows distinct composi-
wise, a similar trend is observed for feldspar particles where         tional signatures of prominent source area (e.g., occurrence
complex feldspar-like particles increase with particle size as         of apatite-like particles, elevated Ca-rich content). For the
a result of the inclusion of other elements creating a com-            Middle East, Jish Prakash et al. (2016) reported relative mass
plex mixture. This observation is consistent with Engelbrecht          abundance of 45 %–75 % clay minerals, 5 %–54 % feldspar,
et al. (2016, 2017), who found larger particles to be generally        and 0.1 %–10.2 % quartz as main components, while cal-
present as aggregates and coatings on other mineral particles.         cite, dolomite, gypsum, and iron oxides were the minor con-
A detailed discussion on feldspar particles is addressed fur-          stituents of individual dust particles in the size range 0.5–
ther in Sect. 3.3.4. Fe-rich particles are present in low quan-        38 µm. This is quite similar to our results if the “complex”
tities, and their contribution decreases with particle size. As        part of the quartz and feldspar fraction, together with its
they are highly relevant in controlling spectral shortwave re-         “mineral-like” component, is considered one fraction, sug-
fractive index (Engelbrecht et al., 2016; Caponi et al., 2017;         gesting a similarity between Arabian and Saharan dust. A
Di Biagio et al., 2019), they are further discussed in detail in       separate study from Engelbrecht et al. (2009a) found quartz
Sect. 3.3.3. Furthermore, iron is detected across all the size         and feldspars to be the dominant particle type in Kuwait,
classes and present in most of the particle groups. This could         while calcite and dolomite were major components in the
have further implications for the absorption as absorption in-         dust particles from the UAE and Iraq. This is quite different
creases with particle size, which could be further enhanced            to the mineralogy in our study and could be due to the dif-

https://doi.org/10.5194/acp-23-3861-2023                                               Atmos. Chem. Phys., 23, 3861–3885, 2023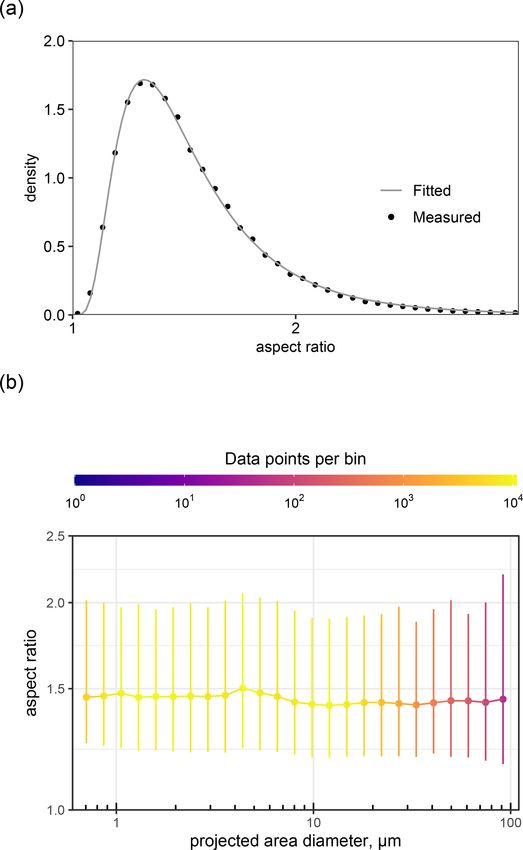
3870                                                                             A. Panta et al.: Single-particle analysis of Saharan dust

Table 1. Size-resolved mass fraction (%) of particles in each particle class (number fraction in parentheses).

                                                                                     Size class in µm
 Particle type                              0.1–1             1–2             2–4             4–8               8–16          16–32           32–64
 Hematite-like                         3.75 (4.15)     1.40 (1.62)     0.57 (0.62)     0.33 (0.32)        0.16 (0.21)
 Anatase-like                          0.84 (1.03)     0.22 (0.26)     0.09 (0.11)     0.06 (0.06)
 Quartz-like                           7.99 (7.64)     6.76 (6.70)     5.97 (6.10)     8.40 (7.47)        7.95 (8.31)     6.34 (6.22)     5.41 (5.13)
 Complex quartz-like                   1.72 (1.58)     1.98 (1.87)     2.68 (2.51)     5.78 (5.09)        7.59 (7.43)     8.93 (8.38)   16.62 (14.24)
 Pyroxene-like                         0.56 (0.75)     0.31 (0.32)     0.39 (0.33)     0.25 (0.31)        0.08 (0.10)
 Albite-like                           1.64 (1.46)     1.45 (1.43)     1.51 (1.58)     2.69 (2.34)        2.72 (2.77)     2.66 (2.62)     2.97 (3.03)
 Microcline-like                       0.24 (0.23)     0.38 (0.33)     0.45 (0.44)     0.65 (0.62)        0.71 (0.72)     0.45 (0.53)
 Complex feldspar-like                 5.08 (4.64)     5.34 (5.25)     6.36 (6.01)    10.48 (9.50)      12.29 (12.13)   15.95 (15.29)   18.33 (18.79)
 Illite-like                         22.11 (21.09)   27.85 (26.93)   30.31 (29.76)   21.54 (23.85)      20.79 (19.78)   23.38 (23.72)   17.86 (19.72)
 Chlorite-like                         6.80 (6.63)     6.16 (6.48)     4.15 (4.41)     2.31 (2.68)        1.96 (2.01)     1.96 (2.07)     2.04 (2.10)
 Smectite-like                         1.01 (1.01)     1.01 (1.01)     1.41 (1.31)     1.08 (1.21)        1.03 (0.98)     0.90 (0.99)
 Kaolinite-like                      12.42 (11.33)   16.94 (16.40)   17.13 (17.18)   12.82 (13.29)      14.60 (14.07)   11.85 (12.78)     7.50 (7.58)
 Palygorskite-like                     0.23 (0.24)     0.25 (0.23)     0.36 (0.37)     0.32 (0.32)        0.56 (0.51)     0.58 (0.62)
 Ca-rich silicate or Ca–Si mixture     5.06 (4.97)     6.11 (5.91)     7.48 (7.35)   12.19 (11.71)       9.21 (10.17)     7.23 (7.32)     6.12 (5.60)
 Calcite-like                          8.00 (8.87)     5.42 (5.88)     3.49 (4.06)     2.77 (2.88)        1.35 (1.66)     0.44 (0.53)
 Dolomite-like                         0.70 (0.68)     0.60 (0.65)     0.43 (0.48)     0.62 (0.59)        0.50 (0.54)     0.25 (0.35)
 Apatite-like                          0.35 (0.41)     0.26 (0.25)     0.67 (0.65)     0.09 (0.15)        0.06 (0.07)
 Gypsum-like                           1.39 (1.47)     1.31 (1.53)     0.89 (1.17)     0.57 (0.66)        0.38 (0.47)
 Ammonium-sulfate-like                 0.58 (0.74)     0.13 (0.19)     0.06 (0.07)
 Complex sulfate                       2.19 (2.87)     0.40 (0.69)     0.05 (0.08)
 Halite-like                           0.09 (0.09)     0.23 (0.23)     0.28 (0.31)     0.52 (0.49)        0.24 (0.29)

Figure 4. Average size-resolved mass abundance of different particle groups. The numbers on top represent total particle counts in the given
size bin.

Atmos. Chem. Phys., 23, 3861–3885, 2023                                                              https://doi.org/10.5194/acp-23-3861-2023
A. Panta et al.: Single-particle analysis of Saharan dust 3871
ferent chemical weathering regime and the composition of cles, and sulfates are virtually absent in samples from FWI
the parent sediments. In Asia, Jeong (2008) reported miner- in dv < 3 µm, which is the size range where they are typi-
alogical properties of Asian dust to mainly consist of clay cally observed. However, the number of particles analyzed
aggregates (48 %), quartz (22 %), plagioclase (11 %), cal- in the given size is significantly less compared to FPS or
cite (6 %), and K-feldspar (5 %). The mineral composition MOUDI. Note that it was not possible to perform sampling
of Asian dust therefore has a higher K-feldspar content com- with FWI and MOUDI under the highest dust concentrations
pared to our findings in Morocco, while illite is observed in due to the high concentrations and consequentially extremely
both the Asian dust and our study as a major clay mineral. short sampling times that would have been necessary.
Differences in abundance for some of the classes among
3.3.1 Particle abundances using different techniques
the different techniques might be due to the way that parti-
cles reach the substrate. In MOUDI and FWI, particles are
Figure 5 shows the compositional information for dust sam- impacted on the substrate, whereas in FPS particles are de-
ples obtained using three different collection techniques. posited by gravitational settling and turbulent diffusion. One
These techniques have different collection efficiencies, tar- hypothesis for such difference is that in the MOUDI the
get size ranges, and sampling intervals. The goal was to get high impaction speed experienced by particle aggregates on
a representative number of particles across a wide size dis- the top stages may break some of them into smaller ones
tribution, which is usually the case for mineral dust. How- and get carried away along the air streams onto the lower
ever, the collection of particles larger than a few microm- stages. Such a hypothesis is consistent with the enhancement
eters is relatively difficult due to the poor collection effi- of clay-like aggregates in MOUDI. Other observed differ-
ciency of many instruments. Therefore, in this work an inlet- ences between the sampling techniques could be related to
free impactor, i.e., FWI, was used to sample particles with the non-parallel sampling times. MOUDI and FWI samples
dv > 3 µm, whereas FPS and MOUDI were used primarily represent a few minutes compared to the usually half-day ex-
for particles with dv < 3 µm. The non-parallel sampling time posure time for FPS. However, as variations in the compo-
of the sampling techniques during the present field campaign sition are fairly similar for all of our analyzed samples, the
could not be avoided as FWI and MOUDI operate actively latter is most likely not a major aspect.
while the FPS operates passively. The active samplers have
a much higher collection velocity. This requires short sam- 3.3.2 Temporal variability
pling time for the two active samplers. On the contrary, the
passive sampler (i.e., FPS) require a much longer sampling Figure 6 displays time series of number abundances in three
time. Using the same collection time would result in either size ranges for the different particle groups observed in de-
under-loading of the passive samplers or overloading of the position samplers. While the dependence of particle size dis-
active samplers. tribution on sample mineralogy is quite strong, the temporal
In the MOUDI sample, most of the collected particles variation in the major particle groups does not show signifi-
(> 97 %) were dv < 5 µm. In stage 3, 56 % of the collected cant variability. This behavior is to be expected as sampling
particles were within the specified stage size range; the size was done in the source region, and the average daily compo-
of half of the remaining particles was below the lower cut- sition is relatively constant.
off and that of the other half was above the upper cutoff. Nevertheless, looking at specific samples we can observe
The major constituents were illite-like particles, kaolinite- distinct compositional differences. Figure 7 shows chemical
like particles, quartz-like particles, Ca–silicate mixture, com- composition for four different situations. Secondary sulfates
plex clay–feldspar mixture, and calcite-like particles with were dominant in particles with dv < 2 µm in samples col-
feldspar-like particles, quartz-like particles, hematite-like lected during 8–10 September when the wind came from
particles, and sulfates as minor constituents. A similar trend the east (i.e., M’Hamid), suggesting an anthropogenic ori-
was also observed in stage 4 of MOUDI except for an en- gin that is further corroborated with measurements of optical
hanced abundance of kaolinite-like and complex clay parti- properties (Yus-Díez et al., 2023) and PSD (González-Flórez
cles. In the FPS samples, the number of collected particles in et al., 2022). This was also observed for small particles in
the size range 0.1 < dv < 5 µm is quite comparable to stage the SAMUM campaign in Tinfou, Morocco (Kaaden et al.,
3 of MOUDI. For particles with dv > 5 µm, the composition 2009). Apatite-like particles were almost non-existent in our
changes only slightly by increasing quartz-like particles and samples except on some specific days (20 and 23 Septem-
decreasing calcite-like particles. In the FWI samples, more ber). They were identified by the presence of Ca and P. Fur-
than 70 % of particles were dv > 5 µm. The number abun- thermore, manual inspection of the particles showed it to
dance of feldspar-like particles, quartz-like particles, com- be not beam sensitive, with no Cl and F signals detected.
plex feldspar-like particles, and complex clay–feldspar mix- Even though hydroxyapatite [Ca5 OH(PO4 )3 ] is not com-
ture particles increases with increasing particle size, while monly found in the Morocco phosphate deposits, the absence
the number abundance of clay-like particles tends to de- of Cl and F suggests it to be hydroxyapatite originating from
crease. In contrast, calcite-like particles, gypsum-like parti- a distinct geogenic source. Most of these particles were con-
https://doi.org/10.5194/acp-23-3861-2023 Atmos. Chem. Phys., 23, 3861–3885, 20233872 A. Panta et al.: Single-particle analysis of Saharan dust
Figure 5. Average size-resolved mass abundance of different particle groups using different sampling techniques collected over the campaign
period. The numbers on top represent total particle counts in the given size bin. Abundance bars are not shown for size bins with fewer than
30 particles.
fined to the size dv 2–4 µm. In these particles, phosphorus is
attached to the crystal lattice, which is one of the important
dust-derived nutrients for marine and terrestrial ecosystems
controlling phytoplankton productivity and carbon uptake
(Stockdale et al., 2016). The sampling day of 24 September
is characterized by elevated Ca-rich particles, making it the
most calcium-rich day and were present mainly in dv < 1 µm.
Here it was present in 30 % of samples compared to the aver-
age of 5 %. This observation could be due to advection from a
prominent dust source. Furthermore, the iron-rich particle is
also quite pronounced on this day, indicating a special source
imprint.
3.3.3 Iron distribution
Clay minerals and Fe oxide-hydroxides such as hematite,
goethite, and magnetite, contain Fe, which is a key ingredi-
ent to numerous climatic, environmental, and biological pro-
cesses affected by dust (Schulz et al., 2012). Fe in minerals
can be broadly classified into structural Fe, which is typically
found in the crystal lattice of clay minerals, and Fe in the
form of oxide or hydroxide particles (mainly hematite and
Figure 6. Time series of chemical composition for particles of
goethite) (Kandler et al., 2009; Scheuvens et al., 2011). The
(a) 0.1 < d < 2.5 µm, (b) 2.5 < d < 5 µm, and (c) 5 < d < 20 µm at amount of free Fe oxide-hydroxides, along with their size
L’Bour. and aggregation or mixing state (internal vs. external mixing)
with other minerals, determines the degree of absorption of
solar radiation by dust (Sokolik and Toon, 1999; Moosmüller
Atmos. Chem. Phys., 23, 3861–3885, 2023 https://doi.org/10.5194/acp-23-3861-2023A. Panta et al.: Single-particle analysis of Saharan dust 3873 Figure 7. Phase compositions of size bins for samples collected under specific meteorological conditions at specific times and on certain days: (a) sulfate episode, (b) apatite particles, (c) Ca-rich episode, and (d) typical average composition. The total number of analyzed particles is given for each size class, but those with fewer than 30 particles are not shown. et al., 2012; Zhang et al., 2015; Di Biagio et al., 2019) and the ratios indicate dominance of structural Fe-containing clay potential Fe solubility (Baker and Jickells, 2006; Marcotte minerals, like illite, smectite, and chlorite, which also tend et al., 2020) of the deposited dust that fertilizes the ocean. to be internally mixed with Fe oxide-hydroxides (Kandler In addition, it has been suggested that ocean primary pro- et al., 2011). Low Al / Si ratios tend to be associated with ductivity depends not only on the dissolved Fe but also on quartz-like particles. suspended solid Fe particles and their mineralogical compo- The relative mass of particles with Fe fractions above 0.1 nents (Hettiarachchi et al., 2021). Furthermore, dust absorp- decreases with increasing particle size. Among these, parti- tive properties vary in different source regions mainly due cles with Fe fractions above 0.5 are hematite-like particles to variations in the Fe oxide fractions (Lafon et al., 2006). as shown in Fig. 8a; their relative abundance is ∼ 4 % be- While SEM cannot distinguish between structural and free low 1 µm, which decreases steeply with size to the extent that Fe, by providing the total Fe content on a particle-by-particle no appreciable amounts are observed above 4 µm. Given the basis, it can provide some useful clues on the mixing state of amount of Fe, these hematite-like particles are mostly com- Fe oxide-hydroxides. posed of Fe oxide-hydroxides and to the first order could To understand the Fe content and to some extent the mix- be taken as externally mixed Fe oxide-hydroxide particles. ing state, along with the type of particles that Fe is associated However, they still show some degree of aggregation with with, Fig. 8a shows the relative abundance of particles clas- other minerals that increase with particle size. This can be sified into nine categories according to their Fe content as appreciated in Fig. 2, where hematite-like particles show in- a function of particle size, and Fig. 8b further displays the creasing amounts of Si, Al, and Mg with size. Figure 8b relative abundances of particles for each of the nine Fe cate- shows that aggregation of Fe oxide-hydroxides (Fe > 0.5) gories and particle size ranges according to three Al / Si ra- in hematite-like particles happens mainly with clays (high tio categories. The Al / Si ratio is chosen because it has little Al / Si ratios), but particles with low Al / Si ratios were also measurement uncertainty and varies significantly for differ- observed for diameters < 4 µm. These are most likely for a ent mineral groups, as discussed in Sect. S2.9. High Al / Si fraction of particles (e.g., complex quartz-like particles) with https://doi.org/10.5194/acp-23-3861-2023 Atmos. Chem. Phys., 23, 3861–3885, 2023
You can also read


