Innovation, reallocation, and growth in the 21st century
←
→
Page content transcription
If your browser does not render page correctly, please read the page content below
Innovation, reallocation, and
growth in the 21st century
Elias Einiö, Heli Koski, Tero Kuusi, Markku Lehmus

P U B L I C AT I O N S O F T H E G O V E R N M E N T ’ S A N A LY S I S ,
A S S E S S M E N T A N D R E S E A R C H AC T I V I T I E S 2022:1 tietokayttoon.fi/en

 Government’s analysis,
 assessment and research activities
Publications of the Government´s analysis, assessment and research
activities 2022:1

Innovation, reallocation,
and growth in the 21st
century
Elias Einiö, Heli Koski, Tero Kuusi, Markku Lehmus

Prime Minister’s Office Helsinki 2022
Prime Minister’s Office
This publication is copyrighted. You may download, display and print it for Your own personal
use. Commercial use is prohibited.

ISBN pdf: 978-952-383-417-0
ISSN pdf: 2342-6799

Layout: Government Administration Department, Publications

Helsinki 2022 Finland
Description sheet
 13 January 2022

Innovation, reallocation, and growth in the 21st century

Publications of the Government´s analysis, assessment and research activities 2022:1

Publisher Prime Minister’s Office

Author(s) Elias Einiö, Heli Koski, Tero Kuusi and Markku Lehmus

Language English Pages 56

Abstract Our work applies the model developed by Acemoglu et al. (2018), henceforth, AAABK, for
 assessing the growth and welfare implications of different types of innovation policies.
 Central to the AAABK model is the ratio of high-productivity and low-productivity firms in
 total output and how different policy measures affect this relationship.

 We employ the AAABK framework in order to build a macroeconomic model of the
 innovative business sector in Finland and fit it to the company-level micro-data on Finnish
 companies from 2000 to 2016. Acemoglu et al. (2018) employed US data from the 1980s
 and 1990s. We complement their work by estimating the AAABK model for more recent
 years: 2000–2016. Our results add to the literature by providing evidence on the
 aggregate effectiveness of innovation policies in this more recent period of slower
 economic growth.

 Our empirical findings yield, by and large, similar qualitative conclusions on the effects of
 public policies on economic growth and welfare to those reported in the original work
 using the US data. Generally, increasing R&D subsidies would be a recommendable
 policy. The welfare impacts of R&D subsidies are highest when they accelerate the re-
 allocation of R&D workers to companies with high R&D productivity. The most effective
 innovation policy targets R&D subsidies to companies with the highest innovation capacity
 (i.e., in these companies, R&D employees generate the highest increase in a firm’s
 productivity). If subsidies are allocated to companies with low innovation capacity or to
 low-productivity companies that are close to exiting the market, there will be less
 innovation and slower economic growth.

Provision This publication is part of the implementation of the Government Plan for Analysis,
 Assessment and Research (tietokayttoon.fi). The content is the responsibility of the
 producers of the information and does not necessarily represent the view of the
 government.

Keywords Business subsidies, innovation, innovation policy, growth, growth models, research,
 research activities

ISBN PDF 978-952-383-417-0 ISSN PDF 2342-6799

URN address https://urn.fi/URN:ISBN:978-952-383-417-0
Kuvailulehti
 13.1.2022

Innovaatiot, luova tuho ja kasvu 2000-luvulla

Valtioneuvoston selvitys- ja tutkimustoiminnan julkaisusarja 2022:1

Julkaisija Valtioneuvoston kanslia

Tekijä/t Elias Einiö, Heli Koski, Tero Kuusi ja Markku Lehmus

Kieli Englanti Sivumäärä 56

Tiivistelmä Tutkimuksemme soveltaa Acemoglun ym. (2018) kehittämää mallia (AAABK-malli), joka
 mahdollistaa erilaisten yrityssektoriin kohdennettujen politiikkatoimien
 kokonaistaloudellisten vaikutusten arvioinnin. Keskeistä AAABK-mallissa on korkean ja
 matalan tuottavuuden yritysten suhde kokonaistuotannosta ja se, miten eri
 politiikkatoimet vaikuttavat tähän suhteeseen.

 Rakennamme Suomen yrityssektoria kuvaavan makrotaloudellisen mallin ja sovitamme
 sen vastaamaan Suomen yrityskenttää käyttämällä yritystason mikroaineistoa
 suomalaisista yrityksistä vuosilta 2000-2016.

 Suomen talouteen sovitettu malli tuottaa samanlaisia laadullisia johtopäätöksiä
 yritystukien vaikutuksista talouskasvuun ja hyvinvointiin kuin AAABK:n Yhdysvaltojen
 taloutta koskeva analyysi. T&k-tukien määrän kasvattaminen olisi kannattavaa. Tukien
 kokonaistaloudelliset hyödyt ovat suurimmat, kun tuet kiihdyttävät t&k-työntekijöiden
 siirtymistä yrityksiin, joiden t&k-toiminnan tuottavuus on korkea. Tehokkainta
 innovaatiopolitiikkaa on t&k-tukien kohdentaminen yrityksille, joiden
 innovaatiokapasiteetti on korkein, eli joiden käytössä t&k-työvoima tuottaa suurimmat
 lisäykset yrityksen tuottavuuteen. Mikäli tuet kohdennetaan matalan
 innovaatiokapasiteetin yrityksiin tai lähellä markkinoilta poistumista oleviin matalan
 tuottavuuden yrityksiin, syntyy innovaatioita vähemmän ja talouskasvu on hitaampaa.

Klausuuli Tämä julkaisu on toteutettu osana valtioneuvoston selvitys- ja tutkimussuunnitelman toi-
 meenpanoa.(tietokayttoon.fi) Julkaisun sisällöstä vastaavat tiedon tuottajat, eikä tekstisi-
 sältö välttämättä edusta valtioneuvoston näkemystä.

Asiasanat Yritystuet, innovaatiot, innovaatiopolitiikka, kasvu, kasvumallit, tutkimus, tutkimustoiminta

ISBN PDF 978-952-383-417-0 ISSN PDF 2342-6799

Julkaisun osoite https://urn.fi/URN:ISBN:978-952-383-417-0
Presentationsblad
 13.1.2022

Innovation, kreativ förstörelse och tillväxt på 2000-talet

Publikationsserie för statsrådets utrednings- och forskningsverksamhet 2022:1

Utgivare Statsrådets kansli

Författare Elias Einiö, Heli Koski, Tero Kuusi och Markku Lehmus

Språk engelska Sidantal 56

Referat I vår undersökning använder vi den av Acemoglu et.al. (2018) utvecklade modellen
 (AAABK-modellen), som möjliggör utvärdering av de totalekonomiska effekterna av olika
 policyåtgärder som riktats mot företagssektorn. Centralt i AAABK-modellen är
 förhållandet mellan företag med hög produktivitet och företag med låg produktivitet i
 totalproduktionen och det, hur olika policyåtgärder inverkar på det här förhållandet.

 Vi bygger upp en makroekonomisk modell som avbildar Finlands företagssektor och
 anpassar den till att motsvara Finlands företagsfält genom att använda mikrodata på
 företagsnivå från finska företag från åren 2000-2016.

 Modellen som anpassats till Finlands ekonomi leder till likadana kvalitativa slutsatser om
 företagsstödens effekter på den ekonomiska tillväxten och välfärden som AAABK:s
 analys gällande USA:s ekonomi. Det skulle vara lönande att öka mängden FoU-stöd. Den
 totalekonomiska nyttan av stöden är störst, när stöden framskyndar överflyttningen av
 FoU-anställda till företag, vars FoU-verksamhet har en hög produktivitet. Den mest
 effektiva innovationspolitiken är att rikta FoU-stöden mot företag, vars
 innovationskapacitet är högst, d.v.s. hos vilka FoU-anställda genererar den största
 ökningen i företagens produktivitet. Ifall stöden riktas mot företag med låg
 innovationskapacitet eller mot företag med låg produktivitet som är nära att träda ut från
 marknaden, så resulterar det i att det uppstår färre innovationer och den ekonomiska
 tillväxten är långsammare.

Klausul Den här publikation är en del i genomförandet av statsrådets utrednings- och forsknings-
 plan.(tietokayttoon.fi) De som producerar informationen ansvarar för innehållet i publikat-
 ionen. Textinnehållet återspeglar inte nödvändigtvis statsrådets ståndpunkt.

Nyckelord Företagsstöder, innovation, innovations politik, tillväxt, tillväxtmodeller, forskning,
 forskningsverksamhet

ISBN PDF 978-952-383-417-0 ISSN PDF 2342-6799

URN-adress https://urn.fi/URN:ISBN:978-952-383-417-0
Contents

Tiivistelmä ........................................................................................................... 8

1 Introduction ............................................................................................. 12

2 Theoretical model .................................................................................... 16

3 Estimation ................................................................................................ 22
 3.1 Data............................................................................................................................. 22
 3.2 Estimation ................................................................................................................... 25

4 Results ..................................................................................................... 31
 4.1 Estimated Model Parameters ...................................................................................... 31
 4.2 Policy Experiments ...................................................................................................... 36
 4.2.1 Simple Policy Experiments ........................................................................ 39
 4.2.2 Social Planner ........................................................................................... 40
 4.2.3 More Realistic, Uniform Policies ................................................................ 42
 4.2.4 Policy Impacts in Different Samples .......................................................... 43

5 Extensions ............................................................................................... 45
 5.1 Labour Market Frictions............................................................................................... 45
 5.2 Changes in Labour Supply .......................................................................................... 47
 5.3 Three Types of Firm .................................................................................................... 48

6 Conclusions ............................................................................................. 49

Appendix 1. ....................................................................................................... 53

References ........................................................................................................ 55
PUBLICATIONS OF THE GOVERNMENT´S ANALYSIS, ASSESSMENT AND RESEARCH ACTIVITIES 2022:1

LUKI J ALLE

Viimeisen vuosikymmenen heikko tuottavuuskehitys ja laskeneet t&k-panostukset
ovat nousseet huolenaiheeksi monissa Suomen taloudellista tilaa ja tulevaisuuden nä-
kymiä koskevissa keskusteluissa. Syytä huoleen onkin, koska innovaatiot ja tuotta-
vuuskasvu ovat kilpailukykymme ja hyvinvointimme kannalta ratkaisevia tekijöitä.

Bruttokansantuotteeseen suhteutettujen tutkimus- ja kehitysmenojen lasku 2010-lu-
vulla aiheutui suurelta osin yrityssektorin t&k-intensiteetin supistumisesta vajaasta kol-
mesta prosentista 2,1 prosenttiin. Koska tutkimus- ja kehityspanostukset ovat tärkein
tuottavuuskasvua määrittävä tekijä, tarve löytää keinoja saada t&k-menot kasvu-uralle
on suuri. Hallitus on asettanut tavoitteekseen nostaa t&k-menot neljään prosenttiin
BKT:sta vuoteen 2030 mennessä. T&k-tuet ovat taloustieteellisen tutkimuksen mu-
kaan eräs parhaimmista innovaatiokannustimista yrityksille. Toisaalta t&k-tukien kuten
myös muiden innovaatiopoliittisten keinojen vaikutuksesta koko talouden kasvuun ja
hyvinvointiin tiedetään verrattain vähän.

Tämän hankkeen päämääränä on ollut tuottaa tietoa yritystukien kokonaistaloudelli-
sista vaikutuksista. Tieto on olennaisen tärkeää tehokkaan tukipolitiikan suunnitte-
lussa ja elinkeinopoliittisten toimenpiteiden toteutuksessa. Vastaavanlaisia tutkimuk-
sia on raportoitu maailmalla vain vähän ja harjoitus on ensimmäinen suomalaisella ai-
neistolla tehty.

Kiitämme hankkeen ohjausryhmää ja sen puheenjohtajaa Markku Stenborgia sekä
hankkeessa neuvonantajina toimineita Ari Hyytistä, Niku Määttästä ja Tuomas Taka-
loa hyvistä ja rakentavista kommenteista ja keskusteluista.

Tutkimusryhmän puolesta Heli Koski
Joulukuussa 2021

 7
PUBLICATIONS OF THE GOVERNMENT´S ANALYSIS, ASSESSMENT AND RESEARCH ACTIVITIES 2022:1

Tiivistelmä
Yritystukien kokonaistaloudellisten vaikutusten ymmärtäminen on olennaisen tärkeää
tehokkaan innovaatiopolitiikan suunnittelussa ja elinkeinopoliittisten toimenpiteiden to-
teutuksessa. Yritystuet vaikuttavat yrityssektorin uusiutumiskykyyn ja sitä kautta tuot-
tavuuden kasvuun ja kilpailukyvyn kehitykseen. Suorien vaikutusten lisäksi kokonais-
taloudellisiin vaikutuksiin sisältyvät tukien epäsuorat vaikutukset muihin yrityksiin läik-
kymismekanismien (mm. tiedon leviäminen) ja markkinahintojen (mm. työvoiman
hinta) kautta. Lisäksi tuet vaikuttavat joko vahvistavasti tai heikentävästi tuottavuuden
kehitykseen sen kautta kohdentuvatko ne matalan vai korkean tuottavuuden liiketoi-
mintaan. Onnistuneella yritystukipolitiikalla voidaan kiihdyttää talouden kasvua ja kil-
pailukyvyn parantumista. Toisaalta tuet voivat pahimmassa tapauksessa hidastaa
tuottavuuskasvua.

Tutkimuksemme soveltaa Acemoglun ym. (2018) kehittämää mallia (AAABK-malli),
joka mahdollistaa erilaisten yrityssektoriin kohdennettujen politiikkatoimien kokonaista-
loudellisten vaikutusten arvioinnin. AAABK-mallin avulla voidaan arvioida erityisesti ta-
loutta uudistavien tukien (t&k-tuet) kokonaistaloudellisia vaikutuksia. Malli huomioi tu-
kien suorien kannustinvaikutusten lisäksi epäsuorat vaikutukset, jotka syntyvät tiedon
läikkymisen ja markkinahintojen muutosten seurauksena. Malli tuottaa kvantitatiivisen
tuloksen myös politiikkatoimien hyvinvointivaikutuksista. Analyysi tuottaa johtopäätök-
siä myös ”säilyttäviä”, muita kuin yritysten innovaatiotoiminnan kustannuksia laskevia
tukia painottavan tukipolitiikan seurauksista (s. 38).

Keskeistä AAABK-mallissa on korkean ja matalan tuottavuuden yritysten suhde koko-
naistuotannosta ja se, miten eri politiikkatoimet vaikuttavat tähän suhteeseen. Mallin
makrotaloudellisessa analyysikehikossa politiikkatoimien aiheuttamat hintamuutokset
huomioidaan kansantalouden panos- ja tuotemarkkinoiden tasapainottumisen kautta.
Malli havainnollistaa erityisesti sitä, että kansantalouden tuottavuuskasvua määrittää
olennaisesti osaavan työvoiman määrä tutkimus- ja kehitystoiminnassa (t&k) korkean
t&k-tuottavuuden (ts. korkean innovaatiokapasiteetin) yrityksissä.

Tutkimuksessamme rakennetaan Suomen yrityssektoria kuvaava makrotaloudellinen
malli seuraten Acemoglun ym. (2018) teoriakehikkoa. Malli sovitetaan vastaamaan
Suomen yrityskenttää käyttämällä yritystason mikroaineistoa suomalaisista yrityksistä
vuosilta 2000-2016. Aineisto kattaa noin 99% koko talouden t&k-investoinneista. Toi-
sin kuin Acemoglun ym. (2018) käyttämä aineisto, kotimainen yritystason tilasto on
kattava myös pienempien yritysten osalta. Tämä mahdollistaa mallin sovittamisen
koko taloudelle, eikä vain suuremmille yrityksille.

 8
PUBLICATIONS OF THE GOVERNMENT´S ANALYSIS, ASSESSMENT AND RESEARCH ACTIVITIES 2022:1

Acemoglun ym. (2018) malli sovitetaan Suomen talouteen ns. simuloitujen moment-
tien menetelmän avulla. Menetelmä on tiivistetysti seuraavanlainen. Ensin suomalai-
sesta mikroaineistosta lasketaan yritysten kasvua, poistumista, t&k-toimintaa ja työ-
voiman käyttöä kuvaavia tilastollisia suureita – analyysissämme nämä ovat keskiar-
voja. Lisäksi aineistosta lasketaan kokonaistaloudellinen kasvuaste. Tämän jälkeen
teoreettista mallia vastaavasta ohjelmallisesti rakennetusta numeerisesta mallista las-
ketaan vastaavat tilastosuureet suurelle joukolle mallin eri parametriarvoja. Teoreetti-
sen mallin parametrien estimaateiksi valikoituvat ne, jotka tuottavat näissä simuloin-
neissa tilastoaineistosta laskettuja tilastollisia suureita parhaiten vastaavan tuloksen.

Hankkeessa tarkasteltiin sekä (1) yksinkertaisia tukipolitiikkoja, joissa tukia ei kohden-
neta yritysten t&k-toiminnan tuottavuuden perusteella että (2) valikoivia tukipolitiikkoja,
joissa tukea jaetaan t&k-toiminnan tuottavuuden perusteella. Käytännön innovaa-
tiopolitiikassa valikoimattomat tuet lähestyvät luonteeltaan neutraaleja t&k-verotukia,
jotka eivät kohdennu tietynlaisille yrityksille tai hankkeille. Tukea saavat yritykset valit-
sevat tutkimushankkeet maksimoidakseen markkinoilta saatavan tuottonsa. Yksinker-
taista tukipolitiikkaa voidaan perustella sillä, että käytännössä yritysten t&k-toiminnan
tuottavuutta on vaikea havaita. T&k-verotukien tavoitteena on suoria tukia neutraa-
limpi t&k-toiminnan volyymin ja tuottojen kasvattaminen. Analyysissamme tarkastellut
valikoivammat politiikkatoimet sisältävät sen sijaan suorien tukien piirteitä: tuen saajat
on valikoitava innovaatiokapasiteetin tapauskohtaisen arvioinnin perusteella eikä tu-
kien kohdentamista voida toteuttaa yleisillä verotuksessa käytettävissä olevilla tie-
doilla.

Perusotoksessa olivat kaikki suomalaiset innovatiiviset, vähintään kaksi henkilöä työl-
listävät yritykset. Tulokset osoittavat yritysten innovaatiokyvykkyyden mukaan koh-
dentuvan valikoivan innovaatiopolitiikan hyödyt. Mikäli tuet kohdennettaisiin ja mitoi-
tettaisiin optimaalisesti, täysin yritysten t&k-toiminnan tuottavuuden perusteella, hyvin-
vointi kasvaisi nykykulutuksella mitattuna 3.7%. Käytännössä tähän ei päästä, mutta
myös valikoimaton, optimaalisesti mitoitettu t&k-tuki vakiintuneille yrityksille tuottaa
huomattavan hyvinvoinnin kasvun verrattuna nykytilaan. Noin 1.8% kasvuun hyvin-
voinnissa päästäisiin hyvinvoinnin kasvun kannalta optimaalisesti mitoitetulla, valikoi-
mattomasti jaetulla lisätuella, jonka suuruus olisi 3.9% innovatiivisten yritysten tuotan-
non arvosta. Tähän arvioon liittyy epävarmuutta, mutta se on samaa kokoluokkaa
Acemoglun ym. (2018) löydösten kanssa. Koko Suomen talouden tasolla tämä tarkoit-
taisi t&k-tukien lisäämistä noin 1.1% bruttokansantuotteesta.

Suomalaisen rekisteriaineiston avulla pystyimme laajentamaan Acemoglun ym. (2018)
aineistoanalyysia aivan pienimpiin yrityksiin. Innovaatiopolitiikan mahdollisuudet hy-
vinvoinnin lisäämiseen jäävät pienemmiksi 2-5 henkilöä työllistävien mikroyritysten ol-
lessa mukana analyysissa. Tämä johtuu siitä, että mikroyritysten innovaatiopotentiaali
ja toiminnan kiinteät kustannukset ovat pienempiä. Siten politiikan aiheuttama luova

 9
PUBLICATIONS OF THE GOVERNMENT´S ANALYSIS, ASSESSMENT AND RESEARCH ACTIVITIES 2022:1

tuho ja työvoiman uudelleenallokointi yritysten välillä jää mittakaavalta pienemmäksi.
Kun mukaan luetaan mikroyritykset, luovan tuhon hyödyt ovat hieman pienemmät kuin
Yhdysvalloissa. Vähintään viisi henkilöä työllistävien yritysten joukossa politiikan hyö-
dyt ovat suuremmat kuin Yhdysvalloissa.

Lisäksi tarkastelimme mallissamme korkeasti koulutetun työvoiman tarjontaan vaikut-
tavia tekijöitä. Havaitsimme, että politiikkamuutosten vaikutukset olivat suurempia,
kun korkeasti koulutetut työntekijät määriteltiin kapeasti. Tämä johtui politiikan aiheut-
taman työvoiman uudelleenallokaation merkityksen lisääntymisestä; kun korkean
osaamisen työvoiman saatavuus on niukkaa, on kilpailu tästä avainresurssista voi-
makkaampaa toisaalta t&k-toimintojen ja muiden korkeaa osaamista edellyttävien toi-
mintojen välillä ja toisaalta matalan ja korkean innovaatiokapasiteetin omaavien yritys-
ten välillä. Tällöin politiikkatoimilla on tärkeämpi rooli yhteiskunnan kannalta optimaali-
sen t&k-työvoiman määrään toteutumisessa korkean innovaatiokapasiteetin yrityk-
sissä. Tutkimme myös osaavan työvoiman tarjonnan lisääntymisen vaikutuksia, joka
voi seurata esimerkiksi maahanmuuton myötä. Tarjonnan kasvulla on positiivisia vai-
kutuksia talouskasvuun, mutta niitä pitäisi toteuttaa yhdessä innovaatiopolitiikan uu-
distuksien kanssa.

Mitä paremmin tuet saadaan kohdennettua korkean innovaatiokapasiteetin yrityksiin,
sitä suuremmat ovat positiiviset ulkoisvaikutukset. Tämä on seurausta siitä, että tä-
män päivän innovaatiot rakentuvat aiemmin tuotetun tiedon varaan; yritykset hyötyvät
muiden yritysten aiemmin tuottamasta tiedosta innovaatiohankkeita toteuttaessaan.
Yrityksen on esimerkiksi helpompi kehittää uusia hyödykkeitä, kun se voi oppia mui-
den yritysten markkinoille tuomissa tuotteissa käytetyistä ratkaisuista ja hyödyntää
niitä. Yritykset hyötyvät myös muiden yritysten kehittämästä tietopääomasta, josta osa
on julkisesti saatavilla (mm. patenttidokumentit ja kilpailijoiden tuotteiden sisältämät
teknologiat). Erityisesti tilanteessa, jossa tuet voitaisiin täysin kohdistaa t&k-toiminnan
tuottavuuden perusteella, tukien vaikutus on merkittävästi yksinkertaista tukea suu-
rempi. Joka tapauksessa vaikutus on myönteinen vain, jos tuet eivät kohdistu merkit-
tävällä tavalla markkinoilta poistuvien yrityksien toiminnan ylläpitämiseen.

Käytännössä tehokkaimmillaan innovaatiopolitiikan harjoittaminen vaatisi sitä, että
t&k-tukipäätöksiä tekevien virkailijoiden pitäisi pystyä erottamaan toisistaan korkean ja
matalan t&k-tuottavuuden yritykset. AAABK-tutkimuksessa korkean t&k-tuottavuuden
yrityksille on ominaista matalan t&k-tuottavuuden yrityksiä suurempi innovaatiokapasi-
teetti. Suuremman innovaatiokapasiteetin yritykset onnistuvat todennäköisemmin li-
säämään uusia, markkinoilla menestyviä tuotteita portfolioonsa. Käytännössä yritys-
ten innovaatiokapasiteettia arvioitaessa uusien tuotteiden määrä tietyltä ajanjaksolta
voisi olla yksi indikaattoreista. Innovaatiokapasiteetin määritelmää olisi kuitenkin tar-
kennettava niin, että siinä otetaan huomioon yritysten innovaatiokapasiteetti laajem-
minkin, esimerkiksi sellaisten innovaatioiden osalta, jotka parantavat laatua tai eivät

 10
PUBLICATIONS OF THE GOVERNMENT´S ANALYSIS, ASSESSMENT AND RESEARCH ACTIVITIES 2022:1

ainakaan heti materialisoidu uusina tuotteina, sekä myös arviointi tulevasta innovaa-
tiokyvykkyydestä ja innovaatioiden laadusta. Jälkimmäinen korostuu erityisesti tuotta-
vuuskasvun kannalta keskeisten aloittavien ja nuorten innovatiivisten yritysten koh-
dalla. Niillä ei ole vielä pitkää historiaa, josta innovaatiokyvykkyyttä voitaisiin arvioida.
Yritykset voivat myös elinkaarensa aikana vahvistaa innovaatiokapasiteettiaan, muun
muassa tuotekehittäjien onnistuneilla rekrytoinneilla, jonka seurauksena innovaatioky-
vykkyyden arviointi aiemman menestyksen perusteella ei ole täysin riittävää tuen opti-
maalisen kohdentamisen näkökulmasta.

Aiempi tutkimus tarjoaa näyttöä siitä, että Suomessa t&k-tuet ovat heikentäneet yritys-
ten tuottavuuden ja markkinoilta poistumisen suhdetta ja mahdollisesti haitanneet re-
surssien uudelleenkohdentumista korkean tuottavuuden yrityksiin. Kosken ja Pajari-
sen (2015) tutkimus osoittaa, että t&k-tuet ovat vähentäneet tehottomien yritysten
poistumista markkinoilta ja hidastaneet rakennemuutosta.

Taloustieteellinen kirjallisuus tarjoaa muitakin työkaluja, jotka voisivat auttaa päätök-
sentekijöitä kohdentamaan t&k-tuet aiempaa tehokkaammin kasvun edistämiseksi.
Ns. ”kuoleman varjo” -ilmiötä tutkivat aineistoanalyysit viittaavat siihen, että markki-
noilta poistuvien yritysten tuottavuudella on taipumus laskea huomattavasti jatkaviin
yrityksiin verrattuna jo useita vuosia ennen kuin yritys poistuu markkinoilta (kts. esim.
Almus, 2004; Carreira ja Teixeira, 2011). Tällaista aineistoanalyysiä voitaisiin käyttää
markkinoilta todennäköisesti pian poistuvien yritysten havaitsemiseksi, ja kohdentaa
t&k-tuki vain sellaisille vakiintuneille toimijoille, joiden tuottavuuskehitys ei indikoi
markkinoilta poistumista. Menetelmää ei kuitenkaan voida käyttää verrattain nuorten
yritysten elinkelpoisuuden arviointiin. On myös tärkeää huomioida, että vahvassa tuo-
tekehitysvaiheessa olevien (erityisesti pienten) yritysten tuottavuus saattaa notkahtaa
väliaikaisesti, kun uusia arvonlisää tuottavia palveluita tai tavaroita ei ole vielä markki-
noilla.

AAABK-malli mahdollistaa kuitenkin vain melko yleisten yrityksiin tuottavuustason tai
panostyypin mukaan kohdentuvien politiikkakeinojen vaikuttavuuden tarkastelun. Tä-
män takia mallikehikon tarjoamat mahdollisuudet arvioida Suomessa yleisesti käytet-
tyjen hanketasolla kohdennettujen t&k-tukien optimaalisuutta ovat rajalliset. Tämä
seuraa erityisesti siitä, että hanketason t&k-tukiohjelmissa optimaalisen tukien koh-
dennuksen tulisi ottaa huomioon myös moraalikadosta (moral hazard) ja haitallisesta
valikoitumisesta (adverse selection) johtuvat tehottomuudet (Lach et al., 2021).

 11
PUBLICATIONS OF THE GOVERNMENT´S ANALYSIS, ASSESSMENT AND RESEARCH ACTIVITIES 2022:1

1 Introduction
Understanding the aggregate economic impacts of business subsidies is essential for
planning and implementing an efficient innovation policy. In addition to the direct
effects, the aggregate economic effects include the indirect effects of the policies on
other companies through spillover mechanisms (e.g. knowledge spillovers) and
market prices (e.g. labour costs). A successful subsidy policy may accelerate
economic growth and improve competitiveness. On the other hand, sub-optimally
allocated subsidies may slow down productivity growth in the worst case. Innovation
policy is likely to strengthen productivity growth when subsidies are targeted at high-
productivity companies, and they may instead have a detrimental effect on
productivity when targeted at low-productivity companies.

The externalities related to knowledge spillovers that companies do not account for in
their R&D investment decisions provide a primary rationale for public R&D subsidies.
Microeconomic empirical studies assessing the direct effects of subsidies do not
typically address the impacts of knowledge spillovers or the aggregate welfare effects
of R&D subsidies. 1 In our analysis, spillovers emerge because a firm’s R&D
productivity is positively affected by the knowledge created by the past innovation
efforts of other firms in the economy. This means that future innovations build on the
existing knowledge stock. For example, creating a new product is easier when a firm
observes existing products in the market that are produced by other firms, and making
a technological innovation requires less research input when a firm can build on
knowledge created by other companies (e.g. technological information documented in
publicly available patent filings).

Our work applies the model developed by Acemoglu et al. (2018), henceforth AAABK.
Central to the AAABK model is the ratio of high-productivity and low-productivity firms
in total output and how different policy measures affect this relationship. In the model,
the share of the skilled workforce allocated for research activities in companies with
high R&D productivity is a key channel through which the government affects
economy-wide productivity growth and welfare.

We replicate the analysis of AAABK by employing Finnish data and comparing the
effectiveness of alternative policy measures with the actual policy implementation that
was in place during the sample years. Our results for the Finnish economy are
broadly in line with the US findings. In our baseline sample, which includes all Finnish

1However, a strand of microeconometric studies aims at estimating the magnitude of
spillovers (Jaffe, Trajtenberg and Henderson, 1993; Bloom, Schankerman and Van
Reenen, 2013; Dechezleprêtre et al., 2016).

 12
PUBLICATIONS OF THE GOVERNMENT´S ANALYSIS, ASSESSMENT AND RESEARCH ACTIVITIES 2022:1

innovative firms that have at least two employees, we find that there are clear benefits
from a more active innovation policy that fosters creative destruction. For Finland, an
optimal R&D policy that supports the innovative activities of companies that have high
R&D productivity induces a 3.7% consumption equivalent welfare gain. With a general
(non-targeted) R&D incentive, welfare gains are smaller but still positive (1.8%).
These findings are, by and large, similar to qualitative conclusions on the effects of
public policies on economic growth and welfare that are presented in the original work
of Acemoglu et al. (2018) that used US data.

Acemoglu et al. (2018) employed US data from the 1980s and 1990s. We
complement their work by estimating the AAABK model for more recent years: 2000–
2016. Our results add to the literature by providing evidence on the aggregate
effectiveness of innovation policies in this more recent period of slower economic
growth. We also complement the literature by providing new perspectives with the
help of the Finnish high-quality register data: our analysis employs comprehensive
firm-level datasets and linked employer-employee datasets that cover the universe of
active Finnish companies. We amend this data with an exhaustive, annual firm-level
R&D investment panel, covering around 99% of gross R&D in the economy.

A key advantage of our dataset is that, unlike the data employed by AAABK, it also
has good coverage of small companies. We analyse how the model responds to the
inclusion of data concerning micro-sized firms that are not typically available in R&D
datasets. Moreover, our dataset provides information on labour inputs at a very fine
level. This allows us to measure R&D labour inputs and fixed operative labour inputs
at the firm level and to construct measures for the skilled workers in the economy
based on detailed occupation and educational degree categories. Furthermore, we
provide results for some new policy applications of the AAABK model that can be
particularly relevant for smaller economies, for instance, we provide an analysis of an
immigration policy that increases the supply of skilled labour in the economy.

The effectiveness of business subsidies has previously been studied with Finnish
data, mainly concerning their direct effects (see, e.g. Fornaro et al., 2020, for a
literature review). Various micro-level studies employing data from different countries
provide evidence on the direct impacts of R&D subsidies (see, e.g. Hyytinen and
Toivanen, 2005; Koski and Pajarinen, 2013, 2015; Einiö, 2014; Bronzini and Iachini,
2014; Howell, 2017) or R&D tax incentives (e.g. Rao, 2016; Dechezleprêtre et al.,
2016; Agrawal et al., 2020; Akcigit et al., 2021a) on companies’ innovation activities
and other economic performance measures, such as productivity. Studies providing
the most reliable estimates of the causal impacts of these policies have utilised quasi-
experimental settings in which the control group is plausibly similar to the subsidised
firms in terms of observed and unobserved background characteristics. In such

 13
PUBLICATIONS OF THE GOVERNMENT´S ANALYSIS, ASSESSMENT AND RESEARCH ACTIVITIES 2022:1

studies, the effects of support policies are estimated as the performance differences
between these groups.

In recent years, macroeconomic analysis of the aggregate impacts of business
support and, in particular, innovation policies, has expanded rapidly. The AAABK
model employed in our study is one important recent contribution in this field. Another
recent study by Ackigit et al. (2021b) emphasised the design of mechanisms for
optimally allocating fiscal incentives for R&D. Their work analysed a realistic setting
where the government does not have perfect information about the R&D effort of
firms. They show that a Heathcote–Storesletten–Violante (HSV) type of subsidy
combined with an HSV type of profit tax performs almost as well as the optimal policy.
Atkenson and Burnstein (2019) constructed a simple first-order approximation of the
impacts of a policy-induced change in innovation on aggregate productivity by
employing a model that nests features from several canonical growth models. Takalo
et al. (2017) built a structural model that allows for externalities, financial market
imperfections and limited R&D participation. Their welfare analysis of R&D policies
employed project-level data from Finland. Their findings indicate that R&D subsidy
policies do not significantly improve welfare, although tax credits and subsidies
increase R&D investments compared with laissez-faire markets without any R&D
subsidies.

Our analysis is also related to work examining the consequences of other types of
innovation policies. A recent study by Akcigit et al. (2018) built a general equilibrium
framework of endogenous growth and trade for an open economy in order to evaluate
the effectiveness of innovation and trade policies on economic growth and welfare. In
their model, firms’ motivation for innovation arises from defensive and expansionary
strategies and domestic and international business-stealing effects. Their dynamic
theoretical analysis indicates that reduced trade barriers increase innovation through
stronger incentives for defensive and expansionary R&D due to increased foreign
competition. Their data provide evidence that the introduction of R&D subsidies was
an efficient innovation policy, restoring the competitiveness of US firms and creating
positive longer-term welfare effects.

In the literature concerning the Finnish economy, a few studies have used a model-
based approach (Maliranta and Määttänen, 2015) or productivity decomposition
analysis (see, e.g. Hyytinen and Maliranta, 2013) to examine the reallocation of
factors of production.

Our analysis is also linked to literature examining the relationship between creative
destruction and economic growth. Garcia-Macia et al. (2019) argued that, for
determining the welfare effects of innovation policies, it is essential to understand the
extent to which growth is generated by creative destruction by entrants as opposed to

 14
PUBLICATIONS OF THE GOVERNMENT´S ANALYSIS, ASSESSMENT AND RESEARCH ACTIVITIES 2022:1

the incumbents’ improvements of their existing lines of business and new lines of
business. They build a model in which aggregate productivity growth is generated via
entrants’ innovation and incumbents’ improvements of their own products and
innovation to generate products new to the firm that may either be ‘stolen’ from other
companies or be new to the markets. Their data analysis indicates that incumbents’
quality improvements of their own products form the most significant source of growth,
while creative destruction accounts for a relatively low share of aggregate productivity
growth.

The rest of the report is organised as follows. Section 2 presents the theoretical
model. Section 3 first introduces the data used in the empirical analysis and then
presents the estimation results concerning the parameters of the model. Section 4
reports the results for policy experiments based on the estimated model and further
explores the impacts of various policy experiments on growth and welfare in the
Finnish context. Section 5 provides some extensions to the analysis. Section 6
discusses the policy implications of our findings.

 15
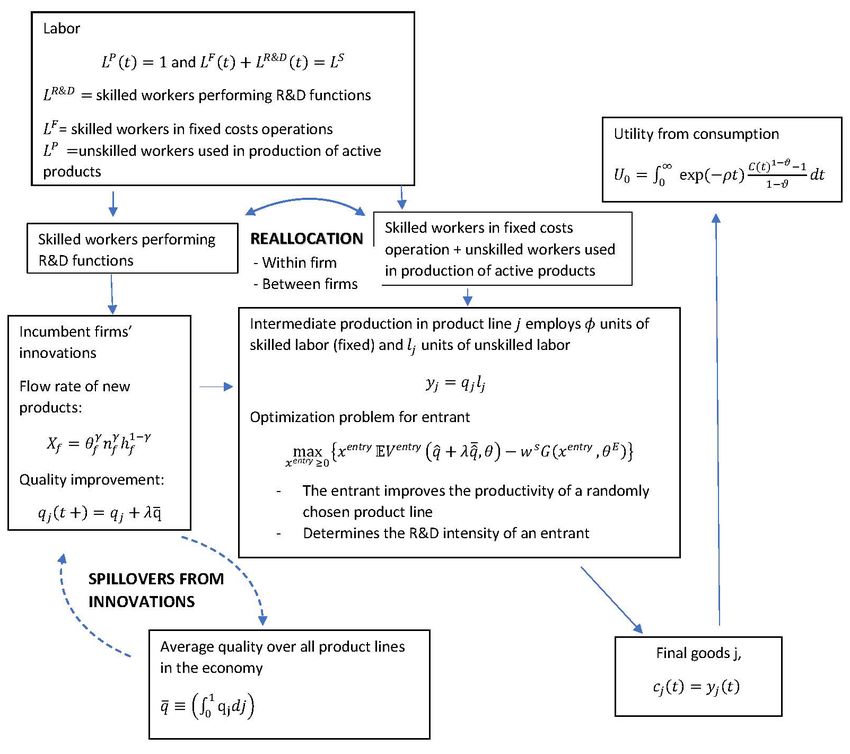
PUBLICATIONS OF THE GOVERNMENT´S ANALYSIS, ASSESSMENT AND RESEARCH ACTIVITIES 2022:1

2 Theoretical model
In this section, we discuss the key equations and premises of the AAABK model that
is then used to assess the effects of innovation subsides and taxes on the Finnish
economic growth and welfare. Most of the analysis follows the structure presented in
AAABK but we stress the model features that are important to our analysis. The
model is characterised in Figure 2.1.

Figure 2.1. The model

The key market failure in the model is related to skilled labour. Because firms build on the
quality level of existing leader firms, R&D creates positive spillovers onto other firms.
However, firms do not internalise these spillover effects when considering their R&D
effort. This implicates that there will be underinvestment in R&D and thus lower than the
socially optimal demand for the skilled labour that is needed in the production of R&D.

 16
PUBLICATIONS OF THE GOVERNMENT´S ANALYSIS, ASSESSMENT AND RESEARCH ACTIVITIES 2022:1

Preferences and Final Good Technology

An important feature of the model is that there is insufficient R&D since firms do not
internalise the full value of new innovations. This is typical in models of endogenous
technological change. In this model, this feature is captured with future innovations
building on the current knowledge stock, implying that current innovations create a
positive spillover onto future innovators, as described in AAABK. The resulting
underinvestment leads to the too little employment of skilled workers in R&D, on one
hand, and, to too much employment in operations on the other hand.

The economy is in continuous time where a representative household has constant
relative risk aversion (CRRA) preferences. The function describing household
preferences can be found in Appendix 1.

The firms in the model economy have different product lines to choose from, and their
outputs are then combined into an aggregate final good.

The idea of product lines is an important element in the model since it expresses firms
as actors making decisions about retaining different product lines while allowing
creative destruction at the product level at the same time. As a consequence, not all
product lines are active at each point in time.

AAABK assumes that the model economy is closed. In this report, for reasons of
keeping the model tractable and simple enough, we make the same assumption for
Finland. This assumption is not as restrictive as it may first sound, even for a small
open economy like that of Finland. Competition between domestic firms affects firms
in a similar way to competition from abroad, that is to say, the basic mechanisms in
both types of economies – open or closed – are the same.

The open economy aspect could still, of course, indirectly affect our results via
general equilibrium effects. However, we abstract from the indirect effects in this
report, which implies that innovation policies have no effects on the current account
and foreign (direct) investments. In that sense, our model misses some aspects of the
Finnish economy. Our aim is, however, to tackle these issues in future research; more
specifically, our aim is to develop a model that contains these features of the Finnish
economy as well.

R&D and production costs are understood in terms of labour, so ( ) = ( ),
where ( ) is the amount of product j produced at time t. This implies that aggregate
output equals aggregate consumption.

 17
PUBLICATIONS OF THE GOVERNMENT´S ANALYSIS, ASSESSMENT AND RESEARCH ACTIVITIES 2022:1

Following AAABK, there are two types of labour in the economy: skilled and unskilled
labour. Unskilled workers are used in the production of the active products (total
labour demand, ), while skilled workers perform R&D functions (total labour
demand, & ) and are also employed in order to maintain the (fixed) costs of
operations, such as management work, back-office function work and other non-
production work (total labour demand, ). We assume that the operation of each
product requires ϕ > 0 units of skilled labour.

Formally, the representative household has a fixed skilled labour supply of measure
 and an unskilled labour supply of measure 1. Both groups’ labour supply is
inelastic. The labour market clears so that total labour demand equates labour supply
for each type of labour, thus:

 ( ) = 1 and ( ) + & ( ) = ( ). (1)

The representative household maximises its utility, subject to the budget constraint:

 ̇( ) + ( ) ≤ ( ) ( ) + ( ) + ( ). (2)

 ∞
Also, the no-Ponzi condition holds so we can write ∫0 (− ( ) ) ( ) ≥ 0, where
 ( ) are the assets of the representative household, ( ) is the equilibrium interest
rate on assets, and ( ) and ( ) are skilled and unskilled wages, respectively. We
follow AAABK and focus on stationary equilibria, which also allows us to drop the time
subscripts when that is useful for characterisation.

Intermediate Good Production and Firms

The intermediate good (product) is produced by the monopolist who has the leading-
edge technology in that product line. The monopolist can own multiple product lines
and can produce multiple intermediate goods simultaneously. There are two different
sets of firms: (i) a set of active firms that owns at least one product line and (ii) a set
of potential entrants of measure one that do not currently own any product line but
invest in R&D for innovation.

Following AAABK, let us denote by the set of active product lines wherein firm
has the leading-edge technology and chooses to produce it, and denotes the
cardinality of this set. Firms have different innovative capacities. Upon successful

 18
PUBLICATIONS OF THE GOVERNMENT´S ANALYSIS, ASSESSMENT AND RESEARCH ACTIVITIES 2022:1

entry into the economy, each firm draws its type ∈ { ℎ , }, which corresponds to
one of two possible types: high (h) and low (l) productivity. We write:

 Pr( = ℎ ) = and Pr( = ) = 1 − , (3)

where ∈ (0,1) and ℎ > > 0. It is also assumed that high-type firms transition to
low-type at the exogenous flow rate > 0. This transition effect is complemented with
another exogenous shock: each firm is subject to an exogenous destructive shock at
the rate . If a firm is hit by this shock, its value becomes 0 and it exits the economy.

Innovation by incumbents is approached as follows. Firm of type hires ℎ skilled
workers for creating a new product, therefore adding one more product into its
portfolio of products at the flow rate:

 1−
 = ℎ , (4)

where ∈ (0,1) and is the number of product lines that firm owns in total.

It is assumed that firms do not know ex ante in which particular product line they will
innovate. As a result, their expected return to R&D is the expected value across all
product lines: ∈ (0,1).

As a technical assumption, prices after entry are defined by Bertrand competition,
implying that the more productive firm will be able to make any sales and profits, and
thus only this firm will pay a (small) cost > 0 and enter the market. Hence, in
equilibrium, the firm that has the leading-edge technology can charge the monopoly
price independently of the productivity gap between itself and the next best
technology.

 19
PUBLICATIONS OF THE GOVERNMENT´S ANALYSIS, ASSESSMENT AND RESEARCH ACTIVITIES 2022:1 Entry and Exit The firm with the leading-edge technology can act as a monopolist. Each entrant to the market has access to R&D technology ( , ); it specifies the number of skilled workers necessary for generating at an innovation rate of > 0. Thus, an entrant aiming at achieving an innovation rate of would need to hire ℎentry = � entry , � (5) number of skilled workers. As explained in AAABK, this implies that a potential entrant has access to the same R&D technology that an incumbent with the innovative capacity and a single active product would have. The optimisation problem for entrants can be stated as: max � entry entry ( � + �� , ) − � entry , ��. (6) entry ≥0 Equation (6) implies that the entrant improves the productivity of a randomly chosen product line by ��� , and at this point, the initial type of a firm, ∈ ( ℎ , ), is also realised. The expected value of entry is entry (. ). Solving Equation (6) determines the R&D intensity of an entrant. Given that there is a unit measure of potential entrants, is equal to the total entry flow rate. In the model, the exit of products and firms has three causes: (i) There is an exogenous destructive shock, given by > 0, which causes the firm to exit and shut down all its product lines. (ii) There is creative destruction because of innovation by other firms. This re- places the leading-edge technology in a particular product line. (iii) Firms voluntarily shut down some product lines because they are no longer profitable enough in regard to the fixed cost of operation. As a consequence of the first and third factors, the measure of inactive product lines will be positive. 20
PUBLICATIONS OF THE GOVERNMENT´S ANALYSIS, ASSESSMENT AND RESEARCH ACTIVITIES 2022:1

Value Functions

All the growing variables are normalised with a productivity index in order to keep the
stationary equilibrium values constant. The average creative destruction rate is
endogenously determined in equilibrium, in contrast with, for instance, the exogenous
destructive shock defined earlier. The stationary equilibrium value functions for both
low-type and high-type firms can be found in Appendix 1.

Aggregate Growth and Welfare

Aggregate output is equal to the productivity index, hence we can write = = ,
where is the productivity index of the economy. Economic growth is linked to the
frequency and size of innovations. One of the key advantages of using this kind of
model is that it allows us to analyse the dynamic effects of innovation subsidies and
taxes while also allowing heterogeneity between firms’ innovation capabilities. It also
enables a reasonable welfare analysis of different innovation policies that are chosen
by the government.

When comparing the welfare in two economies with different policies (say, with
Subsidy Policies 1 and 2) and the resulting growth rates (g(1) and g(2)) with initial
consumption levels (C0(1) and C0(2)), consumption-equivalent changes in welfare
need to be computed. This is done by calculating the fraction of initial consumption
that will ensure the same discounted utility with the new growth rate as that gained
with the initial allocation.

Solving the Model

The model is solved computationally as a fixed point of a vector of six aggregate
equilibrium variables: the equilibrium skilled wage rate, the average innovation step
size in relative productivity terms, the shares of product lines operated by high and
low type firms, and the expected franchise values of upgraded product lines that is, a
 � , Φℎ , Φ , �� , [Υℎ � � + �� �, [Υ � � + �� �), respectively. It turns out that the
vector (
vector describes the equilibrium innovation decisions (the cost of innovation and its
expected returns). In practice, the solution is obtained iteratively by using an initial
conjecture vector and then updating the vector until the conjecture is verified following
AAABK. This procedure yields us a fixed point and also generates the stationary
equilibrium distributions of relative productivities.

 21
PUBLICATIONS OF THE GOVERNMENT´S ANALYSIS, ASSESSMENT AND RESEARCH ACTIVITIES 2022:1

3 Estimation

3.1 Data
The basis of our dataset is the Business Register (BR) compiled by Statistics Finland
(SF). It covers all enterprises and corporations with value added tax liability or paid
employees, except for very small companies with low labour input, turnover and total
assets. 2 The key BR variable in our empirical analysis is turnover, for which the
original source is the administrative tax registers. We next describe other key
variables used in the empirical analysis.

Employment. We draw information on full-time equivalent employment from the BR.
This variable is based on surveys conducted by SF. The surveys cover all multi-
establishment firms with over five employees and single-establishment firms with over
ten employees. In addition, a random sample of companies falling below these
thresholds is surveyed. For companies that are not covered by these enquiries, full-
time equivalent employment is estimated by SF using operating data and an industry
code.

The number of individuals, counted by education and occupation. We calculate the
annual firm-level number of personnel by employing the linked employer–employee
data (i.e., the FLEED data) that provide employer company codes for each employee.
We use the employer company code associated with the longest job spell of an
employee in the last week of the year. These data cover the whole working-age
population. To calculate the number of individuals according to their educational
attainment and occupation, we use the FLEED code for the level of their highest
degree (which has full coverage) and an occupation code (which covers employed
individuals and is available for the year 2000 and the years 2004–2016). We
aggregate the number of individuals in these categories by company and year. We
define highly educated individuals as those who have university/college degrees and
non-production workers as those who are managers, professionals, assistant
professionals or technicians. The FLEED is also used to calculate the size of the
workforce in managerial occupations or with a university/college degree in STEM (i.e.,

2 The FRD sample frame excludes enterprises that (1) have been active for less than
half a year, (2) have full-time equivalent employment below half worker years, (3) have
balance sheet of less than 170 000 euros and (4) turnover below an annually specified
limit (for example, below 11 016 euros in 2014).

 22
PUBLICATIONS OF THE GOVERNMENT´S ANALYSIS, ASSESSMENT AND RESEARCH ACTIVITIES 2022:1

science, technology, engineering and mathematics) fields. This measure mimics the
AAABK definition of skilled individuals in the economy.

R&D expenditure and innovative status. Information on R&D expenditure is drawn
from the annual R&D Survey (RDS) of SF. The RDS comprises a panel of R&D active
firms who have reported R&D in the previous year’s survey, have significant R&D
expenditure in the previous year’s SF Financial Statement survey or are recipients of
public R&D funding. These firms cover around 99% of gross business R&D. Each
year, the panel is refreshed with a survey of firms that are not included in it. 3 For firms
with missing R&D values, we amend these data with predicted R&D expenditures
based on annual patent counts and industry. This has little impact on the number of
firms with positive R&D, which was expected due to the high private R&D sector
coverage of the RDS. In our baseline specification, we follow AAABK and define a
firm to be innovative in year if it has positive R&D expenditure or a positive patent
count in any year within a five-year window (that is, from − 2 to + 2).

Operative status and exit. We define a firm to be operative if it has positive BR
turnover, positive BR employment or positive FLEED employment (for operative
status, we examine both whether the firm has any employees in the last week of the
year and whether the longest job spell of a worker is associated with the firm). A firm
is defined as having exited in its last operative year (we restrict the analysis window
so that operative status is observed one year after its end).

The fixed-labour-to-R&D-labour ratio. We calculate the ratio between fixed (operative)
labour and R&D labour by combining information on worker-level occupational and
educational categories at a fine level from the linked employer–employee data,
aggregated by firm, and from firm-level information on the number of R&D workers
counted by educational attainment from the RDS. In our primary specification, the
ratio is the number of managers divided by the number of highly educated R&D
workers. We also experiment with other combinations of the operative worker and
R&D worker definitions, including wider non-production worker categories, highly
educated STEM workers and all R&D workers. These alternative specifications yield

3 Of enterprises that are not in the baseline RDS panel frame, the survey covers: (1) all

enterprises with more than 100 employees, (2) a stratified random sample organised
by industry and the size of enterprises that have 10–99 employees and (3) for enter-
prises with fewer than 10 employees, companies that have received public R&D fund-
ing in previous years. SF imputes missing responses based on the previous year’s re-
sponses when the enterprise’s R&D expenditure has been at least 170 000 euros. For
these companies, partial non-responses are imputed by employing the ratio of the sum
of the operating expenditure and the sum of salary expenditure. In the most common
case of a partial non-respondent, the company provides information on R&D salary ex-
penses but not on operating expenses.

 23
PUBLICATIONS OF THE GOVERNMENT´S ANALYSIS, ASSESSMENT AND RESEARCH ACTIVITIES 2022:1

similar results to our preferred specification, although the policy impacts based on our
preferred specification provide slightly smaller impact estimates related to innovation
policies.

We follow AAABK and define small firms as those with less than 200 employees and
young firms as those which are less than 10 years old. We define moments related to
exit, growth and age-size distribution as annual changes in the panel. Turnover and
R&D are deflated using the consumer price index.

Sample Selection

Our analysis includes the year 2000 through to the year 2016 for which the key
variables are available. We follow AAABK and focus on operative manufacturing firms
that are continuously innovative. A firm is defined to be continuously innovative in
year if it is observed to be innovative in that year and in year − 5 or + 5. In
principle, we could base our definition of continuously innovative firms on a smaller or
wider time window because we observe operating and R&D data annually. 4 In our
baseline model, we employ a five-year interval in order to have comparable results
with those reported by AAABK. We also provide results for an alternative definition
based on a two-year interval and for all operative firms (including firms that are not
innovative).

We provide results from different samples in which we vary factors that may affect our
estimation. One open question is, ’How much emphasis should be given to very small
firms in the sample?’ In our baseline sample, we only leave out firms that employ one
person.

We then provide alternatives in which we focus on firms that have at least five
employees. Moreover, we change the definition criterion for small firms from 200
employees to 110 employees, which provides a more balanced distribution of small
and large firms in the Finnish dataset. We also examine the robustness of our
analysis when we weight moments by firm employment. Overall, these alternative
specifications provide broadly similar conclusions, although there are some
differences that we discuss in more detail below.

4 Operating data in AAABK is from a survey that is conducted every five years which

dictates their choice of the time interval.

 24
You can also read