INFLUENCE OF THE ANTENNA ORIENTATION ON WIFI-BASED FALL DETECTION SYSTEMS
←
→
Page content transcription
If your browser does not render page correctly, please read the page content below
sensors
Article
Influence of the Antenna Orientation on WiFi-Based Fall
Detection Systems
Jorge D. Cardenas † , Carlos A. Gutierrez *,† and Ruth Aguilar-Ponce †

                                          Facultad de Ciencias, Universidad Autónoma de San Luis Potosí, Av. Chapultepec 1570, Privadas del Pedregal,
                                          San Luis Potosí C.P. 78295, Mexico; j.cardenas@ieee.org (J.D.C.); ruth.aguilar@ieee.org (R.A.-P.)
                                          * Correspondence: cagutierrez@ieee.org; Tel.: +52-(444)-8-262-300 (ext. 5670)
                                          † These authors contributed equally to this work.

                                          Abstract: The growing elderly population living independently demands remote systems for health
                                          monitoring. Falls are considered recurring fatal events and therefore have become a global health
                                          problem. Fall detection systems based on WiFi radio frequency signals still have limitations due to the
                                          difficulty of differentiating the features of a fall from other similar activities. Additionally, the antenna
                                          orientation has not been taking into account as an influencing factor of classification performance.
                                          Therefore, we present in this paper an analysis of the classification performance in relation to the
                                          antenna orientation and the effects related to polarization and radiation pattern. Furthermore, the
                                          implementation of a device-free fall detection platform to collect empirical data on falls is shown.
                                          The platform measures the Doppler spectrum of a probe signal to extract the Doppler signatures
                                          generated by human movement and whose features can be used to identify falling events. The system
                                          explores two antenna polarization: horizontal and vertical. The accuracy reached by horizontal
                                polarization is 92% with a false negative rate of 8%. Vertical polarization achieved 50% accuracy and

                                          false negatives rate.
Citation: Cardenas, J.D.; Gutierrez,
C.A.; Aguilar-Ponce, R. Influence of      Keywords: fall detection; device-free; Doppler signatures; polarization; WiFi
the Antenna Orientation on
WiFi-Based Fall Detection Systems.
Sensors 2021, 21, 5121. https://
doi.org/10.3390/s21155121
                                          1. Introduction
Academic Editors: Irene Cheng and
                                               Improvement on quality of life has resulted in an increased life expectancy. In 2019,
Troy McDaniel
                                          the population over 65 years had a 3% growth compared to 1990. Projected population
                                          expansion indicates that elderly people will represent 16% of the world population by
Received: 28 June 2021                    2050 [1]. Much of this sector of society tend to live independently. For this reason, it
Accepted: 23 July 2021                    is necessary to provide systems for remote healthcare and monitoring. Several systems
Published: 28 July 2021                   have been developed for this purpose using well-established sensing techniques, such as
                                          acoustic sensors, video cameras, vibration sensors, and wearable devices [2–6]. However,
Publisher’s Note: MDPI stays neutral      an innovative technique has emerged in the last years: device-free monitoring based
with regard to jurisdictional claims in   on radio-frequency (RF) signals. An RF signal shows fluctuations at the receiver due to
published maps and institutional affil-   absorption and reflections by moving people wandering in the proximity of the transmitting
iations.                                  and receiving antennas [7,8]. These fluctuations can be characterized to identify activities of
                                          daily living (ADL) or to detect important sporadic events, such as the presence of burglars
                                          or the occurrence of accidents. RF monitoring systems are noninvasive because users do
                                          not need to carry a sensor and they also preserve user privacy since no image is recorded.
Copyright: © 2021 by the authors.              According to the World Health Organization, 37.3 million elderly people require
Licensee MDPI, Basel, Switzerland.        medical attention each year for injuries caused by falls [9]. In contrast to ADL, like walking,
This article is an open access article    running, or going up and downstairs, falls are rare or transient events. This implies that
distributed under the terms and           the detection of these events should be approached from a different perspective, seeking to
conditions of the Creative Commons        provide prompt medical attention when a fall occurs.
Attribution (CC BY) license (https://          In device-free monitoring, the presence of WiFi access points (APs) in indoor envi-
creativecommons.org/licenses/by/          ronments has been used to collect and classify RF signals [10,11]. Despite recent advances
4.0/).

Sensors 2021, 21, 5121. https://doi.org/10.3390/s21155121                                                    https://www.mdpi.com/journal/sensors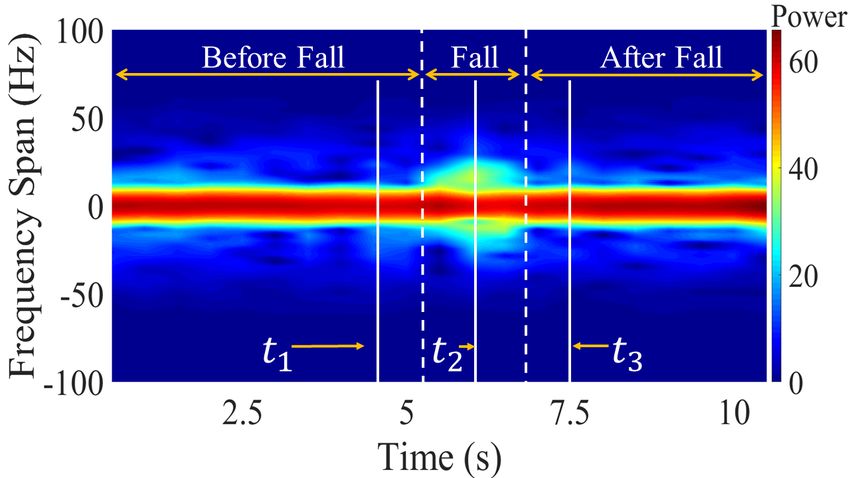
Sensors 2021, 21, 5121                                                                                           2 of 20

                         in the design of WiFi-based fall detection systems, most of the work has focused on de-
                         veloping algorithms for feature extraction and classification. Previous research has not
                         addressed the impact of some important physical layer factors on the system’s sensing
                         capabilities, such as the variations of the antenna response with spatial orientation. These
                         variations stem from the angular dependence of the antenna’s radiation pattern, and also
                         from the polarization mismatch between the transmitter (TX ) and the receiver (R X ) due
                         to channel depolarization effects [12]. To the best of the authors knowledge, a detailed
                         investigation of the impact of the radiation pattern’s anisotropy and antenna polarization
                         mismatch on the performance of WiFi-based fall detection systems has not been conducted
                         so far. However, in [13], Wang et al. analyzed the influence of antenna height on the
                         system’s performance, and they concluded that the detection rate improves by raising the
                         antenna height. In [14], a fall detection system was presented taking into consideration the
                         polarization of the received signal. Nonetheless, the system was developed using Doppler
                         radars, and the results presented there cannot be extrapolated directly to WiFi-based sys-
                         tems. A preliminary analysis of the effects of antenna orientation in the performance of fall
                         detection system built around the Doppler signatures of WiFi signals was presented in [15].
                         There, it was empirically demonstrated that fall detection platforms are highly sensitive
                         to antenna orientation. However, the analysis presented in [15] needs to be revisited by
                         considering a complete implementation of feature extraction and classification algorithms
                         to determine the accuracy of the system.
                               This paper presents a systematic analysis of the effects of the antenna orientation in a
                         fall detection system based on the Doppler signatures of WiFi signals. The results of this
                         work are intended to help researchers to determine the best antenna orientation, and to
                         promote the design multi-polarized antennas that improve the system’s sensing capabili-
                         ties without increasing the number of sensors (antennas) or the classification algorithms’
                         complexity. To assess these effects, an experimental fall detection platform is presented that
                         replicates the operating conditions of a system based on the transmission of WiFi-signals.
                         This experimental platform allows us to compute the Doppler signatures of the transmitted
                         signal so that the features of the signal’s variations in presence of human movements can be
                         identified and classified. A series of experiments were conducted to gather empirical data
                         about the Doppler signatures produced by falls from a three-step ladder. The experiment
                         is comprised of two different antenna orientation configurations: horizontal-to-horizontal
                         (HH) and vertical-to-vertical (VV). The detection accuracy obtained for the HH configura-
                         tion amounts to a 92% with a false negative rate of 8%. The VV configuration produced a
                         50% accuracy and a 50% false negatives rate. The obtained results provide evidence of the
                         importance of considering the effects of antenna orientation for the design of WiFi-based
                         fall detection systems.
                               The remainder of the paper has the following organization. Section 2 provides a review
                         of related work. Section 3 details the mains components of a WiFi-based fall detection
                         system. The mathematical model of the probe signal is presented in Section 4. In Section 5
                         the implementation of our experimental platform is described. Section 6 addresses the
                         feature extraction and event classification algorithms. The results obtained are presented
                         in Section 7. In Section 8 the results are discussed. Finally, the conclusions are given in
                         Section 9.

                         2. Related Work
                               There are different sensing techniques that can be used to design and develop fall
                         detection systems. Table 1 shows an overview of some of the most common techniques and
                         their characteristics. Vision-based systems comprise principally digital image processing [4].
                         The optimization of this processing can be affected by the resolution of the images that are
                         collected by the video recording equipment. This implies that the use of high resolution
                         equipment is necessary, which can be expensive. Furthermore, the feature extraction
                         process is essential for vision-based fall detection systems. First, a simple model of a
                         human body needs to be obtained, encompassing only head, torso and legs. However,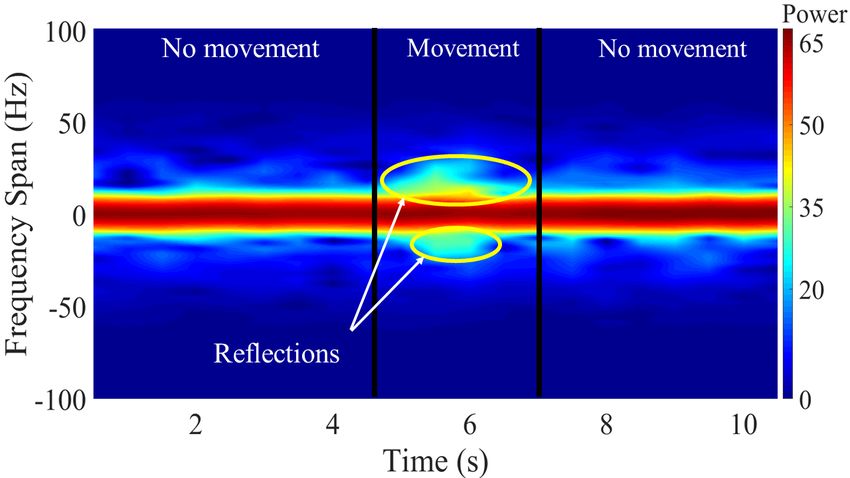
Sensors 2021, 21, 5121                                                                                              3 of 20

                         partial occlusion of a user affects the construction of such model. Additionally, camera
                         projection artifacts must be considered to avoid a misdetection. Then a description of
                         movement of this human body model is used for analysis. Feature analysis can be static
                         or dynamic. In the static analysis, a morphological model of the behavior of the fall is
                         made [16]. In the case of dynamic analysis, the movement change determines the presence
                         of abnormal events in the general movements. This analysis allows one to identify the
                         speed and direction of movement of the human body. In this way, the trajectories can be
                         used to detect the behavior of a fall. Occlusions in the target’s vision also make this process
                         difficult, making necessary to implement complex classification algorithms. Therefore,
                         vision-based systems present drawbacks such as highly complex analysis algorithms, which
                         require high performance computer system and a line of sight (LOS) to user compromising
                         their privacy.
                               Wearable devices use accelerometers, gyroscopes, magnetometers and tilt sensors
                         embedded in general-purpose devices that can be carried by people. These sensors operate
                         at different frequencies, which can vary the sampling rate of the system. For this reason,
                         it is necessary to determine the rate at which the falling event can be registered and
                         select the sensor that best suits these conditions. However, the placement of the sensor
                         on the human body directly affects the detection performance of the system [5,17,18].
                         Additionally, wearable sensors can cause discomfort for users who are not accustomed to
                         wearing such devices.

                         Table 1. Approaches to fall detection systems.

                             Sensing Technique              Article and Year                  Characteristics
                                                            Zhang [4] (2020)        Needs to have a direct line of sight
                                Vision-Based
                                                          Withanage [19] (2016)     with the target, privacy concerns.
                                                            Hauth [5] (2021)
                                                                                    The device has to be worn by the
                              Wearable-Based              Zurbuchen [18] (2021)
                                                                                    user at all times.
                                                           Kerdjidj [20] (2020)
                                                             Liu [3] (2019)         Requires specialized and expensive
                            Environment-Based
                                                             Mun [2] (2015)         implementation.
                                                           Y. Wang [13] (2017)      Provides data without the need to
                           Radio Frequency-Based           Huang [10] (2019)        wear a device, it can be adapted to
                                                           W. Wang [11] (2017)      existing hardware.

                               On the other hand, environment-based systems use sensors embedded in the indoor
                         surroundings. These sensors can be acoustic, where the transmission of sound waves is
                         affected by changes in trajectory caused by obstacles in the environment [2]. In this way,
                         changes in the trajectory are recorded and characterized to determine if a fall occurred.
                         However, due to the nature of sound waves, the transmission can be degraded by the
                         multi-path effect. Therefore, monitoring more than one indoor environment requires
                         the implementation of a large number of sensors. The measurement of floor vibration
                         signals through sensors such as accelerometers or piezoelectrics is another alternative for
                         environment-based systems. Sensors mounted on the floor structure collect the variations
                         in vibration induced by the movement of the human body to classify them. However,
                         environment-based systems tend to be expensive due to their exhaustive implementation
                         and the large number of sensors employed.
                               An alternative to all these approaches are systems based on radio frequency signals.
                         Some proposals for the design of fall detection systems are based on Doppler radars to
                         measure and analyze changes in signals caused by human movement [14]. However,
                         the cost and complexity of such specialized equipment make the deployment of these
                         monitoring systems an expensive solution. Other proposals capitalize on the ubiquity of
                         wireless local area networks [11,21,22]. The underlying idea of these fall detection systems
                         is to employ the signals transmitted by commercial WiFi APs as probe signals to scan the
                         environment and detect anomalies in the received power that could be produced by a fall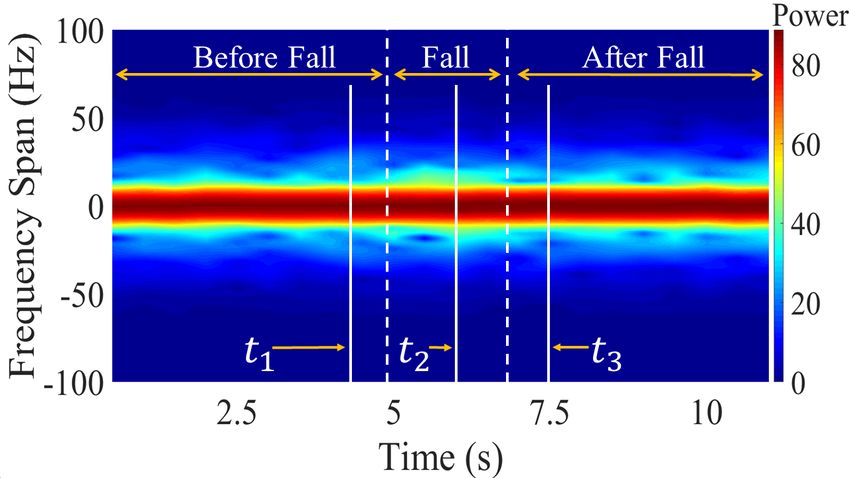
Sensors 2021, 21, 5121                                                                                            4 of 20

                         event. The attributes of the received signal that can be considered for anomaly detection
                         are the received signal strength indicator (RSSI) [8], the channel state information n, and
                         the Doppler spectral signatures [23].
                              A RF monitoring system based on the RSSI of WiFi signals was presented in [8].
                         This system analyzes the received signal to identify irregularities in the RSSI that could
                         be produced by human movement. A limitation of this approach is that the system’s
                         performance is sensible to changes in the environment’s characteristics. A fall detection
                         system that considers the CSI of WiFi signals, and which is referred to as WiFall, was
                         presented in [13]. In its simplest form (WiFall-one link), the system is composed of a single
                         transmitting antenna and a single receiving antenna. The results presented in [13] show
                         that WiFall-one link is capable of detecting falls, but with a rather high false alarm rate
                         of 16%. This problem is caused by the limited angle of observation of the single antenna
                         configuration [24]. To reduce the false alarm rate, the authors proposed an enhanced
                         version (WiFall-two links) that incorporates a second receiving antenna as a means to
                         reduce ambiguities due to the angle of observation. A similar system, referred to as Fall
                         Sense, was presented in [10]. The CSI is also considered in that paper as the detection
                         parameter, but a third receiving antenna was incorporated to increase detection accuracy
                         and further reduce the percentage of false alarms. Nevertheless, increasing the number
                         of antennas adds complexity to the overall detection system. A proof-of-concept of a
                         device-free fall detection system based on the Doppler signatures of WiFi signals was
                         presented in [23]. The results obtained in that paper suggest that such spectral signatures
                         allow differentiation between activities and falling events.

                         3. General Structure of a WiFi-Based Fall Detection System
                               Fall detection by RF monitoring comprises three phases: sensing, recognition, and
                         decision. Figure 1 shows a block diagram of these three stages for a system based on the
                         Doppler signatures of WiFi signals. In the sensing phase, a probe signal is radiated by
                         the transmitting antenna. This signal is not intended to carry data, it is simply a means
                         to interact—by the mechanism of electromagnetic wave reflection—with the objects in
                         the vicinity of the receiving antenna. If the probe signal impinges on a moving body, e.g.,
                         a falling person, then the reflected signal will suffer an apparent frequency shift due to
                         the Doppler effect [23]. This frequency shift depends on the speed and acceleration of
                         the moving/falling body and it therefore produces a spectral (Doppler) signature whose
                         features can be used to detect a fall event. The Doppler signature of the received probe
                         signal can be computed, e.g., by following the spectrogram concept [25]. Spectrograms
                         provide information about the spectral density of a signal within a short observation time
                         interval. In fall detection, the signals are time-varying and non-stationary. Therefore,
                         spectrograms are excellent tools to analyze such signals.

                         Figure 1. General diagram of a fall detection system based on radio frequency signals.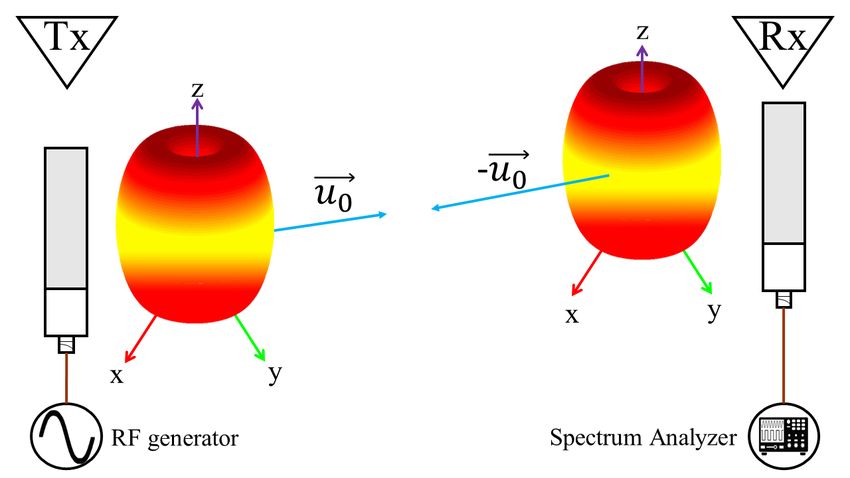
Sensors 2021, 21, 5121                                                                                               5 of 20

                               Figure 2 shows an example of an empirical spectrogram of a constant-wave (CW)
                         probe signal during a fall event. This figure shows static scenarios within the first 4.5 s and
                         the last 3 s where no human movement is observed. The power density of the received
                         signal is therefore concentrated in the origin. On the other hand, a fall occurs during a
                         time interval spanning 4.5 to 7 s. The acceleration of the falling body produces a frequency
                         drift of received power. Such a frequency drift can be analyzed to identify characteristic
                         patterns of fall events. The example shown in Figure 2 considers motion of a single body.
                         This scenario is relevant for fall detection of elderly people living independently, as these
                         individuals have no one around and therefore rely on an automatic wireless monitoring
                         system to get assistance in case of a fall. The single-person scenario shown in Figure 2 may
                         not be relevant for ADL applications, in which several persons, each producing a different
                         Doppler signature, could be around the receiving antenna. For these latter applications,
                         the goal of the system is to isolate and identify the activities realized by each person.

                         Figure 2. Spectrogram during a falling event.

                               Classification stage is performed after acquiring a spectrogram. In this stage, the
                         signals are classified based on the information extracted from their features. The feature
                         extraction is based on finding the dataset that allows quantitatively differentiating if the sig-
                         nals correspond to a falling event or other activities. A dimensionality-reduction technique
                         widely used for feature extraction is Principal Component Analysis (PCA). Spectrograms
                         are high-dimensional data that can be further explored into a lower dimensional space that
                         retains most of the information. Therefore, PCA is applied to the acquired spectrogram.
                         The extracted principal components can be used by classification algorithms as features
                         to recognize falling events. However, the number of techniques and approaches that can
                         be used for data analysis at this stage is very extensive. The feature selection in RF-WiFi
                         signals and the techniques used for the training phases must be balanced to the needs of
                         the detection system. In [21], Di Domenico et al. explore different training approaches
                         for motion sensing platforms based on RF signals and Doppler spectrum. Furthermore,
                         they show that it is necessary to establish the necessary trade-offs in terms of performance,
                         time-consuming, complexity, and the number of features in these applications. A fall
                         detection platform implemented in [26] shows the performance of different classification al-
                         gorithms using six features extracted of the instantaneous Doppler frequency of a RF signal.
                         Detection accuracy was increased by implementing different classification algorithms such
                         as artificial neural network (ANN), K-nearest neighbors (KNN), quadratic support vector
                         machine (QSVM), or ensemble bagged tree. Fall detection systems have been proposed
                         that implement novel classification algorithms, e.g., adversarial data argumentation [27],
                         recurrent neural networks [28], among others, which positively impact accuracy rates.
                         However, this area has been under intensive research, while the sensing has been vaguely
                         explored. This is in spite of the fact that the quality of the signal features are directly related
                         to the sensing capabilities of the platform.
                               Finally, the decision stage comprises decision algorithms intended to issue alerts when
                         falls occur. This stage processes the data in real-time to determine when a fall is detected.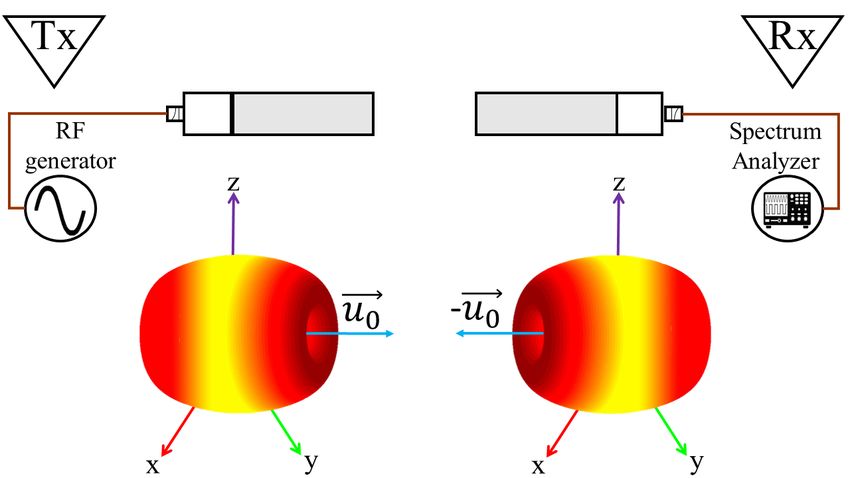
Sensors 2021, 21, 5121                                                                                              6 of 20

                         In this way, the user will receive medical attention as soon as possible. The emergency alert
                         is part of the final system process and therefore represents a device-level implementation.
                         Therefore, the decision stage is outside the scope of this work and remains as future work.

                         4. Signal Model
                              The antenna orientation influence on sensing and feature extraction stages of a WiFi-
                         based fall detection system is analyzed in this paper by considering the transmission
                         of a CW probe signal in an indoor environment. This signal could be one of the pilot
                         signals defined within the WiFi physical protocol data unit [29], or a specific purpose signal
                         transmitted by the APs when there is not an active communication session with a user node.
                         We assume the probe signal is received by another WiFi device that acts as the system’s
                         sensor and which is located in a different position than the AP. Furthermore, we assume
                         that the received probe signal comprises a line-of-sight (LOS) component and a non-LOS
                         (NLOS) component due to single reflections from K static objects (e.g., walls and furniture)
                         and a moving object (falling person), as illustrated by Figure 3.
                              The received signal can be written in the complex base-band equivalent as:

                                                                                        (s)      (m)
                                                       y(t)       = nσ (t) + ylos + ynlos + ynlos (t).                 (1)

                               In this equation, nσ (t) ∈ C is additive white Gaussian noise with power density
                         σ2 ; C stands for the set of complex-valued numbers. The LOS component of y(t) is a
                         time-invariant signal modeled by

                                                              ylos = E(~u0 )V (−~u0 ) Xlos g0 e− jθ0                   (2)

                         where E(~u0 ) ∈ R0+ is the transmitting antenna’s radiation pattern evaluated in the direction
                         of the unit vector, ~u0 , that points toward the R X from the position of the TX ; the symbol
                         R0+ stands for the set of non-negative real numbers. In turn, V (−~u0 ) ∈ R0+ is the vector
                         effective length of the receiving antenna evaluated in the direction from the R X to the
                         TX . Signal attenuation due to path loss is modeled by g0 ∈ R0+ , and θ0 = 2πD0 /λ is a
                         phase shift that depends on the signal’s wavelength λ and the distance D0 between the
                         TX and the R X . The absolute value of Xlos ∈ C is the polarization loss factor (PLF), which
                         characterizes the polarization mismatch between the transmitting and receiving antennas.
                         We note that | Xlos | ≤ 1, and | Xlos | = 1 if the antennas are co-polarized, whereas | Xlos | = 0
                         if they are cross-polarized.

                         Figure 3. Schematic propagation of an RF signal in a real test scenario.

                             The NLOS component of y(t) due to single reflections from the K static objects is
                         characterized as a time-invariant signal

                                                              K                            (s) (s)
                                                          ∑
                                                 (s)                  (s)     (s)   (s,k) (s)
                                                ynlos =           E ~uk V ~vk Xnlos gk e− j φk +θk                     (3)
                                                          k =1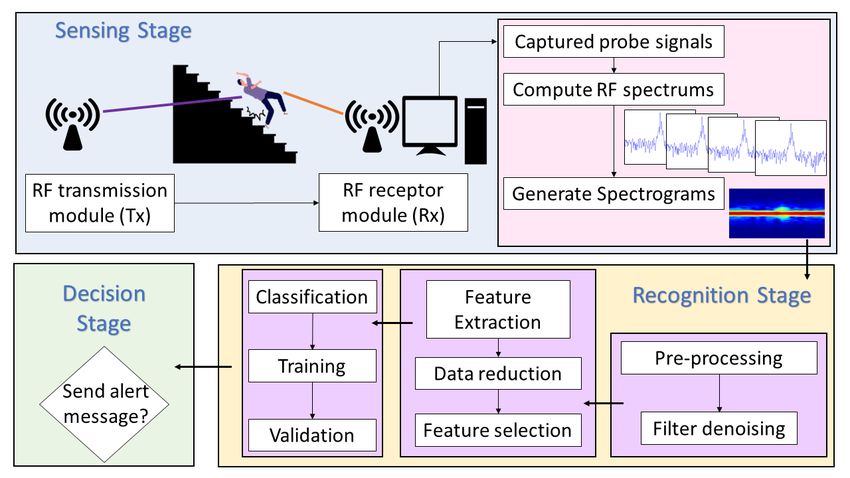
Sensors 2021, 21, 5121                                                                                                                         7 of 20

                                  (s)               (s)
                         where ~uk       and ~vk          are unit vectors that point toward the kth static reflector from the
                                                                                                                               (s)
                         position of the TX and the R X , respectively. The scalar variable gk ∈ R0+ accounts for the
                         combined effects of path loss and signal attenuation due to the interaction with the k th
                                                          (s)
                         reflector. Likewise, φk accounts for the phase shift that results from such an interaction.
                                           (s)              (s)
                         The phasor gk exp{ jφk } can therefore be described as a weighted version (weighted by
                         the path loss) of the reflection coefficient that characterizes the reflection of electromagnetic
                                                                                           (s)                           (s)            (s)       (s)
                         waves from lossy dielectrics [30]. The phase θk is given as θk = 2πDk /λ, where Dk
                         is the total length of the path among the TX , the k th reflector, and the R X . The absolute
                                     (s,k)
                         value of Xnlos ∈ C also characterizes the PLF between TX and R X . However, the difference
                                        (s,k)
                         between Xnlos and Xlos is that the former incorporates effects of depolarization caused by
                         the reflection from the k th static object [12]. In turn, the NLOS component of y(t) stemming
                         from the reflection off the falling person is modeled by
                                                                                           (m) (m) (m)
                                                  ynlos (t) = E ~u(m) V ~v(m) Xnlos g(m) e− j[φ +θ − ϕ (t)] .
                                                   (m)                         (m)
                                                                                                                                                  (4)

                               Except for the time-varying phase ϕ(m) (t), the variables on the right-hand side of (
                         4) are defined as their counterparts with the (s) superscript but considering the moving
                                                                                                            Rt
                         (falling) person as the reflector. The phase ϕ(m) (t) is given as ϕ(m) (t) = 2π 0 νd ( x ) dx,
                         where νd (t) is the total time-varying Doppler frequency shift caused by the velocity of
                         the person during a fall [31]. Assuming that the person falls with
                                                                                           a constantacceleration,
                         ϕ(m) (t) can be characterized as a quadratic phase ϕ(m) (t) = 2π νs t + νba t2 /2 , where νs is
                         the Doppler frequency shift produced by the initial speed of the falling person, and νba is a
                         frequency drift having units of hertz per second. Thereby, the total Doppler shift can be
                         written as

                                                                            νd (t) = νs + νa (t)                                                  (5)

                         with νa (t) = νba t accounting for the component of the time-varying Doppler shift due to
                         acceleration [32].
                              The spectrogram of the received probe signal is given as

                                                                           S(t0 ; ν) = |Y (t0 ; ν)|2                                              (6)
                                                                                R∞
                         where t0 is an arbitrary observation time, Y (t0 ; ν) = −∞ y(t)w(t − t0 )e− j2πνt dt is the short-
                         time Fourier transform (STFT) of y(t), and w(t) is an even and positive windowing function
                         of unit energy [25]. For the signal defined by (1)–(4), we have

                                                                                                                      (m)
                                                          Y (t0 ; ν) = Nσ (t0 ; ν) + A(s) W (t0 ; ν) + Ynlos (t0 ; ν)                             (7)

                                                   (m)                                                                      (m)
                         where W (t0 ; ν), Ynlos (t0 ; ν), and Nσ (t0 ; ν) are the STFT of w(t), ynlos (t), and the noise signal,
                                                                              (s)
                         respectively, whereas A(s) = ylos + ynlos . In this paper, we consider a Gaussian window
                                            √             2     2
                         function w(t) = ( πσs )−1/2 e−t /(2σs ) , with spread parameter σs [32], due to its good
                         frequency resolution and reduced spectral leakage. This window results in wide peaks and
                         low sidelobes, which allows a better frequency resolution. The Gaussian window is widely
                         used in applications of time-frequency analysis. For a Gaussian pulse window, it can be
                         shown (see [32]) that
                                                       q √
                                                                       0        2
                                           W (t0 ; ν) = 2σs πe2π [ jνt −π (σs ν) ]                             (8)
                                                                                    [ν−νd (t0 )]2
                                                  (m)                  A(m)   −
                                                                                        2σy2                 (m) (t0 )− ϕ(m) −θ (m) −2πνt0 ]
                                                 Ynlos (t0 ; ν)   = 3 √ e                           e j[ ϕ                                        (9)
                                                                   π 4 σy 2σs
Sensors 2021, 21, 5121 8 of 20
where σy2 = [1 − j2πσs2 νba ]/(2πσs )2 , and
(m)
A(m) = E ~u(m) V ~v(m) Xnlos g(m) . (10)
By substituting (7) into (6), we find
(m)
S ( t 0 ; ν ) = Sn ( t 0 ; ν ) + | A ( s ) |2 Sw ( t 0 ; ν ) + Sy ( t 0 ; ν ) + C ( t 0 ; ν ). (11)
In this equation,
Sn (t0 ; ν) = | Nσ (t0 ; ν)|2 (12)
√ ν ]2
Sw (t0 ; ν) = |W (t0 ; ν)|2 = 2σs πe−[2πσs (13)
2
(m) (m) 2 A(m) − [ν−νd (t0 )]2
Sy ( t 0 ; ν ) = Ynlos (t0 ; ν) = √ e 2γ2 (14)
2πγ
for γ2 = [1 + (2πσs2 νba )2 ]/[2(2πσs )2 ], and C (t0 ; υ) is a complex-valued function accounting
(m)
for the cross-products among Nσ (t0 ; ν), A(s) W (t0 ; ν), Ynlos (t0 ; ν) and their corresponding
complex conjugates [32].
Equation (11) shows that the spectrogram of the received signal is composed of two
Gaussian pulses plus a noise term and artifacts resulting from the cross-products of the
C (t0 ; υ) function. The Gaussian pulse | A(s) |2 Sw (t0 ; ν) is an origin-centered pulse whose
(s)
amplitude is scaled by the combination of ylos (t) and ynlos (t). The second Gaussian pulse,
(m)
Sy (t0 ; ν) is centered at the Doppler frequency νd (t) and it amplitude depends on the
antenna characteristics involved in the definition of A(m) (see (10)).
The combined spectrogram of the LOS and static-reflectors NLOS signals does not
contribute meaningful information for fall detection. This is because such signals remain
unchanged during a fall event as they are not influenced by the Doppler effect. All
the relevant information about the direction and speed of the fall is embedded in the
(m)
spectrogram of the moving-reflector NLOS signal through the dependence of Sy (t0 ; ν) on
(m)
the time-varying Doppler shift νa (t). However, a proper detection of Sy (t0 ; ν) depends
not only on a good match between the polarization of both antennas, but also on a good
alignment between the radiation pattern of the transmitting antenna and the vector effective
length of the receiving antenna. The alignment of the radiation pattern and polarization
during transmission depends on the antenna orientation, as illustrated in Figure 4. By
changing the position of TX and R X , mismatches occur and change the effective radiation
(m)
zones where the signal arrives [33,34]. Misalignments that decrease Sy (t0 ; ν) strength
can be mitigated by varying the orientation of the antennas and analyzing changes in the
spectrogram of the received signal.
From an analytical perspective, it is a complex process to analytically compute the
2
optimal antenna placement and orientation that maximize the value of A(m) for any
given indoor environment. However, to gain insight into the influence of the directional
characteristics of the antenna system, we have implemented a WiFi-like experimental
platform for fall detection that allows us to empirically analyze the effects of the antenna
misalignment in the system’s performance. Using the implemented experimental platform,
we conducted a series of experiments in two scenarios: VV (Figure 4a) and HH (Figure 4b).
Through the use of classification algorithms, we analyze and determine the orientation
of the antennas that provide spectrograms with a higher resolution of the fall data. The
implementation of our experimental platform is described in the following section.Sensors 2021, 21, 5121 9 of 20
(a) Radiation pattern of antennas in VV scenario (b) Radiation pattern of antennas in HH scenario
Figure 4. Radiation pattern and polarization of antennas configuration in both scenarios.
5. System Design
5.1. Hardware Setup
The TX module of our experimental platform comprises a RF signal generator connected
to a monopole antenna whose radiation pattern is omnidirectional in any plane perpendicular
to the monopole’s axis. The RX module is composed of a monopole antenna connected to a
spectrum analyzer. Both antennas were empirically characterized to ensure a proper coupling
with the measurement equipment. The results are shown in Table 2. The antennas obtained
the best parameters at a frequency of 2.42 GHz using an RG-58 coaxial cable. This operating
frequency is within the range of commercial WiFi systems (IEEE 802.11b). Our TX module
emits a pure tone with this frequency. In our case, we used a Keysight N9310A RF generator
with a transmission power of 20 dBm. The transmitted probe signal was received by a second
monopole antenna with the same characteristics. Afterward, the signal was processed by a
spectrum analyzer. We used a spectrum analyzer FieldFox N9912A. This analyzer allowed us
to capture a series of snapshots of the signal. Thereby, it was possible to record the Doppler
signatures of the probe signal caused by fall event. The configuration used for the capture
is shown in Table 3. This configuration allowed a balanced trade-off between the signal
resolution and the sweep time.
Table 2. Transmission parameters in antennas.
Parameter Value
Frequency 2.42 GHz
Return losses 32.4 dB
Impedance 50 + j0.70
Voltage standing wave ratio 1.042
Table 3. Spectrum analyzer configuration.
Parameter Value
Central frequency 2.42 GHz
Sweep time 271 ms
Sample points 1001
Frequency span 1 kHz
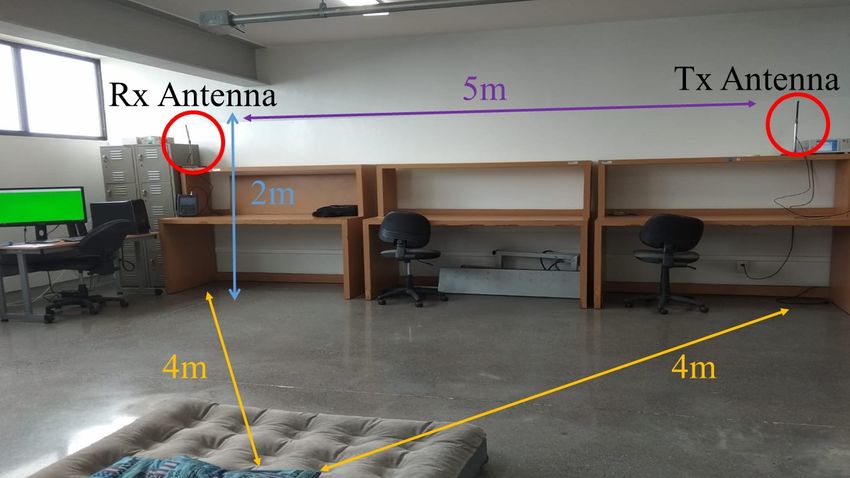
The experiments with falls were conducted in an indoor environment with fixed
furniture. Figure 5 shows the position of the transmitting and receiving modules during
the experiments. The TX module was installed in the top right corner and the receiver in
the top left corner of the room 5 m apart from each other. Both antennas were located at aSensors 2021, 21, 5121 10 of 20
height of 2 m and maintain an unobstructed LOS. This indoor environment corresponded
to an office room and had a ladder in the center of the room where falling was performed
(Figure 6). The platform allowed changing the antenna orientation according to test VV
and HH settings.
Figure 5. Schematic of the test scenario.
Figure 6. Indoor environment for the test experimentation.
5.2. Experimental Protocol
Our experimentation protocol sought to replicate the typical conditions of indoor
environments that independent elderly people face daily. To that end, it was necessary to
consider that the experiments had to be developed in the presence of a single individual in
the environment and surroundings. Furthermore, the inclusion of other activities in the
protocol such as running, jumping, or waving the arms is beyond the scope of the work.
On the other hand, the activities carried out daily such as crouching down, raising the
arms, or getting dressed did not produce an acceleration of the body compared to that of a
fall. Then, our protocol focused on the static and falling state of the participants.
The empirical data were collected for a group of people falling from different heights in
the VV and HH scenario. The participant’s age ranged from 23 to 48 years old. Furthermore,
the group was composed of three males and three females. All participants were previously
evaluated to validate that they were in good physical condition. The physical characteristics
of each individual are shown in Table 4. Due to the nature of experimentation, selecting
subjects with a higher age range could put their health at risk.
The experimentation protocol consisted of a sequence of falls from a height of 59 cm.
This height was determined according to the specifications of the third step of a ladder. In
total, the participants performed a sequence of 10 falls for each scenario.
The experiment started with a participant placed immobile on the ladder. A visual
and audible signal was configured to notify the participants of the beginning and end of
the experimentation. At the beginning of the test, the participants remained in a static stateSensors 2021, 21, 5121 11 of 20
until a signal is sent indicating the start of the falling movement. The participants were
also instructed to remain immobile once the falling movement has been performed. The
notifications of preparation, start, and end of the tests were triggered automatically by
the system to avoid the presence of more people near the test scenario. Finally, the signal
notified the end of the test to the subjects. The information collected in the experiments
was used in the subsequent stages of the system to identify falling events.
Table 4. Physical characteristics of test subjects.
Subject Age Gender Height (m) Weight (kg) Fall Tests
1 23 Female 1.61 60 20
2 24 Male 1.75 77 20
3 27 Male 1.72 73 20
4 38 Female 1.55 58 20
5 47 Female 1.55 65 20
6 48 Male 1.71 85 20
6. Feature Extraction and Classification Algorithm
The classification stage in our platform involved the pre-processing, extraction, and
classification of the acquired signals. In our system, the analyzed features must contain the
information necessary to determine the antenna orientation with which the misalignment
in fall detection could be mitigated. Our signal model indicated that frequency drifts
recorded in the spectrograms as Doppler signatures could be used as detection features.
The considered scenarios as described earlier consisted of VV and HH antenna disposition.
Each set was composed of 60 spectrograms computed during the experiments. In order to
extract the most relevant information from the spectrograms, a dimensionality-reduction
technique was employed.
We selected a principal component analysis (PCA) algorithm given its wide application
in data analysis problems [35–41]. PCA is based on singular value decomposition (SVD)
technique, which generates a low-dimensional approximation of a high-dimensional data
set in terms of its dominant patterns [42]. The PCA algorithm reduces the dimension of
the features and orders them hierarchically. Furthermore, this technique can be used to
represent the correlation of high-dimensional data through a coordinate system.
The first step in the PCA algorithm is to pre-process the calculated spectrograms.
The pre-processing in our system first reduced the frequency span of the spectrums to a
total bandwidth of 200 Hz. This was because the frequency drifts of the probe signal did
not exceed this bandwidth value. Moreover, a denoising filter was applied to smooth the
additive white Gaussian noise in the CW probe signal. The data set was then organized as
a matrix X ∈ Cm×n , where the rows xk ∈ Cn contained the instantaneous spectrum of the
probe signal received during the k th time instant, k ∈ {1, 2, . . . , m}. The next step was to
compute the mean of the n elements of row xk and subtract it from X. This standardization
process resulted in the mean-subtracted data B:
B = X − X, (15)
where X is the matrix of means. Then, it is necessary to compute the covariance matrix of
the rows of B given by
C = B T B. (16)
The covariance matrix describes all relationships between pairs of variables in the data
set [43]. In the next step, the eigen-decomposition of the covariance matrix C is computed
and resulting:
CV = VD, (17)Sensors 2021, 21, 5121 12 of 20
in this case V and D correspond to the eigenvectors and eigenvalues respectively. Finally,
the matrix of principal components is defined as,
T = BV, (18)
where T corresponds to the matrix of principal components. Furthermore, matrix B can be
defined by the SVD as:
B = UΣV T (19)
in this case, U ∈ Cn×n and V ∈ Cm×m are unit matrices with orthonormal columns, and
Σ ∈ Rn×m is a matrix with non-negative real integers on the diagonal and zeros off the
diagonal [42]. Therefore, when substituting (19) in (18), the matrix of principal components
would be given by:
T = UΣ (20)
The numerical values resulting from the PCA for the spectrogram data set could be
represented in a coordinate system. These values had a logarithmic distribution as in
Figure 7. In our case, the resulting number of principal components r corresponds to the
200 frequency values measured for each instantaneous Doppler spectrum captured during
the experiments. Additionally, σr are the elements on the diagonal of Σ that corresponded
to the singular values. Furthermore, the first three singular values σr resulting from the
PCA were taken as the features of the received signal. This was because the greater variance
of the values of our Doppler spectrums was concentrated in these components. The first
principal component in our case generally comprised 99%, the second 0.01%, and the third
0.002%. The rest of the components could be omitted because they represented a minimum
of information loss. Therefore, our system used these components as the particular features
of each spectrum that were used in the classification process.
Figure 7. Principal components of the frequency of a Doppler spectrum.
The resulting low-dimension feature space was used for classification. At this stage,
it was necessary to classify the extracted features into different classes. Support Vector
Machine (SVM) was employed due to its balance between complexity and accuracy. Addi-
tionally, SVM has demonstrated its effectiveness in fall detection [13,26]. SVM classification
allow us to measure the impact of the antenna orientation in the accuracy of the overall
fall detection system. SVM algorithms are learning machines that analyze and recognize
patterns in a set of features. This supervised learning model allows us to distinguish
between different classes. Then, we can determine if the data introduced belong to a falling
event or a static scenario. The implementation was developed using Matlab™ classification
learner toolbox. Based on the feature space generated by PCA, we selected a quadratic
kernel to maximize the geometric margin of our training data.
We evaluated the performance of the classification using a re-sampling process known
as the cross-validation method. The data introduced were randomly shuffled and di-
vided into K folds. The first fold was used for validation and the rest for training. WhenSensors 2021, 21, 5121 13 of 20
the process concluded, the performance score was preserved and the model was dis-
carded. Afterward, the process was iterated K times. Therefore, the model could be
trained K − 1 times. Finally, the performance scores were averaged to reduce randomness
and obtain an accurate result. Performance scores were obtained using five folds of the
cross-validation method.
7. Results
The results obtained by our platform allowed us to assess the impact of antenna
polarization in the fall detection rate. The pre-processing results of the signals are shown
in Figures 8 and 9. Frequency dispersions caused by human movement during tests were
notable in each spectrogram time sample.
(a) Doppler signatures captured in the spectrograms.
(b) Sequence of Doppler spectrums at a time t1 = 4.5 s (before fall),
t2 = 6 s (fall) and t3 = 7.5 s (after fall).
Figure 8. Experimental results using VV scenario setup: (a) spectrogram, (b) sequence of spectrums.
Figure 8 shows the results obtained during one of the experiments with the VV
orientation of the antennas. The falling event was recorded at 6 s of the experimentation.
In the spectrogram of Figure 8a, the Doppler signatures captured during falling caused a
dispersion of the probe signal.
On the other hand, Figure 8b shows a sequence of the frequency spectrums before,
during, and after the falling event. In the spectrum corresponding to falling event, echoes
could be observed in the carrier signal. These echoes corresponded to the fluctuations
produced by the Doppler effect. Therefore, the configuration with the antennas in VV
orientation achieved to capture the dispersions caused by the falls and the data could be
used in the recognition stage.
The dataset of the HH scenario was processed following the same methodology. The
results of the experiments with this orientation of the antennas are shown in Figure 9. InSensors 2021, 21, 5121 14 of 20
this case, the falling event was also recorded at 6 s. In Figure 9a the Doppler signatures at 6 s
are distinguishable from the rest of the time samples recorded during the experimentation.
The data showed a clear difference between the two datasets. Figure 9b shows a higher
amplitude echo in the HH scenario compared to the VV scenario shown in Figure 8b.
(a) Doppler signatures captured in the spectrograms.
(b) Sequence of Doppler spectrums at a time t1 = 4.5 s (before fall),
t2 = 6 s (fall) and t3 = 7.5 s (after fall).
Figure 9. Experimental results using HH scenario setup: (a) spectrogram, (b) sequence of spectrums.
Both datasets captured dispersions caused by falling events. It is important to mention
that both experiments were carried out under the same conditions and with the same
angle of observation of the antennas. Nevertheless, the Doppler signatures in the HH
case were more prominent. Therefore, the most prominent dispersion was achieved with
this orientation.
To evaluate the impact of the antenna orientation, the frequency was taken as the
feature of the Doppler spectrums. The feature space was reduced using the PCA for both
scenarios. Figure 10 shows the comparison of the feature space obtained in each of the
scenarios using a projection of the first two principal components. Figure 10a contains the
numerical values obtained with the data from the VV scenario. The crosses in Figure 10a
marks the identified falls. The rest of the features corresponded to non-movement period
and are shown as dots. The distribution of the data of both classes shows in multiple cases
showed similarities between their numerical values. Figure 10a shows a low separability
between the non-movement and the falling events features, this made the classification
process between both classes difficult.Sensors 2021, 21, 5121 15 of 20
(a) VV scenario features
(b) HH scenario features
Figure 10. Projection of the first and second principal components.
On the other hand, the projection of the features of the HH scenario in Figure 10b
shows a contrasting distribution compared to that of the VV scenario. Most of the features
that corresponded to falls had numerical values that could be differentiated from the
rest. This separation between both classes determined that the features extracted from the
spectrum where a fall occurred using the HH orientation of the antennas obtained a greater
variability than the rest.
Classification was performed with SVM and the results are shown in Figure 11. Using
the dataset of the VV scenario, an accuracy of 50% in the detection of falls was achieved
(Figure 11a). Therefore, the false-negative rate was also 50%. This represents a high rate of
false alarms in the system. The low percentage of accuracy was attributed to the sensing
capability of the system when using a VV orientation of the antennas. After analyzing the
principal components of the received signal in this scenario, it was shown that they had
low variability and negatively impact the classification algorithm.
The results for the HH scenario dataset are shown in Figure 11b. In this case, the accu-
racy percentage increased. The evaluation results showed a 92% accuracy in the detection
of falls. The false negative rate decreased to 8%. This indicated that the sensing capabilities
of the system could be increased by analyzing the effects related to the orientation of the
antennas. This may represent a solution to the limitation of systems based on RF-WiFi
signals without the need to increase the number of sensors in the indoor environment.
Figures 12 and 13 show accuracy comparison between our experiments and two
previously proposed systems. The comparison showed that classification accuracy was
impacted by antenna orientation. Therefore, false negative rate was also affected. Although
these systems used other features of the RF-WiFi signals for their recognition stage, the
sensing stage was the common component in any system. WiFall-one link had a similar
configuration to our system with only one TX and one receiver. Nevertheless, with the HH
scenario, higher accuracy percentages were achieved. WiFall-two links have two receiverSensors 2021, 21, 5121 16 of 20
sensors, our accuracy percentage (Figure 13) was very close to their results. Finally, Fall
sense reported a 3% higher accuracy than the accuracy achieved by our experiments at
the cost of increasing the number of sensor. It should be noted that in our experiments
only one sensor was used and with a careful consideration of antenna orientation, a
increase of 12% was achieved. However, it was remarkable that orientation changes
represented an important factor in the detection rate. Therefore, systems that considered
these characteristics at the sensing stage could improve their accuracy and false-negative
rate results. We expect that this configuration will help improve the difference between
falls events and activities of daily living.
(a) VV scenario
(b) HH scenario
Figure 11. Confusion matrix of the SVM algorithm.
Figure 12. Comparison of Wifall, FallSense and VV scenario.Sensors 2021, 21, 5121 17 of 20
Figure 13. Comparison of Wifall, FallSense and HH scenario.
8. Discussion
Our preliminary results showed that the features extracted in the HH scenario corre-
sponding to each participant have a trend in their values. The concordance of this indicates
that under the same experimental conditions each person produced Doppler signatures
different from those of the rest. Therefore, there is the possibility of characterizing the
unique movement of each individual. This could close the gap with monitoring problems
when there is the presence of more than one person moving near to the indoor environment.
Furthermore, this would allow the proposed scenario to be expanded to less controlled
environments such as monitoring in public places.
The results obtained in our experiments show that the HH scenario provides a better
observation of Doppler shift that allows one to obtain a separable set of features through
PCA. However, a set of different activities should be measured to ensure the correct classi-
fication of a fall. Human daily activities such as walking, walking waving arms or running,
have a common characteristic, they produce a periodic Doppler shift as has been shown
in [44]. However, seating and laying down are also non-periodic activities that do not
produce a distinguishable Doppler shift as shown in a series of experiments measure with
a 2.4 GHz radar [44]. In our future experiments, additional activities, such as walking
towards or away from the stair, going up or down the stair and falling, should also be
measured and analyzed to ensure that these activities can be distinguished from a fall. Ad-
ditionally, feature extraction considering spatio-temporal evolution of the activities should
be explored for classification of periodic and non-periodic activities. Early experiments
including several activities has led us to expect that those activities can be distinguished.
Besides, aged population is rising due to advanced medicine and higher life quality.
However, world population reports higher susceptibility to age-related diseases that can
be addressed by health technology. Wireless Body Area Network (WBAN) has been
explored as a healthcare technology that can monitor blood pressure, blood sugar level
or other physiological variable that prevent catastrophic events [45]. WBAN architecture
involves a dense network of sensor and actuators distributed in the body that interact
with a coordinator that sends information outside the WBAN, a smartphone is normally
used as a gateway. WBAN uses the 2.4 GHz ISM band to communicate between sensors
and coordinator. There are several communication technologies used for intra-WBAN
including Bluetooth, ZigBee, and Ultrawide band. The co-channel interference may occur
due to the coexistence of WBAN with WiFi, ZigBee, Bluetooth, and cellular devices that
share the same band. However, WiFi uses higher transmission power level than WBAN
and consequently WiFi transmission dominates the medium [46]. Normally the gateway
that sends information out of WBAN use WiFi, therefore, the interaction of WBAN with
cloud-based services uses the same information channel that is used for the measure
Doppler signatures. Quality of Service (QoS) measurements such as CSI or RSSI might be
impacted by the interaction between these technologies, but Doppler signatures might not
be affected.Sensors 2021, 21, 5121 18 of 20
Considering the above, it is possible to use the signals transmitted by commercial
WiFi systems by analyzing Doppler signatures for fall detection without compromising
coexistence. Furthermore, the analysis of the Doppler signatures allows the use of diversity
techniques. In a WiFi system that transmits several pilot signals, the Doppler drifts will be
replicated in each one. Therefore, the effects related to human movement can be compared
in the same instant of time by more than one probe signal without the need to add a set of
antennas to the system. This avenue has not been widely studied.
Finally, falling is a transient event that might be undetected due to the interruption
of signal transmission. WiFi APs transmit their signals in bursts, interrupting the sensing
process for short periods of time. Then, in the current transmission protocol that might
cause a falling event to be undetected. Therefore, it should be considered to implement a
continuous transmission mode with low power consumption that allows uninterrupted
monitoring of the environment.
9. Conclusions
A study of the impact of antenna polarization in classification accuracy was performed.
In order to determine this impact, an indoor WiFi platform was built with general-purpose
equipment. The platform uses RF-WiFi signals to measure fluctuations caused by human
movement without the need to carry any device. The design and development of the
platform were presented as well as the fall experimentation protocol with volunteer sub-
jects. At an operating frequency of 2.42 GHz we recorded the Doppler signatures on a
series of spectrograms during testing. Two scenarios were proposed to characterize the
effects caused by antenna orientation that impact the performance of the platform. The
HH antenna scenario presented more prominent fluctuations during the tests. PCA was
selected as a classification feature. It was shown that PCA component distribution shows
difference in separability for the considered scenarios. A classification performed by SVM
algorithm demonstrated that changing the orientation of the antennas can improve perfor-
mance in detecting falling events. The impact of the antenna orientation in HH scenario
shows a higher accuracy without increasing the number of sensors. Therefore, a careful
consideration of antenna polarization should improve fall detection system design. When
we compare these results with some of the systems that use a greater number of sensors,
the relationship between accuracy and the false-negative rate had a similar performance.
Therefore, our experiments showed that mitigation of the limitation of fall detection system
based on a single sensor can be achieved by considering the effects of antenna orientation
in the signal model.
Author Contributions: Conceptualization, J.D.C., C.A.G. and R.A.-P.; methodology, J.D.C., C.A.G.
and R.A.-P.; software, J.D.C.; validation, J.D.C., C.A.G. and R.A.-P.; formal analysis, J.D.C., C.A.G.
and R.A.-P.; investigation, J.D.C., C.A.G. and R.A.-P.; resources, J.D.C., C.A.G. and R.A.-P.; writing,
original draft preparation, J.D.C.; writing, review and editing, C.A.G. and R.A.-P.; supervision, C.A.G.
and R.A.-P.; project administration, C.A.G. and R.A.-P.; funding acquisition, C.A.G. and R.A.-P. All
authors read and agreed to the published version of the manuscript.
Funding: This research received no external funding.
Informed Consent Statement: Informed consent was obtained from all subjects involved in the study.
Conflicts of Interest: The authors declare no conflict of interest.
References
1. Nations, U. World Population Ageing 2019: Highlights; Technical Report; Department of Economic and Social Affairs, Population
Division: New York, NY, USA. 2019.
2. Sim, J.M.; Lee, Y.; Kwon, O. Acoustic Sensor Based Recognition of Human Activity in Everyday Life for Smart Home Services.
Int. J. Distrib. Sens. Netw. 2015, 2015, 679123. [CrossRef]
3. Liu, C.; Jiang, Z.; Su, X.; Benzoni, S.; Maxwell, A. Detection of human fall using floor vibration and multi-features semi-supervised
SVM. Sensors 2019, 19, 3720. [CrossRef] [PubMed]Sensors 2021, 21, 5121 19 of 20
4. Zhang, J.; Wu, C.; Wang, Y. Human fall detection based on body posture spatio-temporal evolution. Sensors 2020, 20, 946.
[CrossRef] [PubMed]
5. Hauth, J.; Jabri, S.; Kamran, F.; Feleke, E.W.; Nigusie, K.; Ojeda, L.V.; Handelzalts, S.; Nyquist, L.; Alexander, N.B.; Huan, X.; et al.
Automated Loss-of-Balance Event Identification in Older Adults at Risk of Falls during Real-World Walking Using Wearable
Inertial Measurement Units. Sensors 2021, 21, 4661. [CrossRef] [PubMed]
6. Chen, L.; Hoey, J.; Nugent, C.D.; Cook, D.J.; Yu, Z. Sensor-based activity recognition. IEEE Trans. Syst. Man Cybern. Part C Appl.
Rev. 2012, 42, 790–808. [CrossRef]
7. Woyach, K.; Puccinelli, D.; Haenggi, M. Sensorless sensing in wireless networks: Implementation and measurements. In
Proceedings of the 2006 4th International Symposium on Modeling and Optimization in Mobile, Ad Hoc and Wireless Networks,
Boston, MA, USA, 26 February–2 March 2006; pp. 1–8. [CrossRef]
8. Lee, P.W.; Seah, W.K.; Tan, H.P.; Yao, Z. Wireless sensing without sensors-an experimental study of motion/intrusion detection
using RF irregularity. Meas. Sci. Technol. 2010, 21, 124007. [CrossRef]
9. World Health Organization. WHO Global Report on Falls Prevention in Older Age; WHO: Geneva, Switzerland, 2008.
10. Huang, M.; Liu, J.; Gu, Y.; Zhang, Y.; Ren, F.; Wang, X.; Li, J. Your WiFi Knows You Fall: A Channel Data-Driven Device-Free Fall
Sensing System. In Proceedings of the 2018 5th IEEE International Conference on Cloud Computing and Intelligence Systems
(CCIS), Nanjing, China, 23–25 November 2019. [CrossRef]
11. Wang, W.; Liu, A.X.; Shahzad, M.; Ling, K.; Lu, S. Device-Free Human Activity Recognition Using Commercial WiFi Devices.
IEEE J. Sel. Areas Commun. 2017, 35, 1118–1131. [CrossRef]
12. Gutiérrez, C.A.; Ornelas-Lizcano, J.C.; Pätzold, M. Geometrical modeling of non-stationary polarimetric vehicular radio channels.
In Proceedings of the 2019 IEEE 2nd Connected and Automated Vehicles Symposium (CAVS), Honolulu, HI, USA, 22–23
September 2019. [CrossRef]
13. Wang, Y.; Wu, K.; Ni, L.M. WiFall: Device-Free Fall Detection by Wireless Networks. IEEE Trans. Mob. Comput. 2017, 16, 581–594.
[CrossRef]
14. Bhattacharya, A.; Vaughan, R. Deep Learning Radar Design for Breathing and Fall Detection. IEEE Sens. J. 2020, 20, 5072–5085.
[CrossRef]
15. Cardenas, J.; Gutierrez, C.A.; Aguilar-Ponce, R. Effects of Antenna Orientation in Fall Detection Systems Based on WiFi Signals.
In Proceedings of the 2020 IEEE Latin-American Conference on Communications (LATINCOM), Santo Domingo, Dominican
Republic, 18–20 November 2020; pp. 1–6. [CrossRef]
16. Rougier, C.; Meunier, J.; St-Arnaud, A.; Rousseau, J. Robust video surveillance for fall detection based on human shape
deformation. IEEE Trans. Circuits Syst. Video Technol. 2011, 21, 611–622. [CrossRef]
17. Su, X.; Tong, H.; Ji, P. Activity recognition with smartphone sensors. Tsinghua Sci. Technol. 2014, 19, 235–249. [CrossRef]
18. Zurbuchen, N.; Wilde, A.; Bruegger, P. A Machine Learning Multi-Class Approach for Fall Detection Systems Based on Wearable
Sensors with a Study on Sampling Rates. Sensors 2021, 21, 938. [CrossRef] [PubMed]
19. Withanage, K.I.; Lee, I.; Brinkworth, R.; Mackintosh, S.; Thewlis, D. Fall Recovery Subactivity Recognition with RGB-D Cameras.
IEEE Trans. Ind. Inform. 2016, 12, 2312–2320. [CrossRef]
20. Kerdjidj, O.; Ramzan, N.; Ghanem, K.; Amira, A.; Chouireb, F. Fall detection and human activity classification using wearable
sensors and compressed sensing. J. Ambient Intell. Humaniz. Comput. 2020, 11, 349–361. [CrossRef]
21. Di Domenico, S.; De Sanctis, M.; Cianca, E.; Giuliano, F.; Bianchi, G. Exploring Training Options for RF Sensing Using CSI. IEEE
Commun. Mag. 2018, 56, 116–123. [CrossRef]
22. Wu, D.; Zhang, D.; Xu, C.; Wang, H.; Li, X. Device-Free WiFi Human Sensing: From Pattern-Based to Model-Based Approaches.
IEEE Commun. Mag. 2017, 55, 91–97. [CrossRef]
23. Firoozi, F.; Borhani, A.; Patzold, M. Experimental characterization of mobile fading channels aiming the design of non-wearable
fall detection radio systems at 5.9 GHz. In Proceedings of the 2016 IEEE International Conference on Communication Systems
(ICCS), Shenzhen, China, 14–16 December 2017. [CrossRef]
24. Erol, B.; Amin, M. Effects of range spread and aspect angle on radar fall detection. In Proceedings of the 2016 IEEE Sensor Array
and Multichannel Signal Processing Workshop (SAM), Rio de Janeiro, Brazil, 10–13 July 2016; pp. 1–5. [CrossRef]
25. Patzold, M.; Youssef, N. Spectrogram analysis of multipath fading channels. In Proceedings of the 2015 IEEE 26th Annual
International Symposium on Personal, Indoor, and Mobile Radio Communications (PIMRC), Hong Kong, China, 30 August–2
September 2015; pp. 2214–2219. [CrossRef]
26. Chelli, A.; Pätzold, M. A Machine Learning Approach for Fall Detection Based on the Instantaneous Doppler Frequency. IEEE
Access 2019, 7, 166173–166189. [CrossRef]
27. Nguyen, T.D.H.; Nguyen, H.N.H. Towards a Robust WiFi-based Fall Detection with Adversarial Data Augmentation. In
Proceedings of the 2020 54th Annual Conference on Information Sciences and Systems (CISS), Princeton, NJ, USA, 18–20 March
2020. [CrossRef]
28. Ding, J.; Wang, Y. A WiFi-Based Smart Home Fall Detection System Using Recurrent Neural Network. IEEE Trans. Consum.
Electron. 2020, 66, 308–317. [CrossRef]
29. C/LM-LAN/MAN Standards Committee. IEEE Standard for Information Technology-Telecommunications and Information Exchange
Between Systems-Local and Metropolitan Area Networks-Specific Requirements Part 11 : Wireless LAN Medium Access Control (MAC) and
Physical Layer (PHY) Specifications; IEEE Std 802.11; IEEE: Piscataway, NJ, USA, 2007. [CrossRef]You can also read