Inflation and Indiana's Fiscal Outlook - A Discussion of Current Conditions & Potential Challenges - Indiana Fiscal Policy Institute
←
→
Page content transcription
If your browser does not render page correctly, please read the page content below
April 11, 2022 Inflation and Indiana’s Fiscal Outlook A Discussion of Current Conditions & Potential Challenges – Indiana Fiscal Policy Institute On March 31st, the U.S. Bureau of Economic Analysis announced the latest Personal Consumption Expenditures (PCE) Price Index. The PCE measures inflation by an analysis of business inventories (as compared to the Consumer Price Index), as is the Federal Reserve’s preferred barometer for guiding inflation policy adjustments. The PCE Index has hit a forty-year high, with a 6.4% annualized rate through February that doesn’t capture the spike in gasoline prices in the wake of Russia’s invasion of Ukraine. The impact of inflation on Hoosier household budgets is obvious every time we refill our tanks or stock up on groceries – indexes for food, gasoline and shelter drove the 7.9% annual CPI rate in February. Cost increases and supply chain issues are affecting businesses as well, compounded by a tight labor market adding upward pressure on wages. But in terms of Indiana’s fiscal outlook, how might inflation influence state and local revenues and spending capacity on budget priorities like education and infrastructure? This brief discusses potential impacts of the current inflation on general revenues including the state income and sales tax (pages 2-3) and implications for education funding (page 3); local property and income taxes (pages 3-4); as well as an overview of significant cost trends in public sector payrolls and capital construction that represent a more immediate challenge to local governments, given their lack of fiscal flexibility (pages 4-6). First, a look at the trend leading into the current situation: Since 2010, annual growth in the PCE Price Index has generally stayed below 2%; Figure 1 compares the PCE Index to Indiana’s per capita income growth over the past decade. Figure 1: PCE Price Index Annual Growth and Indiana Per Capita Personal Income, 2010-2020 Indiana Fiscal Policy Institute One American Square, Suite 150 Indianapolis, IN 46282 www.IndianaFiscal.org
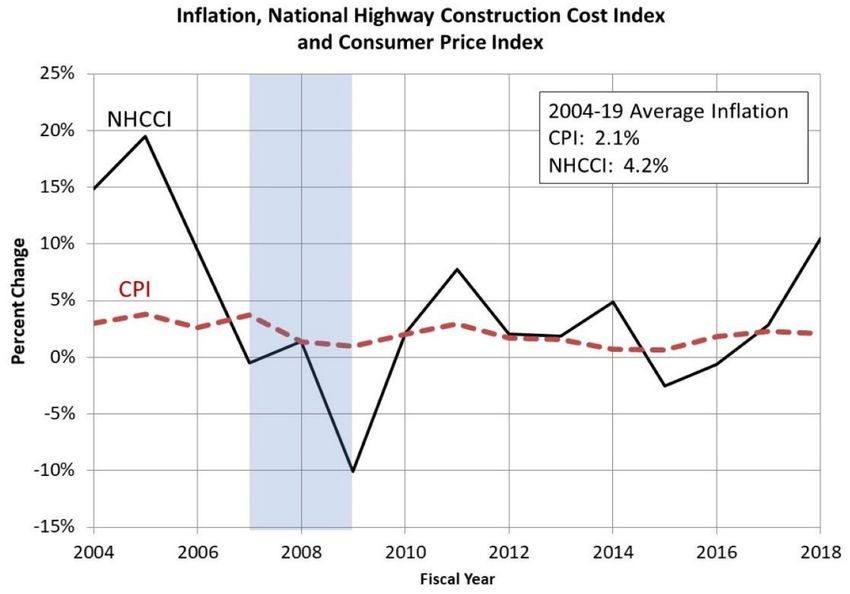
2 As the chart illustrates, personal income growth for the average Hoosier generally lingered above the rate of PCE inflation during the 2010s. The most significant inversion of this dynamic came in 2013 and coincided with a general fund revenue decline in FY2014 and a 2014-2015 biennium with state revenues falling below appropriations, balancing the budget only by aggressive reversions (according to analysis by Purdue economist Larry DeBoer). If PCE inflation stays above 5% through the summer, it would exceed the FY2022 projection of adjusted per household personal income used in the December 16th revenue forecast – a sign of future budget stress? Let’s start with a deeper look at inflation and the forecast model, moving on to potential revenue impacts. General Fund Revenue Assumptions – Forecast vs. Economic Projections Inflation has grown beyond the economic outlook model guiding the December 2021 state revenue forecast. HIS Markit projected annual CPI growth of 3.7% (2022) and 2.3% (2023), with a spike to 6.5% in January 2022 followed by a precipitous decline towards 2% for the remainder of the year. Clearly, events have overtaken these assumptions. The Federal Reserve Open Market Committee released updated consensus projections on March 16th, 2022, with median PCE estimates of 4.3% in 2022 and 3.24% in 2023. Using the historical variance between the two measures, this translates to roughly 5.16% and 3.24% in CPI. However, HIS Markit expected “core PCE inflation to…subside to moderately above 2% by 2023.” Federal Reserve economists still anticipate controlling PCE to this level by 2024; assumptions on longer-term inflation are converging heading into Indiana’s next biennial budget, but with a year-long lag. This still means dealing with inflationary pressures for the remainder of FY2022 and 2023, and crafting a new budget with an annualized “headline” inflation rate 50-60% higher than the last two budget cycles. What does this mean for general fund revenues and expenditures? Income Taxes: A state revenue windfall? As a recent S&P Global commentary notes, inflation will affect states differently. Some states will experience “revenue windfalls” as wage inflation floats taxpayers into higher brackets without increasing real buying power. However, the majority of states with graduated systems index brackets and/or exemptions to inflation to mitigate such stealth tax increases. Of the 43 states with personal taxes on wages (or investment income), only nine (including Indiana) have a flat rate. This means earnings growth will be consistently reflected in taxable income, adding to income tax collections, though not at a ‘windfall’ level. Four months of data under the December revenue forecast shows income tax withholdings $60 million above estimates, which could be partially attributable to wage inflation effects (along with increased payrolls overall as unemployment rates fall below 3%). Sales tax revenue is holding steady, about $4 million above estimates from December through March; March was the strongest month of CY2022, with collections at $733 million ($20 million over the monthly forecast). What does the future hold for the state’s largest source of general fund revenue in an inflationary economy? Indiana Fiscal Policy Institute One American Square, Suite 150 Indianapolis, IN 46282 www.IndianaFiscal.org
3
Sales Taxes (and School Budgets):
It’s intuitive to expect rising prices to boost sales taxes even more directly than other revenue streams, and
March performance could be a harbinger. However, Indiana’s tax base excludes many necessities – such as
grocery items – that are leading the surge of consumer inflation, leaving less discretionary income to spend on
taxable goods. (Since last April, Hoosier spending on grocery items has increased at twice the rate of overall
personal spending, according to analysis by Opportunity Insights/Harvard.) Nationally, overall consumer
spending rose 0.2% in March, less than half what economists expected.
Sales tax revenue was already expected to dip slightly in FY2023 after two years of double-digit growth, as pent-
up consumer activity slows and Hoosier spending habits shift back to (untaxed) services from goods (resuming a
pre-COVID pattern). Persistent inflation could make this trend even more pronounced, if consumers become
more cautious in their spending beyond basic necessities just as Indiana begins a seven-year schedule of income
tax cuts (HB1002) that further shifts our reliance towards the sales tax.
Personal income (minus transfer payments) and earnings growth are obviously key predictors of buying power
feeding the sales tax forecast. While these data aren’t updated into CY2022, we can make observations about
two other technical assumptions behind the sales tax model:
• The national household obligation/disposable income ratio is not recovering as quickly in FY2022 (YTD) as
projected on an annualized basis, likely as a result of higher prices on basic necessities.
• The more moderate pace of existing home sales predicted in the forecast is on track with year-to-date data
released by the Indiana Association of Realtors; but looking forward, could higher-than-anticipated rate
hikes (combined with lower housing starts) push the market below projections by the end of the year?
Complications for the classroom:
A broader discussion of cost pressures starts on page 4, but Indiana’s sales tax was last increased in 2008 to
support K-12 operating budgets: Any complication in future revenues is a matter of concern for school
corporations, which now depend on state aid for all ‘education fund’ expenditures, including teacher pay.
Local schools receive $16 billion in enrollment-based tuition support in the current biennium, with a legislative
directive to use at least 45% of their state funding for educator salaries. But inflation is already eroding the
impact of K-12 budget increases meant to close the gaps identified by the Governor’s Teacher Pay Commission.
Renewed concerns over recruitment, retention and compensation keeping pace with cost of living will likely
greet lawmakers in January as they begin negotiating appropriations for FY2024 and 2025.
Local Government Revenues – Back to the Future:
Despite these issues, Indiana’s healthy budget surplus provides some insulation against inflation, at least for the
near term. Local governments are more vulnerable to elevated costs lingering into next year.
Food and beverage, innkeepers and other minor local revenue sources face the same consumer headwinds as
general sales taxes. But inflation also creates a broader structural challenge in the local tax system, specifically
in the timing of taxation, collections and distributions.
At the state level, budgets are crafted using forecasts of general fund revenues, matching collections and
expenses over a biennium. But the two primary sources of county and municipal revenue are based on past
economic conditions even as inflation raises costs in real time.
Property tax bills are based on assessments from the previous year, and total collections can only grow as fast
as the six-year average of statewide non-farm personal income (the Maximum Levy Growth Quotient, MLGQ).
Indiana Fiscal Policy Institute One American Square, Suite 150 Indianapolis, IN 46282 www.IndianaFiscal.org4 Local income taxes are collected by the state and redistributed to counties based on past collections, calculated from prior-year tax returns. (For more on the challenges this creates during periods of expansion and recession, see IFPI’s 2021 study of Indiana’s local income tax structure.) So more than 80% of local revenues are based on real estate activity and earnings one to two years (or more) removed from the current budget. Positive factors in local revenues: There are a few factors easing the local tax climate. Federal relief and a faster-than-expected economic recovery kept personal income growing through 2020 and 2021, and home prices have risen rapidly over the same timeframe. This will keep property tax assessments and levies rising, with an MLGQ over 4.5% (still below the current rate of inflation). After a slight dip this year, local income tax distributions should also rebound for the 2023 budget year. As described above, CY2023 distributions are based primarily on FY2021 wages, which grew at a solid 4.52% pace. Finally, the U.S. Treasury recently granted more flexibility on local uses of American Rescue Plan funds, which could offer temporary budget relief. Inflation Fueling Public Cost Challenges: With revenue uncertainty on one side of the ledger, costs are also rising for all levels of government. Again, localities have limited flexibility within already-lean budgets. Adjusted for inflation, Indiana’s average county and municipal spending was growing about 2% annually over the five years leading into the pandemic. PCE inflation is now rising more than three times that rate. Pressures on public payroll expenses extend beyond Indiana’s 60,000+ (public school) teachers. Recruiting and retaining public sector employees in competition with the private sector is an ongoing issue, exacerbated by widespread workforce shortages. Add Indiana’s fifty-year low unemployment rate to the nation’s forty-year high inflation, and labor costs are an issue for most governmental units and agencies. Figure 2 on the following page shows a comparison of total Indiana private sector wages and salaries versus total state and local public sector wages since 2000, to illustrate the difficult hiring and retention climate facing Indiana government as inflation raises the stakes for competitive compensation and job openings reach on all- time high. Indiana Fiscal Policy Institute One American Square, Suite 150 Indianapolis, IN 46282 www.IndianaFiscal.org
5
Figure 2: Indiana Private Wage/Salary Growth versus State/Local Government Earnings
2001-2021: Indexed quarterly growth rates (Q1 2001=100)
Figure 2 shows competitive growth
trends between Indiana’s public
sector and private payrolls from
2001 until the economic collapse of
the Great Recession, when public
employment remained stable by
necessity through the crisis.
The private wage recovery occurred
as the state tightened fiscal policies
and local government adjusted to
the impacts of property tax caps.
The public/private salary gap is at its
widest in 2021 by this measure, just
as inflation began to rise.
Recent wage and salary surveys
show a plurality of employers
nationally planning 5%+ cost-of-
living increases in 2022.
This is consistent with state employee increases announced in December, but these raises don’t change the
competitive landscape as agencies like the Indiana State Police and Department of Corrections are promoting
signing bonuses and other inducements to fill open positions.
Infrastructure Costs: A Pre-Existing Budget Issue that Continues to Build
State and local governments also share the costs of infrastructure, dividing proceeds of the gasoline use tax to
support a significant share of road and highway budgets.
Monthly revenue reports haven’t captured the recent high prices at the pump, but it’s unlikely that higher per
gallon tax collections at current consumption levels will generate revenues sufficient to keep up with continued
inflation, as construction costs have soared beyond the consumer price index.
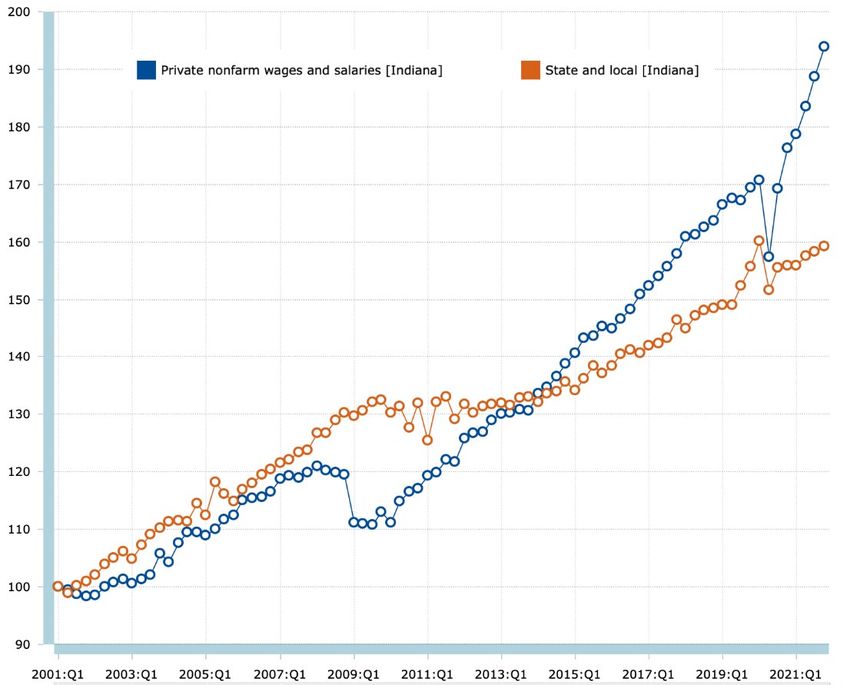
Nonresidential material prices are rising at an annualized rate of 21%, according to the Associated General
Contractors of America (AGC). The Highway Construction Cost Index rose nearly 13% in 2018 and is in the midst
of another double-digit spike since late 2020. Figure 3 (next page) shows the cost climate that has made
infrastructure funding a critical challenge for Indiana, necessitating financing mechanisms like Major Moves
under the Daniels administration and the passage of long-term reform shifting gasoline use tax revenues from
the general fund into dedicated transportation funds in 2017.
Indiana Fiscal Policy Institute One American Square, Suite 150 Indianapolis, IN 46282 www.IndianaFiscal.org6
Figure 3: Larry DeBoer – Trends in CPI and the National Highway Construction Cost Index
Figure 3 excerpts a 2019
presentation by Professor
Larry DeBoer of Purdue
University on various state
and local budget issues
including infrastructure
funding – noting that the
costs of road and highway
maintenance and construction
have consistently outpaced
consumer inflation since the
Great Recession, leading into
COVID and the current bout of
inflation.
Parting Thoughts:
Inflation doesn't represent a budgetary crisis for Indiana (yet), but its continuation will eventually begin to chip
away at the state's strong position and historic reserves emerging from COVID. Local government has less
flexibility to accommodate cost pressures, but the growth of assessed values and personal income through the
pandemic have kept property tax revenues and local income tax distributions rising.
On the other hand, moves by the Federal Reserve to bring inflation back to the 2-3% range by the end of this
year will raise the cost of public debt and pose a different set of risks to revenues if the economy slows.
Either way, early optimism that this inflation could be transitory without Fed action has faded. Scenarios of
elevated costs and unsettled revenues extending into 2023 (and beyond) have to be factored into the local
budget process this summer for CY2023, the state's fiscal management of the remaining months of FY2022 and
FY2023 versus a budget plan that didn’t anticipate inflation at this level. Certainly, current conditions will shift
the revenue model and cost assumptions as policymakers begin planning for the next biennium – how much
remains to be seen.
Indiana Fiscal Policy Institute One American Square, Suite 150 Indianapolis, IN 46282 www.IndianaFiscal.orgYou can also read