Improving Statistics Development in Ukraine - OECD
←
→
Page content transcription
If your browser does not render page correctly, please read the page content below
WEBINAR PROCEEDINGS

Improving Statistics Development
in Ukraine
First webinar
Methodology for compiling statistics to analyse
the development of small and medium-sized
enterprises, including at regional and local levels

Tuesday 27 April 2021
10:00 – 13:00 (France and Poland, GMT+1)
11:00 – 14:00 (Ukraine and Israel, GMT+2)
ORGANISATION FOR ECONOMIC CO-OPERATION AND DEVELOPMENT
The OECD is a unique forum where governments work together to address the economic, social and
environmental challenges of globalisation. The OECD is also at the forefront of efforts to understand and to
help governments respond to new developments and concerns, such as corporate governance, the
information economy and the challenges of an ageing population. The Organisation provides a setting where
governments can compare policy experience, seek answers to common problems, identify good practice and
work to co-ordinate domestic and international policies. The OECD member countries are: Australia, Austria,
Belgium, Canada, Chile, Colombia, the Czech Republic, Denmark, Estonia, Finland, France, Germany, Greece,
Hungary, Iceland, Ireland, Israel, Italy, Japan, Korea, Latvia, Lithuania, Luxembourg, Mexico, the Netherlands,
New Zealand, Norway, Poland, Portugal, the Slovak Republic, Slovenia, Spain, Sweden, Switzerland, Turkey,
the United Kingdom and the United States.
www.oecd.org

 OECD EURASIA COMPETITIVENESS PROGRAMME
The OECD Eurasia Competitiveness Programme, launched in 2008, helps accelerate economic reforms and
improve the business climate to achieve sustainable economic growth and employment in two regions: Central
Asia (Afghanistan, Kazakhstan, Kyrgyzstan, Mongolia, Tajikistan, Turkmenistan and Uzbekistan), and Eastern
Europe and South Caucasus (Armenia, Azerbaijan, Belarus, Georgia, the Republic of Moldova and Ukraine).
The Programme contributes to the OECD outreach strategy implemented by the Global Relations Secretariat,
and works in close collaboration with specialised expert divisions across the OECD.
www.oecd.org/globalrelations/eurasia.htm

 OECD CENTRE FOR ENTREPRENEURSHIP, SMEs, REGIONS AND CITIES
The OECD Centre for Entrepreneurship, SMEs, Regions and Cities helps local and national governments
unleash the potential of entrepreneurs and small and medium-sized enterprises, promote inclusive and
sustainable regions and cities, boost local job creation and implement sound tourism policies. It also supports
evidence-based policy to improve people's well-being in all regions and cities through testing and producing
new indicators, methods and analysis, and promoting the use of data and indicators in all phases of
policymaking.
www.oecd.org/cfe

 2
WEBINAR PROCEEDINGS

 Overview
 The capacity-building webinar Methodology for compiling statistics to analyse the development of small
 and medium-sized enterprises (SMEs), including at regional and local levels was the first of the three
 webinars organised within the project Improving Statistics Development in Ukraine in 2021, implemented
 with the financial and intellectual support from Poland and Israel.
 The aim of the webinar was to contribute to the development of statistics for more evidence-based SME
 policy-making in Ukraine, and to improve data comparability with the OECD member countries. The webinar
 focused on the methodology for compiling statistics to analyse the development of small and medium-sized
 enterprises. Building upon the recommendations developed in the Compendium of Enterprise Statistics in
 Ukraine 2018, this workshop aimed at sharing the best practices and methodologies in the development of
 structural business statistics in Ukraine. The webinar shed light on the development, production, and
 dissemination of SME business statistics, including at subnational level with particular reference to the
 latest European Standards.
 Following the opening remarks, the OECD experts from the Centre for Entrepreneurship, SMEs, Regions and
 Cities, OECD highlighted the importance of good quality, internationally comparable statistical data to
 measure and benchmark SME and entrepreneurship performance and why sub-national indicators are
 important to measure business dynamics for regional development.
 During the second session, experts from Statistics Poland and Israel’s Central Bureau of Statistics presented
 methodologies and best practices for developing statistics about the SME sector.
 The concluding remarks wrapped up the discussions and provided an overview of the main highlights and
 way forward to develop SME statistics in Ukraine.

 Opening remarks and introduction
The seminar was moderated by Mr Bill Tompson, Head of the Eurasia Division, OECD.
Opening remarks were delivered by H.E. Mr Bartosz Cichocki, Ambassador Extraordinary and Plenipotentiary
of Poland to Ukraine. Ambassador Cichocki highlighted the importance of co-operation between Poland,
Israel, and the OECD to improve statistics development in Ukraine. The Ambassador reminded that Poland
was the first donor of the OECD Eurasia Competitiveness Programme. He also reaffirmed the Poland’s
commitment to supporting the region’s development, and statistics development in Ukraine, in particular.
H.E. Mr Joel Leon, Ambassador Extraordinary and Plenipotentiary of Israel to Ukraine, greeted the participants
and acknowledged the significance of the partnership between the OECD and Israel to improve statistics
development in Ukraine.
Mr Vadym Pishcheiko, Advisor to the Chair at the State Statistics Service of Ukraine, welcomed the participants
and expressed his gratitude to the OECD, Poland, and Israel for supporting the State Statistics Service of
Ukraine in its efforts to align with European standards. Mr Pishcheiko noted that UkrStat will undertake the
third global assessment from Eurostat in 2021, and many actions remain to be undertaken to improve statistics
development in the country.

 Session 1: Introduction, challenges, and approaches to develop regional and sub-national SME
statistics

The first session began with a presentation on Measuring Business Demography for Regional Development
delivered by Mr Paolo Veneri, Head of the Statistics and Territorial Analysis Unit in the OECD Centre for
Entrepreneurship, SMEs, Regions and Cities. In his presentation, Mr Veneri referred to the ongoing project

 3

conducted by the OECD Centre for Entrepreneurship, SMEs, Regions and Cities since late 2016, which has sought to develop indicators to measure business demography at the sub-national level. Mr Veneri started his presentation by stating that firm dynamics are a regional phenomenon – there is a large variation in firm birth rates both between and within countries. Mr Veneri identified the spatial heterogeneity in business activity and lack of cross-country comparable data sources and indicators at the subnational level as the main motivation for conducting the project. Mr Veneri noted that this project aims to create a database of business demography at the regional level. He stressed that while developing this project, the team builds upon existing cross-country databases at the national level, based on the Eurostat-OECD Manual on Business Demography Statistics (2007) and the OECD-Eurostat Entrepreneurship Indicators Programme (2006), and the Eurostat regional database at the sub-national level. The issue of harmonisation of data across multiple sources was highlighted, stemming from differences in definitions between countries and the so-called “headquarter bias”. Here, Mr Veneri highlighted that indicators based on the location of headquarters (enterprise approach) are better suited to measure firm dynamics, while indicators based on the location of plants (establishment approach) are more suitable for examining employment in business. Mr Veneri listed the main indicators collected in the enterprise database, which included the number of active firms, birth/death/survival rates of firms, as well as some employment indicators. Mr Veneri stressed that the most important aspect is the geographic dimension, and the team has been using the classification of large (TL2) and small (TL3) regions, according to the OECD Territorial Grid. Mr Veneri noted that the project covers data from 2007 to 2018 (approximately). The key findings of the project highlight that: On average, new firms constitute around 11% of all firms, but there is a substantial regional variation. New firms are concentrated in urban and most productive regions. Higher dynamics of firms is associated with a number of characteristics, such as better local governance, more developed research and development infrastructure, lower financing constraints, and a more educated labour force. Business births create around 3.2% of new jobs. In small regions this share can be higher. Enterprise approach is susceptible to bias from a region’s actual share of national employment. Mr Veneri presented his findings showing that firm creation rates and net firm creation rates were higher in metropolitan regions. Capital regions are also particularly dynamic. A list of regional factors influencing business dynamics across OECD countries was provided, such as the quality of institutions, EU Cohesion funds in case of the EU countries, credit constraints, and human capital and innovation. Mr Veneri highlighted that the quality of local governance is positively correlated with firm creation. The OECD stressed that the challenge of having regional level breakdowns remains, with a particular difficulty in having a breakdown in size and sector. The main research and findings of this project are presented in the OECD publication. The Geography of Firm Dynamics: Measuring Business Demography for Regional Development. Ms Sandrine Kergroach, Head of the SME and Entrepreneurship Performance, Policies and Mainstreaming Unit in the OECD Centre for Entrepreneurship, SMEs, Regions and Cities presented the OECD’s approach to the determinants ofSME performance and how it monitors the SME business environment. Ms Kergroach reminded the audience that SME productivity is important as it directly relates to job creation, wages, capacity to grow and innovate, and ultimately to the economic contribution of the enterprises. The expert highlighted that the number of enterprises has significantly increased in the period between 2008 and the onset of the COVID-19 crisis in many OECD countries. Over this period some countries (the UK, France) saw the number of start-ups double, driving job creation. At the same time, Ms Kergroach emphasised that the new jobs were created primarily in low productivity sectors: for example, since 2010, around 90% of new jobs created in France were in low-wage sectors, 75% in the US, 66% in Germany and the UK. While pointing to the widening productivity gap between small and large firms, she also stressed that between 2010 and 2016, the contribution of SMEs to the value added created in knowledge-intensive services 4
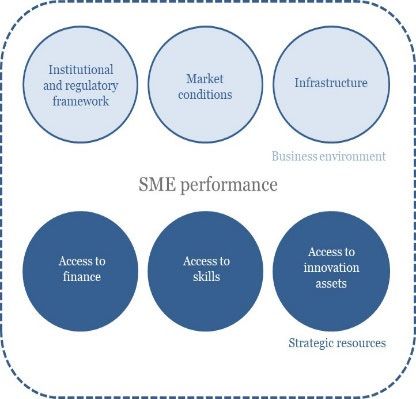
increased, and that in most countries there are SMEs that outperform large firms and are taking the lead in digital-intensive sectors. Ms Kergroach presented the “6+1 analytical framework” to use to evaluate SME and entrepreneurship performance. The first 3 pillars consider the business environment and include: Institutional and regulatory framework – taxation, competition policy, regulation effectiveness and appropriateness to SMEs, existing laws and work of courts, land and housing policies, public administration. Market conditions – domestic market, capacities to integrate into global markets, capability to access public procurement, trade, and investment opportunities. Infrastructure – digital / transport / energy infrastructure, capability to deliver to the final user market. The next three pillars, mentioned by Ms Kergroach, concern the SMEs capacity and opportunities to access strategic resources, including: Access to finance – self-funding, credits, alternative instruments, the overall functioning of the financial system. Access to skills – training and education, adult literacy, entrepreneurial culture. Access to innovation assets – capability to access data, technology, networks, R&D, and organisational business model processes. The last “+1 pillar” corresponds to the SMEs and entrepreneurship policy governance, which affects and coordinates all the other pillars. Ms Kergroach emphasised the complexity of existing policy systems characterised by: High heterogeneity of SMEs with different trajectories and active in different sectors and geographical areas. Cross-cutting issues with different policy domains, and with different ministries / departments / agencies involved. Multilevel governance –to account for the influence of local ecosystems on SMEs and subnational policies. Ms Kergroach stressed that such a complex policy space requires a whole-of-government approach to design effective SME policies, as well as building capacity and broadening the knowledge and evidence base. Lastly, Ms Kergroach referred to the OECD Scoreboard, capturing trends in the state of financing SMEs and entrepreneurs, and announced a pilot phase of disaggregated data collection that is expected to be launched in spring 2021. Ms Kergroach also mentioned the SME and Entrepreneurship Outlook, which is an OECD biennial review that uses the 6+1 pillars analytical framework, as well as the research infrastructure bringing together the indicators on SME&E performance, business conditions, policy repository, and analytical tools. Session 2: Methodologies for compiling, analysing and disseminating SME statistics in Ukraine Ms Katarzyna Walkowska, Head of Enterprises Department at Statistics Poland, opened the session by presenting the Law on Official Statistics of 29 June 1995 which remains the basis for the annual Statistical Survey Programme of Public Statistics (PBSSP) established by Statistics Poland in cooperation with ministries, National Bank of Poland, and other institutions. Ms Walkowska presented the Polish Statistical Business Register (SBR) that covers all entities conducting all kinds of activities, including the non-business sector (, financial entities, schools, non-profit organization etc.). All units in the SBR have a unique statistical number (REGON) as well as the Tax Identification Number. SBR is updated on the basis of statistical surveys and administrative data. Ms Walkowska provided a general overview of the main surveys concerning non-financial enterprises conducted by Statistics Poland, including SMEs. These include: i) monthly reports on economic activity; ii) quarterly survey on revenues, costs, financial results and outlays on fixed assets; iii) annual survey of economic 5
activity of enterprises (with specific methods of data collection depending on company size: a sample survey
for enterprises with less than 10 persons employed and an annual census survey for enterprise with 10+
persons employed). Ms Walkowska explained that the criteria for determining the size of enterprises include
the average annual employment, annual net turnover from sales and financial operations, and total assets.
Ms Walkowska provided more information about the Annual sample survey of microenterprises: the survey is
based on a sample of 4%-6% of a population of around 110 000 units with up to 9 persons employed. The
survey is based on a stratified sampling scheme in which the basic division into layers is determined according
to the predominant kind of activity, regions, legal form, size class, and year of creation. The survey comprises
data related to the basic information on the enterprise; number of persons employed and wages; fixed assets
and intangible fixed assets, as well as the size and results of the activity. Ms Walkowska also presented the
Annual census survey of enterprises with 10+ persons employed that covers the basic data about the
enterprise, full balance sheet, full profit and loss account, and fixed assets and outlays.
Ms Walkowska emphasised that basic variables are published according to size classes, legal forms, the type
of accounting records kept, the kind of activity, and the territorial division. Basic information on the structure
and economic results are presented in the annual study “Activity of non-financial enterprises” containing all
entities regardless of the size class and type of the accounting records kept. Regarding various databases used
by Statistics Poland, Ms Walkowska highlighted BDL Local Data Bank, BDM Macroeconomic Data Bank, and
DBW Knowledge Databases for Non-Financial Enterprises.
Ms Walkowska also mentioned that the Annual survey of enterprise groups covers both enterprise groups and
legal entities included in them. The data collected through the survey is also used in the Statistical Business
Register. Ms Walkowska also informed that since 2018, SBS data for Poland are elaborated on the basis of the
statistical unit enterprise being equivalent to 1 or more units.
Ms Walkowska, emphasised that the main changes and challenges faced by Statistics Poland after the
introduction of new EU regulation (Regulation (EU) 2019/2152 of the European Parliament and of the Council
of 27 November 2019 on European business statistics, repealing 10 legal acts in the field of business statistics)
were : the requirement to collect provisional data on SMEs within 10 months of the reference period (including
number of active enterprises, turnover, and number of employees), extending the NACE Rev.2 activity
breakdown to the additional service sections, restructuring data requirements for the financial and insurance
activities sector, as well as introduction of new triennial statistics on global value chains and international
sourcing.

Ms Agnes Topiol, expert from the Business Register Division of Israel Central Bureau of Statistics (ICBS) made
a presentation on How ICBS tackles SMEs, with a focus on specific types of SMEs. Ms Topiol began by noting
that the SME population in Israel plays an important role in research, development and innovation, and
provides products and services that can be sold abroad and thus overcome the limited size of the domestic
market in Israel.
Ms Topiol provided a brief overview of the process of business statistics production in Israel. She highlighted
that the Israeli Business Register (BR) is a pillar of the infrastructure to compile business statistics in the
country. The BR is based on the data from several administrative documents provided by Tax authorities and
the National Insurance Institute. Ms Topiol informed that administrative files are matched through a single
legal ID (a 9-digit number).This is a “smart ID”, providing useful insight about the types of businesses, such as
associations, foreign affiliates or branches, cooperatives, and regular businesses. Ms Topiol stressed that the
BR is the main source of information on businesses, business demography statistics and the main source used
to create sample frames and survey samples.
Ms Topiol emphasised that the types of qualitative data included in the BR (names, identifiers, address, contact
details, main activity description etc.) are similar to other business registers compiled around the world. The
Israeli BR also includes information on the Institutional Sector, which is calculated according to the System of
National Accounts 2008, as well as business characteristics of the businesses of particular interest for Israel’s
economic policy: start-ups, international R&D centres, fintechs, and others.

 6
With regards to the quantitative data contained in the BR, Ms Topiol stated that the Israeli BR includes a similar set of indicators that is used in other countries. The information on the number of employees, labour cost, revenue, and free VAT revenue is updated monthly, while the data on turnover, exports value of goods, and total balance sheet are normally updated on a yearly basis. Ms Topiol presented a list of short-term that rely on the information provided in the BR. Ms Topiol stressed that, in Israel, as in many countries, there is a focus on the topics linked to technology and globalisation. During the COVID-19 crisis, a great attention was paid to the results of the short-term survey on the consequences of lockdowns for businesses. Later, Ms Topiol provided an overview of the main business demography indicators in Israel, which includ the number of active businesses, births and deaths of businesses, business survival rate, and high growth businesses. She stressed that the SMEs are of particular importance for business statistics because the SMEs represent the large majority of businesses worldwide, they provide about 70% of the total workforce and represent more than half of the total value added in the European Union. Ms Topiol provided a brief overview of the new EU regulation on the European Business Statistics (EBS) valid as of 1 January 2021. The EBS is a new regulation covering most fields of the business statistics with the aim to make them more relevant, consistent, and comparable. Ms Topiol noted that even though Israel is not an EU country, and as such it is not bound by this regulation, it nevertheless pays careful attention to the EU statistical guidelines and methodologies to adopt the best practices and produce more comparable data. Ms Topiol highlighted that Israel is often called a “start-up nation”, as it pays a lot of attention to technological development, innovation, and R&D. Ms Topiol explained that with the analysis of SMEs in the business register, ICBS tries not only not to distinguish companies based on their size class, but also to consider other characteristics linked to the activity, the business model, and the technology used by enterprises. This would allow identifying more specific types of SMEs, and thus better target public policy to enterprises with a great potential for development, for instance to entities engaging in economic activities related to online marketplaces, fintech, or factoryless good producers. The underlying logic that underpins this effort is that while, one the one hand there is a need for stability in the methods and definitions used in compiling business statistics, on the other hand statistical tools and techniques need to evolve to detect and reflect the structural changes in the economy. To build on this, Ms Topiol presented 4 types of specific SMEs: Start-up – usually an SME which is a result of entrepreneurship based on research and development. Startups are not yet mature businesses with a good or service ready to be marketed and do not carry out profit. The start-up activities are usually funded through capital raising. International R&D center – an Israeli affiliate of a foreign multinational enterprise dedicated mainly to R&D activities. Factoryless Good Producers (FGPs) – a goods producer business which carries out R&D, marketing and sales of its goods and outsources completely the manufacturing process of the goods. Providers of service through digital platforms – all businesses that provide services directly or indirectly (through intermediaries) through a digital platform. In conclusion, Ms Topiol stressed the importance of tackling SMEs statistics to support the policymakers in developing evidence-based innovative economic policies. She emphasised that it is crucial for all the countries to boost both employment and innovation in order to “build back better” from the COVID-19 crisis. 7

Concluding remarks and next steps

H.E. Mr Haim Assaraf, Ambassador and Permanent Representative of Israel to the OECD, gave a very positive
assessment of the webinar, and thanked the OECD, and colleagues from Poland, Israel, and Ukraine for the
good co-operation to implement the project Improving Statistics Development in Ukraine.
Mr Dominik Rozkrut, President of Statistics Poland, noted that the co-operation within this project is
extremely important for Statistics Poland. He stressed that collaboration with the OECD allowed Poland to
extend its engagement in multiple development projects. Mr Rozkrut expressed particular appreciation for
the opportunity to co-operate with the colleagues from the ICBS. He also emphasised that statistics
development is crucial to ensuring the right to the truth, considered as a basic human right.
Ms Gabriela Miranda, Senior Policy Analyst and Head of Ukraine Unit, OECD, concluded the webinar by
thanking Israel and Poland for their financial and intellectual support to the project, and all the participants
for their attendance and contributions to the discussion.

 8
ANNEX A: AGENDA Please note that the timing below is based on Kyiv, Ukraine time zone (GMT+2) 10.50 - 11.00 Online access to the virtual workshop Introduction and moderation by Mr Bill Tompson, Head, Eurasia Division, OECD 11.00 - 11.15 Opening Statements H.E. Mr Bartosz Cichocki, Ambassador Extraordinary and Plenipotentiary of Poland to Ukraine H.E. Mr Joel Leon, Ambassador Extraordinary and Plenipotentiary of Israel to Ukraine Mr Vadym Pishcheiko, Advisor to the Chair, State Statistics Service of Ukraine Session 1 – Introduction, challenges and approaches to develop regional and sub-national SME statistics 11.15 – 12.00 The OECD will open the webinar stressing the importance of good quality, internationally comparable statistical data to analyse entrepreneurship and business dynamics, and why sub-national indicators are important to inform economic policies. The session will shed light on the existing challenges in producing timely and comparable statistics on firm dynamics at the subnational level. In the second part of the session, the OECD will present the measurement framework used to monitor SME and entrepreneurship performance, as well as the business environment in which firms operate. The session will highlight the various areas to cover and challenges to face to inform SME and entrepreneurship policy makers. Mr Paolo Veneri, Head of the Statistics and Territorial Analysis Unit, Centre for Entrepreneurship, SMEs, Regions and Cities, OECD Ms Sandrine Kergroach, Head of the SME and Entrepreneurship Performance, Policies and Mainstreaming Unit, Centre for Entrepreneurship, SMEs, Regions and Cities, OECD Q&A session with webinar participants Session 2 – Methodologies for compiling, analysing and disseminating SME statistics in Ukraine 12.00 – 13.00 Experts from Statistics Poland will present methodologies and best practices for developing statistics about the SME sector. This session will shed light on the statistical definitions, data sources for national and European data requirements and indicators used in the production of SME statistics. In addition, experts will present good practices in the dissemination of statistical information about the SME sector. Ms Katarzyna Walkowska, Head of Enterprises Department, Statistics Poland Practical examples presented by Poland and Q&A session with webinar participants 9
13.00 – 14.00 Experts from the Israel Central Bureau of Statistics will make a presentation on the work that the ICBS undertakes to tackle SME statistics. The presentation will have a focus on specific types of SMEs. This session will shed light upon the statistical definitions, data sources, data requirements and indicators used in the production of SME statistics. Ms Agnes Topiol, Israel Central Bureau of Statistics, Business Register Division Practical examples presented by Israel and Q&A session with webinar participants Closing remarks and next steps 14.00 - 14.15 H.E. Mr Haim Assaraf, Ambassador and Permanent Representative to the OECD, Israel Mr Dominik Rozkrut, President, Statistics Poland Ms Gabriela Miranda, Senior Policy Analyst and Head of Ukraine Unit, OECD 10
ANNEX B: QUESTION RAISED DURING THE WEBINAR Question: During the webinar, representatives from the State Statistics Service of Ukraine have asked the representative from Statistics Poland to provide further explanations on the changes to the definitions of the variables introduced as part of the new EU regulation on the European Business Statistics (EBS). Answer: In accordance with EBS, in most cases, the changes of the names of variables and the rewording of definitions does not change the economic meaning of the Structural Business Statistics (SBS) variables. The changes were introduced to create a better link between variables and accounting principles, to ease data identification in financial statements, and to create cooperation with accountants. Shorter definitions are also useful to increase understanding and accuracy, and enable better distinction between variables. This logic applies to the following EBS variables: 240202 Change in stock of finished goods and work in progress (corresponded to 13 21 3 Change in stocks of finished products and work in progress manufactured by the unit in the SBS Regulation) 220301 Employee benefits expense (corresponded to 13 31 0 Personnel costs in SBS Regulation it was) 240103 Expenses of services provided through agency workers (corresponded to 13 13 1 Payments for agency workers in the SBS Regulation) 240104 Expenses of long term rental and operating leases (corresponded to 13 41 1 Payments for long- term rental and operational leasing of goods in the SBS Regulation) 260101 Gross investment in tangible non-current assets (corresponded to 15 11 0 Gross investment in tangible goods in the SBS regulation) 260104 Gross investment in construction and improvement of buildings (corresponded to 15 14 0 Gross investment in construction and alteration of buildings in the SBS Regulation) 260103 Gross investment in the acquisition of existing buildings (corresponded to 15 13 0 Gross investment in existing buildings and structures in the SBS Regulation) 260106 Gross investment in intangible non-current assets, other than goodwill (corresponded to 15420 Gross investment in concessions, patents, licences, trademarks and similar rights in the SBS Regulation) 240201 Change in stocks of goods (corresponded to 13210 Change in stocks of goods and services in the SBS Regulation) The following variables have changed more significantly: 140301, 250101 Net turnover (in SBS Regulation it was 12 11 0 Turnover) - net turnover equals turnover as defined Regulation (EC) No 295/2008 on SBS minus excise duties and other taxes on products linked to turnover but not deductible. 250301 Value of output (in SBS Regulation it was 12 12 0 Production value) - value of output equals production value as defined for Regulation (EC) No 295/2008 plus income from product or turnover related subsidies minus other operating income (except income from product- or turnover-related subsidies) and minus excise duties and other taxes on products linked to turnover but not deductible. 250401 Value added (in SBS Regulation it was 12 15 0 Value-added at factor cost) - value added equals gross value added as defined for Regulation (EC) No 295/2008 minus other operating income adjusted with income from product- or turnover-related subsidies and, if necessary, with capitalised output plus other operating expenses than amortization expense. 11
ANNEX C: LIST OF PARTICIPANTS

Ukraine
 Last Name First Name Organisation
 Balyk Oleksandr Secretariat of the Cabinet of Ministers
 Bozhko Inna Ministry of Culture and Information Policy
 Chupakhina Natalia Ministry of Digital Transformation
 Datsko Marya Ministry for Development of Economy, Trade and Agriculture
 Holvazina Olesya Ministry of Communities and Territories Development
 Hymbel' Lesya Ministry of Culture and Information Policy
 Ishchenko Vira Secretariat of the Cabinet of Ministers
 Kolpakova Olena State Statistics Service
 Korkishko Larysa State Statistics Service
 Kostyrko Viktor State Statistics Service
 Kravchenko Olena SME Development Office
 Matronich Larysa State Statistics Service
 Melnychenko Oleksandr Secretariat of the Cabinet of Ministers
 Petroshchuk Oleksanndr Ministry of Communities and Territories Development
 Pishcheiko Vadym State Statistics Service
 Podobna Victoria State Statistics Service
 Ponomaremko Olha State Statistics Service
 Pyliuta Maryna State Statistics Service
 Rybachok Svitlana Secretariat of the Cabinet of Ministers
 Shcherban Tatiana State Statistics Service
 Solodukha Alexander State Statistics Service
 Tkachenko Victoriia Ministry for Communities and Territories Development
 Tymofeeva Olena State Statistics Service
 Usenko Vadym Ministry of Communities and Territories Development
 Vasylchuk Oleksandr Ministry for Development of Economy, Trade and Agriculture
 Voloshyn Oleksii Cabinet of Ministers
 Zakharova Tetiana State Statistics Service
 Zubko Stanyslav Ministry of Communities and Territories Development

Israel
 Last Name First Name Organisation
 Assaraf Haim Delegation of Israel to the OECD
 Bouganim Eden Central Bureau of Statistics
 Finkel Yoel Central Bureau of Statistics
 Gamburg Yaron Delegation of Israel to the OECD
 Levi Avigail Central Bureau of Statistics
 Lion Joel Embassy of Israel in Ukraine
 Mazeh Sigalit Central Bureau of Statistics
 Nir Michal Central Bureau of Statistics
 Shimony Oz Central Bureau of Statistics
 Topiol Agnes Central Bureau of Statistics
 Zisman Lior Central Bureau of Statistics

 12
Poland
Last Name First Name Organisation
Bartochowska Magdalena Statistics Poland
Chmura-Golonka Ewa Permanent Representation of the Republic of Poland to the OECD
Cichocki Bartosz Embassy of the Republic of Poland
Frac Rafal Ministry of Foreign Affairs
Jurczak Grażyna Statistics Poland
Krawczyk Piotr Permanent Representation to the OECD
Kubel Ewa Permanent Representation to the OECD
Mirosław Stępień Statistics Poland
Mongialo Dariusz Permanent Representation to the OECD
Piotrowska Anna Statistics Poland
Płatek Aneta Statistics Poland
Rolik Mateusz Embassy of Poland in Kyiv
Rozkrut Dominik Statistics Poland
Świerkot-Strużewska Olga Statistics Poland
Walkowska Katarzyna Statistics Poland

OECD
Last Name First Name Organisation
Alekseeva Anna OECD – Eurasia division
Alfonso Francesco OECD – Eurasia division
Atamer Peline OECD – Eurasia division
Chahtahtinsky Anna OECD – Eurasia division
Chan Philip OECD – Statistics and Data Directorate
Halliday Orla OECD – Eurasia division
Kergroach Sandrine OECD – Centre for Entrepreneurship, SMEs, Regions and Cities
Larrakoetxea Elisa OECD – Eurasia division
Lytvynenko Ksenia OECD – Eurasia division
Miranda Gabriela OECD – Eurasia division
Quadbeck Daniel OECD – Eurasia division
Tompson William OECD – Eurasia division
Veneri Paolo OECD – Centre for Entrepreneurship, SMEs, Regions and Cities
Will Salomé OECD – Eurasia division
zur Hausen Talisa OECD – Eurasia division

 13
ANNEX D: PRESENTATIONS

 14
26/05/2021

 OECD-Ukraine webinar

 MEASURING BUSINESS
 DEMOGRAPHY FOR REGIONAL
 DEVELOPMENT

Paolo Veneri
Deputy Head of Division
Economic Analysis, Data and Statistics
Centre for Entrepreneurship, SMEs, Local Development and Tourism

27 April 2021

Firm dynamics are a regional phenomenon
Large variation in firm birth rates between and within countries

 2

 1
26/05/2021

 Context and motivation

Spatial heterogeneity in the distribution of business activity

Lack of a cross-country comparable data source at the
subnational level

This project concerns the development and analysis of a regional
business demography database for OECD countries

 3

 This talk

1. Methodological aspects

2. Main results from the database

3. The way forward

 4

 2
26/05/2021

 Existing cross-country data sources

A cross-country BD database already exists at the national level

 Entrepreneurship Indicators Programme (2006) and
 OECD-Eurostat Manual for Business Demography
 Statistics (2007)

Regional data: Eurostat regional database (20 countries)

 5

Methodological challenges

We combine data from Eurostat with data from other OECD
National Statistical Offices

Issues with harmonisation:

• Differences in definitions from OECD/Eurostat Manual

• Enterprises VS establishments (headquarter bias)

 6

 3
26/05/2021

 Enterprises and establishments

 Different sets of indicators:

1. Indicators based on the location More useful to examine
 of firms (enterprises) firm dynamics

2. Indicators based on the location More useful to examine
 of plants (establishments) employment in business

 7

 Enterprise database: data description

 Enterprise database collects the following indicators:

 1. Active firm population
 2. Birth/death/survival rates in firms
 3. Some employment indicators

 Geographic dimension: TL2 or TL3

 Time dimension: 2007 to 2018 (on average)

 Breakdowns by sector of economic activity and by size class

 8

 4
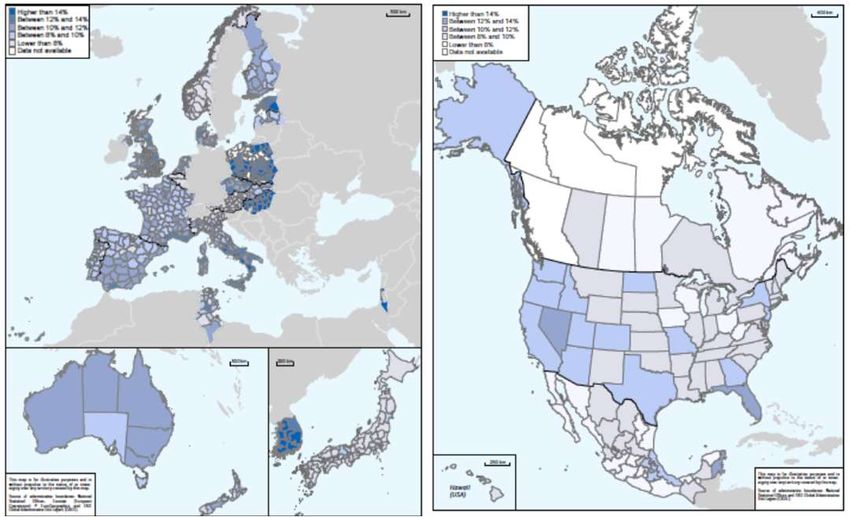
26/05/2021

 Analyzing business demography statistics

 • What type of regions experience more firm entries/exits?

 • What type of firms (according to sector or size class)
 establish in which regions?

 9

Key Findings

• New businesses constitute, on average, 11% of all firms but regional variation is
 substantial
 – Concentrated in urban and most productive regions (frontier)
 – Associated with better local governance, more developed R&D infrastructure, lower financing
 constraints, and more educated local labour force

• New businesses contribute significantly to regional employment growth
 – Business births create 3.2% new employment on average, but this share can be much higher
 in some (small) regions
 – Higher regional firm dynamics also indirectly boost employment growth in existing firms

• Exact information on location of employment is important for understanding the
 impact of business dynamics on employment
 – Using enterprise-level data can be susceptible to a bias from a region’s actual share of
 national employment
 – Headquarter bias: pronounced in capital-city regions

 5
26/05/2021

 Employer vs. non-employer firms
 Large country differences in importance of non-employer firms

 Share of employer firms by country

 • Likely a result of different tax systems and legal codes
 • Correlation of regional birth rates in employer and non-employer firms
 not always strong
 • Issue of international comparability of non-employer firms
 • Most consistent approach: compare employer firms only

 The rates of firm creation and closure tend to show
 large regional disparities
• Newly created employer firms
 make up 11% of all existing
 Firm creation rates, 2018
 employer firms in 2018
 Lowest Country average Highest
 and Warwickshire)
 Worcestershire
 (Herefordshire,

• Within-country differences are %
 City of Warsaw

 Seine-Saint-Denis
 Pest

 substantial, up to 10 pp
 City of Copenhagen

 Vukovar-Srijem County

 Agglomeratie 's-Gravenhage

 20

 – most dynamic region often
 North Estonia

 Banská Bystrica Region

 18
 El Hierro
 Ilfov

 records creation and closure
 Burgas

 North Savonia

 16
 Vilnius Region
 Caserta

 Portugal

 rates that are twice as high as 14
 Stockholm

 in the bottom region
 Vienna

 12
 Brussels Capital Region
 Prague

 Pieriga

 Alberta

 – Capital regions had 65% 10

 higher firm creation than other 8
 Akershus

 regions on average 6

 4
 – Predominantly urban regions
 have higher rates of firm 2

 creation 0
 HUN GBR POL FRA ROU DNK EST ESP BGR HRV ITA PRT FIN NLD LTU SVK AUT SWE CZE LVA CAN BEL NOR

 6
26/05/2021

 Highly urbanized places are more dynamic (higher churn)

 Firm creation rate by country and type of region (TL3, 2018)
 Metropolitan regions Regions near a metropolitan area Regions far from a metropolitan area
 %
 20

 18

 16

 14

 12

 10

 8

 6

 4

 2
 HUN EST POL GBR DNK LTU FIN SVK FRA ESP PRT NLD SWE ITA LVA AUT CZE NOR OECD

• In 16 out of 18 countries, firm creation rates were higher in metropolitan regions compared to other
 places.
• Net firm creation rates was also higher in Metropolitan regions (2% of firm population) compared to
 1.9% in Regions near a metropolitan area and 1.1% in Regions far from a metropolitan area

 Capital regions are particularly dynamic

 Firm creation rate by country and type of region (TL3, 2015)

 - In 2015, capital regions accounted for 20% of the national population but hosted
 27.5% of all firms in their respective countries.
 - On average, capital regions recorded 4.5 newly founded firms per 1000
 inhabitants compared to 2.8 new firms per 1,000 inhabitants in non-capital regions

 7
26/05/2021

 Breakdown by sector
 Urban-rural difference reflects sectoral composition of regional
 economies
 Firm creation by sector and type of region, TL3, 2015
 %
 Predominantly rural Intermediate Predominantly urban
 100

 90

 80

 70

 60

 50

 40

 30

 20

 10

 0
 Industry Construction Wholesale Transport. Accommodation Information, Finance, Professional Education Arts,
 retail trade storage and food communication insurance, services entertainment,
 real estate recreation

 - Higher firm creation rates in services, whose share is higher in urban regions
 - More than 60% of new firms in financial, information and communication sector
 - Around 40% of new firms in intermediate regions are created in the industrial sector
 15
 - In rural regions hospitality accounts for a relatively large share (20%)

 Sectors, Size and Survival of new firms
 Survival odds lower for employer firms across regions

• The share of new large employers is larger in urban frontier regions
 – Relative to their share among active firms, urban frontier regions report disproportionately large
 enterprise births of firms with more than 10 employees

• In 8 countries analysed, 49% of employer firms are still active after the first three years

 16

 8
26/05/2021

 Employment creation by new firms, TL3
 Significant within-country differences in created employment

 Employment creation rates by new employer enterprises (2018)

 Lowest Country average Highest
%
 Central Ostrobothnia

 25

 20
 Matera

 15
 Lika-Senj County
 Melilla

 French Guiana

 Nógrád

 Prešov Region
 Nordburgenland
 Zyrardowski

 West Estonia
 Gotland County
 10

 Klaipeda county
 Mehedinti
 Dobrich

 South Moravia
 Algarve

 Flevoland

 Zemgale

 Vestfold
 5

 0
 FIN ITA ESP FRA HRV HUN BGR POL ROU PRT NLD AUT SVK SWE LTU EST LVA NOR CZE

- Jobs created by new firms accounted for 3.2% of employment in 2018.

- Job creation from new firms differs on average 4 pp across regions in a
country, but some small regions can be outliers.

 The headquarter bias: differences in national
 employment shares
 Illustration with capital-city regions
 • Enterprise-level data causes a 7 percentage point upward bias in
 employment statistics of capital regions (~1.4 p.p. on average)
 ℎ
 _ = −
 ℎ

 9
26/05/2021

 Which regions are more dynamic in terms
 of business creation/destruction?

• Regional drivers of firms’ dynamics:
 What institutional/social factors are driving business
 creation/death/survival ?

 • Regional business structure: dominance of a few large firms
 • Institutions (corruption, business regulation)
 • EU Cohesion funds?
 • Credit constraints / funds
 • Human capital and R&D (innovation)

 19

 Dominance of large firms and birth rates -TL3
 Different development models in urban and rural regions

 • Entrepreneurship in urban and rural regions is differently linked to the
 local business environment and cluster formation
 • In urban areas, clusters dominated by a few champions thrive the most

 10
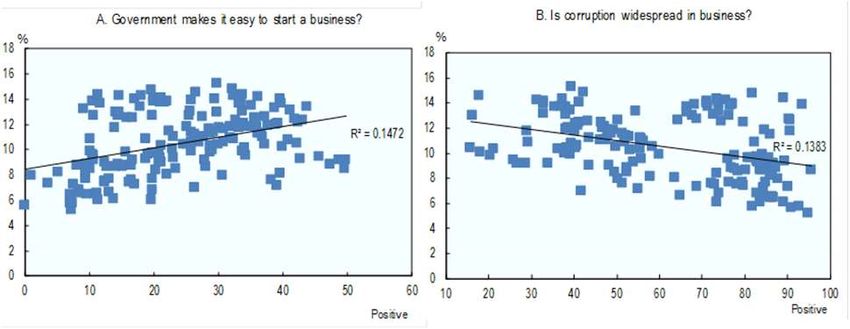
26/05/2021

 Local governance and firm birth rates
 Gallup World Poll Indicators (average 2008-2015)

 • Average birth rates between 2008 and 2015. 165 TL2 Regions of 15 countries.

 • Quality of local governance is positively correlated with firm creations

 Conclusions

• The enterprise approach allows better comparability across countries. It enhances analysis of
 entrepreneurship, but employment trends suffer from headquarter bias
• Important to distinguish employer from non-employer firms
• At the regional level, hard to have a detailed breakdown by size or sector

• Large heterogeneity in business demography across regions
 – Discrepancies between urban and rural regions
 – Differences along the lines of regional productivity

• (At least partially) explicable by regional characteristics:
 – Local governance, credit constraints, education and innovation, concentration of firms

• Monitoring regional employment creation by new firms requires precise geographic information
 – Best available data show that the contribution of new enterprises is large and very heterogeneous across regions
 – Headquarter bias can lead to deviations from actual employment creation

 11
26/05/2021

Thank you

 Website:
 http://www.oecd.org/publications/the-
 geography-of-firm-dynamics-
 9789264286764-en.htm

 Video: https://youtu.be/8fetHnC2WrU

 Contacts:
 paolo.veneri@oecd.org

 12
26/05/2021

 MEASURING & BENCHMARKING
 SMES AND ENTREPRENEURSHIP PERFORMANCE
 - BUSINESS CONDITIONS AND POLICIES -

Improving Statistics Development in Ukraine
First webinar, 27 April 2021 (virtual)

Sandrine KERGROACH
Head of SME&E Performance, Policies and Mainstreaming unit
Centre for Entrepreneurship, SMEs, Regions and Cities

 SME & Entrepreneurship performance

 Environ-
 mental,
 Social,
 Goals
 Job Wages
 creation

 Scale up
 capacity

 Produc- Corporate
 tivity purpose

 1
26/05/2021

 Prior to COVID-19, enterprise creations are
 back to pre-crisis levels (and above)

 Index (2012=100), 2010-17

 Canada Germany
 France United Kingdom
 Italy Japan
 United States
 140

 Number of start-ups 130
 doubled in the UK, and more
 120
 than doubled in France between
 2000 and 2017. 110

 100

 90

 80
 2010 2011 2012 2013 2014 2015 2016 2017

 Source: OECD (2019), OECD SME and Entrepreneurship Outlook 2019, https://doi.org/10.1787/34907e9c-en

 … driving job creation

 Employment growth in services (%), 2016

 By firm creation By firm growth
100 100
 SMEs Large firms
 75 75

50 50

 25 25

 0 0
-25 -25
-50 -50

 Source: OECD (2019), OECD SME and Entrepreneurship Outlook 2019, https://doi.org/10.1787/34907e9c-en

 Starts-ups and SMEs have driven job creation since 2010 in many OECD
 countries, especially in market services.

 2
26/05/2021 But new jobs / new firms are created in low productivity sectors Percentage of jobs created by firm births in above- and • Lower SME productivity below-median productivity sectors, 2016 results in lower wages Below-median (%) Above-median (%) ESP SMEs typically pay wages PRT GRC 20% lower than large firms. AUT TUR NLD • Since 2010, close to 90% of new SVK ITA jobs created in France were in SWE IRL low-wage sectors, 75% in the US, FRA POL 66% in Germany and the UK. DEU LUX BEL ISR HUN • The productivity gap between SVN LVA small firms and large firms has CZE EST NOR enlarged. ISL FIN • Start-ups are born smaller CHE DNK with less scope for scaling up LTU GBR capacity, innovating, increasing 100 75 50 25 0 25 50 75 100 performance etc. Source: OECD (2019), OECD SME and Entrepreneurship Outlook 2019, https://doi.org/10.1787/34907e9c-en There are SME champions, taking the lead at the knowledge frontier and in niche markets Share of SMEs in total value added of information services, 2010 and 2016 (%) 2010 2016 70 +10% in FIN and BEL in computer programming. 60 +13% in IRL and BRA in telecom. 50 40 30 20 Specialised high-skilled SMEs outperform large firms in KIBS (i.e. legal, accounting, engineering, computer, consulting, R&D, advertising (etc.). • In Sweden and the UK, micro firms in these sectors are as (or almost as) productive as large firms. 3
26/05/2021

 Firms are mainly SMEs (in some places the
 only one economic actor ?)

 6+1 pillars of SME&E performance

 Institutional
 and regulatory Market Infrastructure
 framework conditions

 Business environment

 SME&E performance

 Access to
 Access to Access to innovation
 finance skills assets

 Strategic resources

 SMEs and Entrepreneurship policy governance

Source: OECD (2019), OECD SME and Entrepreneurship Outlook 2019, https://doi.org/10.1787/34907e9c-en

 4
26/05/2021

 Detailed conceptual framework

 Regulation

 Court and
 Taxation Institutional laws
 and
 regulatory Land and
Competition
 framework housing

 Public
 governance

 SME&E performance

 Detailed conceptual framework
 Domestic
 market

 Trade and Market Global
 investment conditions markets

 Public
 procurement

 SME&E performance

 5
26/05/2021

 Detailed conceptual framework

 Logistics

 Internet
 Infrastructure Energy
 and ICT

 R&D and
 innovation

 SME&E performance

 Detailed conceptual framework

 SME&E performance

 Self-funding

 Alternative Access to
instruments finance Debt

 Financial
 system

 6
26/05/2021

Detailed conceptual framework

 SME&E performance

 Adult
 literacy

 Education
 Access to Labour
 Training skills market

 Entrepreneurial
 culture

Detailed conceptual framework

 SME&E performance

 Technology

 Data Networks
 Access to
 innovation R&D
 Marketing assets

 Organisation
 & processes

 7
26/05/2021

 Detailed conceptual framework

 Regulation Domestic
 market Logistics
 Court and
 Taxation Institutional laws
 and Trade and Market Global Internet
 Infrastructure Energy
 regulatory Land and investment conditions markets and ICT
Competition
 framework housing

 Public R&D and
 Public
 procurement innovation
 governance

 SME&E performance

 Self-funding Adult Technology
 literacy

 Education Data Networks
 Alternative Access to Access to Labour Access to
 instruments finance Debt skills market innovation R&D
 Training Marketing assets

 Financial Entrepreneurial Organisation
 system culture & processes

 SME & entrepreneurship policy governance

 8
26/05/2021 A complex policy space • Heterogeneity of SMEs, trajectories, sectors/ geographical areas • Cross-cutting issues (policy domains, ministries/departments, agencies etc.) • Multilevel governance as to account for the influence of local ecosystems on SMEs and entrepreneurship and subnational policies. Requires a whole-of-government perspective Building capacity and broadening our knowledge and evidence base Financing SMEs and entrepreneurs: An OECD Scoreboard An international reference for monitoring trends in SME&E finance and government policies. Since 2012, country coverage has expanded from 18 to 48 countries, including Ukraine. Towards more disaggregated data Aim to address the heterogeneity of the SME population and the differential impact on accessing finance. After a scoping survey on the availability of disaggregated data, the CSMEE agreed to focus the pilot of data collection on the following dimensions: • Sector (NACE Rev 2. classification) • Firm size (micro (1-9), small (10 to 49), medium (50 to 249)) • Gender of the principal owner • Geographical location (NUTS 2 level) 18 The pilot phase of disaggregated data collection will start in Spring 2021. 9
26/05/2021 SME and Entrepreneurship Outlook - A cornerstone for policy analysis OECD flagship … with an analytical … a research infrastructure biennial review… framework … OECD ‘Data lake’ on SME&E [CFE/SME(2018)2/ANN] • Indicators on SME&E performance • Indicators on SME&E business conditions • SME&E policy repository • Analytical tools Enhanced data capacity – NSOs + access microdata + business surveys … and a policy community https://doi.org/10.1787/34907e9c-en • Committee on SME&E • Informal Steering Group SMEEO • OECD committees (cooperation and mainstreaming) Better data and stronger evidence and more granularity. Thank you! https://www.oecd.org/cfe/smes/ Contact: Sandrine Kergroach sandrine.kergroach@oecd.org 10
26.05.2021

Webinar 1
Methodology for compiling statistics
to analyse the development of SMEs,
including SME at regional and local levels

Session 2
Methodologies for compiling, analysing and
disseminating SME statistics in Ukraine
Statistics Poland, Enterprises Department

 1

Legal basis for official statistics in Poland
Law on Official Statistics of 29 June 1995 (with later ammendments)
The statistical survey programme of public statistics (PBSSP):
• annual – covers all surveys for the reference year,
• established by SP in cooperation with ministries, National Bank of Poland and other
 institutions supervising and associating economic entities.
In PBSSP there are specified:
• subject,
• the leading authority or entity,
• periodicity,
• objective,
• detailed scope and subject matter,
• data sources,
• entities transferring data,
• types of result statistical information and forms and dates of their disclosure.
→ it imposes reporting obligation on respondents

 stat.gov.pl 2

 1
26.05.2021

The organisation of the surveys
The populations and samples of surveys are prepared on the basis of the statistical
business register – Statistical Business Register (BJS).
It covers all entites conducting activity, not only business activity (including e.g.
financial entities, schools, non-profit organisations, administration) and their local units.
All units in the BJS receive REGON number of the National Official Business Register
(9 digits) and are matched in the register with survey and administrative information by
REGON number and/or by Tax Identification Number (NIP).
BJS is updated on the basis of statistical surveys and administrative data according to
the established timetable.
The respondents are legal units.
Data are collected via Reporting Portal in an electronic form, but if the unit has less
than 5 persons employed, than it is allowed to provide data on paper form.
At the Reporting Portal the first validations are done, in cooperation with the reporting
unit (if necessary).

 stat.gov.pl 3

 Main surveys concerning non-financial
 enterprises – general overview
 Main surveys on non-financial enterprises,
 including SME

 Survey of
 Quarterly survey of entrepreneurship
 Monthly report on revenues, costs and Annual survey of
 economic activity
 financial results as well economic activity
 as of outlays on fixed of enterprises Annual survey of newly
 assets established enterprises

 annual census
 SME without survey (10 and sample survey of Annual survey of
 microenterpises more persons microenterprises entities with foreign
 employed) capital
 - IFATS

 Annual survey of
 STS SBS, IFATS activity of enterprises
 with shares in entities
 located abroad
 - OFATS

 Annual survey of
 enterprise groups

 stat.gov.pl 4

 2
26.05.2021

 SME in Poland
 Medium
 0,7%
 Small
 2,2% Large
 0,2%
 Micro
 Number of enterprises 97,0%

 Micro Small Medium Large
 Number of persons employed 41,2% 10,4% 15,7% 32,6%

 Micro Small Medium Large
 Total revenues 25,3% 11,7% 18,4% 44,7%

 Micro Small Medium Large
 Gross financial result
 52,0% 11,3% 11,4% 25,3%

 Micro Small Medium Large
Outlays on tangible fixed assets 17,9% 8,0% 17,8% 56,3%

 Micro Small Medium Large
 Value of production 31,7% 9,5% 15,9% 42,9%

 0% 50% 100%

 stat.gov.pl 5

 Criteria for determining the size of enterprises
 Commission Recommendation of 6 May 2003 concerning the definition of
 micro, small and medium-sized enterprises

 Entrepreneur’s law of 6 March 2018 Micro Small Medium

 Average annual employment
You can also read