Improved Performance of Compartments in Detecting the Activity of Axial Spondyloarthritis Based on IVIM DWI with Optimized Threshold b Value ...
←
→
Page content transcription
If your browser does not render page correctly, please read the page content below
Hindawi
BioMed Research International
Volume 2022, Article ID 2276102, 9 pages
https://doi.org/10.1155/2022/2276102

Research Article
Improved Performance of Compartments in Detecting the
Activity of Axial Spondyloarthritis Based on IVIM DWI with
Optimized Threshold b Value

          Qiang Ye, Zhuoyao Xie, Chang Guo, Xing Lu, Kai Zheng, and Yinghua Zhao
          Department of Radiology, The Third Affiliated Hospital of Southern Medical University (Academy of Orthopedics,
          Guangdong Province), Guangzhou, Guangdong 510630, China

          Correspondence should be addressed to Yinghua Zhao; zyh7258957@163.com

          Received 16 October 2021; Revised 12 December 2021; Accepted 18 December 2021; Published 10 January 2022

          Academic Editor: Ernesto Roldan-Valadez

          Copyright © 2022 Qiang Ye et al. This is an open access article distributed under the Creative Commons Attribution License,
          which permits unrestricted use, distribution, and reproduction in any medium, provided the original work is properly cited.

          Purpose. To explore the diagnostic performance of the optimized threshold b values on IVIM to detect the activity in axial
          spondyloarthritis (axSpA) patients. Method. 40 axSpA patients in the active group, 144 axSpA patients in the inactive group,
          and 20 healthy volunteers were used to evaluate the tissue diffusion coefficient (Dslow ), perfusion fraction (f ), and
          pseudodiffusion coefficient (Dfast ) with b thresholds of 10, 20, and 30 s/mm2. The Kruskal-Wallis test and one way ANOVA
          test was used to compare the different activity among the three groups in axSpA patients, and receiver operating characteristic
          (ROC) curve analysis was applied to evaluate the performance for Dslow , f , and Dfast to detect the activity in axSpA patients,
          respectively. Results. Dslow demonstrated a statistical difference between two groups (P < 0:05) with all threshold b values. With
          the threshold b value of 30 s/mm2, f could discriminate the active from control groups (P < 0:05). Dslow had similar
          performance between the active and the inactive groups with threshold b values of 10, 20, and 30 s/mm2 (AUC: 0.877, 0.882,
          and 0.881, respectively, all P < 0:017). Using the optimized threshold b value of 30 s/mm2, f showed the best performance to
          separate the active from the inactive and the control groups with AUC of 0.613 and 0.738 (both P < 0:017) among all
          threshold b values. Conclusion. Dslow and f exhibited increased diagnostic performance using the optimized threshold b value
          of 30 s/mm2 compared with 10 and 20 s/mm2, whereas Dfast did not.

1. Introduction                                                             Magnetic resonance imaging (MRI) is an imaging
                                                                       modality of choice for assessing disease activity in axSpA
Axial spondyloarthritis (axSpA) is a chronic inflammatory               [5]. Furthermore, disease activity in axial spondyloarthritis
disease involving predominantly the sacroiliac joints (SIJ),           (axSpA) has been longitudinally associated with SIJ inflam-
the axial skeleton, and entheses [1], ultimately leading to sig-       mation on MRI [6]. Le Bihan et al. [7] reported that the
nificant disability and loss of social function [2]. According          intravoxel incoherent motion (IVIM) diffusion-weighted
to data from multiple countries, the incidence of axSpA is             imaging (DWI), respectively, measured the pure diffusion
0.4-14 per 100,000 person-years [3]. However, no available             coefficient (Dslow ), perfusion-related incoherent microcircu-
agents have demonstrated a disease-modifying effect in                  lation coefficient (Dfast ), and perfusion fraction (f ). The dif-
axSpA [4]. Hence, an increasing number of treatment trials             fusion of molecules is restricted in sacroiliitis since increased
in axSpA are being conducted, heralding the potential avail-           protein-rich fluids and inflammatory cells accumulate
ability of more effective treatments in the future. To make it          within the lesion in axSpA. The perfusion is also known to
possible for the comparison between trials of different                 be raised because of the higher amount of blood or serum
agents, a noninvasive and quantitative method for evaluating           of capillary transported to the marrow cavity within the
the disease activity of patients with axSpA is highly desirable.       lesion in axSpA [8]. So, IVIM DWI was mainly proposed
2 BioMed Research International
to functionally and qualitatively diagnose the activity of In this section, five standard MRI sequences were obtained:
axSpA [9]. But there has been much controversy surround- (a) Dixon fat-water separation coronal TSE T1WI (TSE
ing the roles of Dfast and f for separating the active from T1WI mDixon), (b) Dixon fat-water separation coronal
nonactive patients with axSpA [10–12]. TSE T2WI (TSE T2WI mDixon), (c) axial T1-weighted tur-
In previous studies, quantitative metrics of IVIM were bine spin echo (T1-TSE), (d) axial T2-weighted spectral
turned out to be not very accurate, partially due to the lim- attenuated inversion recovery (T2W-SPAIR), and (e) axial
ited sampling, low signal-to-noise ratio (SNR) for fast data IVIM DWI (Table 1). IVIM DWI was based on a single-
acquisition, diffusion gradient polarity, and so on [13, 14]. shot DW spin-echo echo-planar imaging (EPI) with scan-
First of all, some studies confirmed that segmented- ning time of 182 seconds.
unconstrained analysis should be preferred in the cases of
a limited number of b values and finite SNRs. Tissue param- 2.3. Image Postprocessing and Measurement Analysis. A pro-
eters derived from IVIM analysis depend on the threshold b fessional image postprocessing workstation with high com-
value. With the analysis of data sampled from healthy indi- puting power (PRIDE DWI Tool, IDL Virtual Machine
viduals, the optimal threshold b value for liver IVIM analysis Version 6.3, Philips Healthcare, Japan) was used to calculate
has been reported [15]. It had been demonstrated that the complex image algorithm problems. The MRI medical
optimal threshold b value of 60 s/mm2 could potentially pro- images were imputed to the image postprocessing worksta-
vide better detection for liver fibrosis than threshold b values tion for further processing.
of 40, 80, 100, 150, and 200 s/mm2 [16]. However, the opti- Two radiologists with 10 and 3 years of experience in
mal threshold b value for sacroiliitis IVIM analysis is still musculoskeletal MRI interpretation were involved for the
unclear. Therefore, in the current study, we explored how recognition of lesions and delineation of ROIs indepen-
the selection of threshold b value impacts f , Dslow , and dently, and then all parameters were acquired from IVIM
Dfast values and how threshold b value impacts IVIM tech- DWI. Patients’ clinical information were blinded to either
nique’s performance to detect the activity of axSpA patients. radiologist. Intra- and interobserver agreement for 40 ran-
dom patients (20 in the active group and 20 in the inactive
group) were evaluated using the intraclass correlation coeffi-
2. Materials and Methods cient (ICC) by the two radiologists. ICCs ≥ 0:75 were consid-
2.1. Study Population. This prospective study was approved ered to be excellent and used for further analysis. The
by our Institute Ethics Committee, and written informed radiologist with 10 years of experience was responsible for
consent was obtained from all participants (IRB number measuring the remaining IVIM DW image data.
AN16327-001). According to the Assessment of Spondyloar- For the axSpA patients with visible bone marrow edema
thritis International Society criteria for axSpA [17], all (BME) in SIJs on conventional MR images, only one free-
patients diagnosed with axSpA were enrolled during the hand region of interest (ROI) was drawn in the largest lesion
period from August 2017 to August 2019. The patients of sacroiliitis on the axial map. If the area of BME was not
underwent erythrocyte sedimentation rate (ESR), C- large enough to draw an ROI, those patients will be included
reactive protein (CRP), and Spondyloarthritis Disease Activ- in the Non-BME group. For the Non-BME group, ROIs
ity Score (ASDAS). Within a week after the laboratory tests were placed in the subchondral lesions in the sacrum or
and clinical assessments, an MRI examination of the sacroil- the ilium. To reduce the impact of ROI on our results, the
iac joints was performed using 3.0 T scanner. The exclusion size of each ROI was chosen to be as large as possible with
criteria were defined as follows: (1) participants with contra- the exclusion of the blood vessels, adjacent bone cortex, cys-
indications cannot be scanned by MRI scanner; (2) patients tic areas, necrosis, and fat metaplasia. For the healthy volun-
with axial axSpA had peripheral joint involvement, such as teers, ROIs were placed in the subchondral marrow in the
hip, shoulder, and knee joints; (3) patients without IVIM middle areas of the sacrum or the ilium along the SIJs. The
DWI examination; and (4) MR images with low signal-to- mean area of ROI was 24.08 mm2 (range 18.5-36.7 mm2).
noise ratio (SNR). Based on ASDAS and CRP [18], all And then, the same ROIs were automatically replicated
patients with AS were classified as the active and inactive and pasted on the corresponding area on the Dfast and f
groups according to the following: the active group, maps at the same level. At last, the same ROI masks were
ASDAS-CRP ≥ 1:3, and the inactive group, ASDAS-CRP < propagated to all the other b values images (Figure 1).
1:3 [19]. Meanwhile, 20 male healthy volunteers (16 males, According to the IVIM DWI theory proposed by Le
4 females; mean age 26:20 ± 5:71 years, range 21-47 years; Bihan et al. [7], DWI based on multiple b values is imple-
mean weight 72:85 ± 20:40 kg, range 48–130 kg; mean height mented in a biexponential model as
173:8 ± 7:15 cm, range 168–190 cm) were enrolled as the
control group. The volunteers were included with the cri- Sb
= ð1 − f Þ exp ð−b DslowÞ + f exp ð−b DfastÞ, ð1Þ
teria: (1) without a history of low back pain or trauma and S0
(2) without a metallic foreign body.
where Sb represented the signal intensity of the pixel when
2.2. MR Imaging Techniques. A 3.0Tesla Achieva MR imag- the diffusion gradient is on and S0 represents the signal inten-
ing system (Philips Healthcare, Best, Netherlands) equipped sity of the pixel when the diffusion gradient is off [20]. Dslow
with 32 channels body phased array coil was performed to was obtained by a simplified linear fitting equation with b
enable the acquisition of high-resolution medical images. values higher than 200 s/mm2 as Equation (2) [21]:BioMed Research International 3
Table 1: Summary of MRI scan parameters.
Sequences TSE T1WI mDixon TSE T2WI mDixon T1-TSE T2W-SPAIR IVIM DWI
Plane Coronal Coronal Axial Axial Axial
TR/TE (ms) 569/20 2300/85 500/10 5200/70 4000/63.5
Thickness (mm) 3 3 6 5 4
Field of view (mm) 230 × 332 230 × 319 332 × 353 300 × 400 300 × 360
Intersection gap (mm) 0.5 0.5 1 0.5 1
SENSE factor 2.6 2 1.8 2.3 2.8
Matrix 272 × 325 288 × 394 272 × 343 236 × 406 100 × 120
Number of signal average (NSA) 1 1.5 1 1.2 2
IVIM DWI was based on b values = 0, 10, 20, 30, 50, 600, and 800 s/mm2.
b = 0 s/mm2 b = 10 s/mm2 b = 20 s/mm2 b = 30 s/mm2
b = 50 s/mm2 b = 600 s/mm2 b = 800 s/mm2 b = 0 s/mm2
(a)
0.0
–0.2
–0.5
Log (s/s0)
–0.7
–1.0
–1.2
0.0 160.0 320.0 480.0 640.0 800.0
b-loctor (s/mm)
(b)
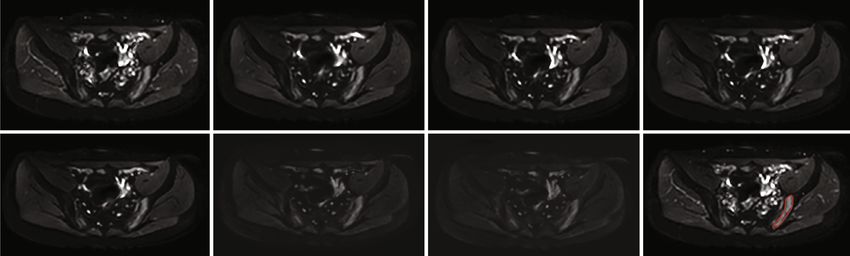
Figure 1: (a) Demonstration of diffusion-weighted images with 7 b values from a patient with axial spondyloarthritis (axSpA) and a region
of interest (ROI) drawn in the lesion area on DWI of b = 0 s/mm2. (b) The relationship between signals and b values for the lesion in the
sacroiliac joint.4 BioMed Research International
1‐SSE Table 2: Summary of axSpA patients’ characteristics.
R2 = ð2Þ
SStotal
Parameter Active group Inactive group P value
Age (y) 29:95 ± 9:92 28:25 ± 9:03 0.31
was applied to assess the consistency of fit, where SSE indi- Gender (male/female) ∗
31/9 106/38 0.62
cates the error sum of squares between the fitted curve and
data and SStotal is defined as the total sum of squares between Disease duration (m) 54:90 ± 62:42 45:37 ± 46:69 0.37
all the calculated values and their overall average. ESR (mm/h) 29:24 ± 24:58 10:27 ± 9:81BioMed Research International 5 Table 4: Comparison of Dslow , f , and Dfast of patients in the active, inactive, and control groups using different threshold b values. Parameter Active group Inactive group Control group P Threshold b = 10 s/mm 2 Dslow (10-3 mm2/s) 0:953 ± 0:300 0:405 ± 0:171# 0:286 ± 0:080#,∗
6                                                                                                                BioMed Research International

                        Table 5: ROC curve analysis for Dslow , f , and Dfast in the active, inactive, and control groups.

                                                                                                             Inactive group-control group AUC
             Active group-inactive group AUC [cutoff Active group-control group AUC [cutoff
Parameter                                                                                                   [cutoff value] (sensitivity, specificity,
             value] (sensitivity, specificity, accuracy) value] (sensitivity, specificity, accuracy)
                                                                                                                          accuracy)
Threshold b = 10 s/mm2
Dslow (10-                  0.877 [0.654]                                  0.981 [0.501]                                 0.778 [0.307]
3
 mm2/s)                 (0.825, 0.840, 0.837)                         (0.875, >0.999, 0.900)                         (0.701, 0.750, 0.707)
                                                                           0.551 [8.510]                                 0.548 [8.614]
f (%)                        0.499 [-] (-)
                                                                       (0.875, 0.350, 0.700)                         (0.840, 0.350, 0.780)
Dfast (10-
3                            0.283 [-] (-)                                 0.145 [-] (-)                                  0.283 [-] (-)
  mm2/s)
Threshold b = 20 s/mm2
Dslow (10-                  0.882 [0.578]                                  0.981 [0.538]                                 0.776 [0.298]
3
 mm2/s)                 (0.900, 0.806, 0.821)                         (0.900, >0.999, 0.933)                         (0.757, 0.700, 0.756)
                           0.595 [25.343]                                 0.632 [25.164]                                0.565 [13.669]
f (%)
                        (0.475, 0.757, 0.696)                          (0.475, 0.850, 0.600)                         (0.833, 0.350, 0.774)
Dfast (10-
3                       0.306 [-] (-)                                      0.214 [-] (-)                                  0.352 [-] (-)
  mm2/s)
Threshold b = 30 s/mm2
Dslow (10-              0.881 [0.605]                                      0.980 [0.519]                                 0.794 [0.304]
3
  mm2/s)            (0.875, 0.833, 0.842)                             (0.900, >0.999, 0.933)                         (0.722, 0.750, 0.720)
                       0.613 [13.743]                                     0.738 [14.486]                                0.644 [14.474]
f (%)
                    (0.875, 0.410, 0.512)                              (0.800, 0.750, 0.783)                         (0.576, 0.750, 0.598)
Dfast (10-
3                       0.316 [-] (-)                                      0.205 [-] (-)                                  0.346 [-] (-)
  mm2/s)
Data are areas under the curve. Numbers in parentheses are cutoff values. AUC: area under the curve; ROC: receiver operating characteristic; Dslow : pure
diffusion coefficient; f : perfusion fraction; Dfast : pseudoperfusion coefficient.

groups with threshold b values of 10, 20, and 30 s/mm2 (all                   DWI with threshold b values of 10, 20, and 30 s/mm2. We
P ≥ 0:05).                                                                    confirmed that the optimal threshold b value was 30 s/
                                                                              mm2. Using the optimal threshold b value of 30 s/mm2,
3.3. ROC Curve Analysis for Parameters Derived from IVIM                      Dslow provided the best performance to detect the activity
DWI for the Detection of the Activity in axSpA Patients.                      in axSpA patients, and f showed the moderate performance
Table 5 and Figure 3 show the three-group ROC analysis of                     to discriminate the axSpA patients in the active stage from
IVIM parameters using threshold b values of 10, 20, and 30 s/                 those in the inactive stage, while the disease activity could
mm2. Dslow demonstrated the most perfect differentiation                       not be diagnosed by Dfast in axSpA patients.
between the active and the control groups with high AUC values                    In our study, a large sample size of 184 patients was ana-
with threshold b values of 10, 20, and 30 s/mm2 (0.981, 0.981,                lyzed, and thus, the results based on the optimal threshold b
and 0.980, respectively). And it achieved accuracy of 0.900,                  values were more persuasive for the detection of the axSpA
0.933, and 0.933 with sensitivity of 0.875, 0.900, and 0.900 and              activity in sacroiliitis. Previous studies confirmed that, with a
specificity of 1.000, 1.000, and 1.000, respectively. Also, it pro-            carefully selected threshold b value, the error could be reduced
vided moderate performance to discriminate active groups from                 in the measurement of parameters from IVIM DWI [22, 23].
inactive groups and inactive groups from control groups with                  However, it is demonstrated that the optimal threshold b value
medium AUC values with threshold b values of 10, 20, and                      is dependent on the location of the body, such as 40 s/mm2 in
30 s/mm2. f only showed the moderate performance to separate                  breast cancer and 100 s/mm2 in cervical adenocarcinoma [24,
the active group from the control groups with the medium AUC                  25]. In this study, we found the optimal threshold for sacroilii-
value of 0.738 and the cutoff value of 14.486% utilizing the opti-             tis was 30 s/mm2 in axSpA patients, which has not seen
mal threshold b value of 30 s/mm2. With the increasing of the                 reported. Compared with the threshold b values of 10 and
threshold b value (from 10 to 30 s/mm2), the AUC among three                  20 s/mm2, a b value of 30 s/mm2 increases the AUC (cutoff
groups also increased. Dfast presented low performance (all                   value) for perfusion parameters (f and Dfast ) between the
AUC < 0:35) with threshold b values of 10 and 30.                             active and the inactive groups (the result is provided in
                                                                              Table 5 and also shown in Figure 3). Previous studies showed
4. Discussion                                                                 that f and Dfast had no statistical differences between the active
                                                                              and inactive groups in axSpA patients, so perfusion parame-
Our study investigated the performance of Dslow , f , and Dfast               ters derived from IVIM DWI could not be used to distinguish
to detect the activity in patients with axSpA using IVIM                      the active from the inactive axSpA patients [10]. However, our
BioMed Research International 7
Active group-inactive group Active group-control group Inactive group-control group
1.0 1.0 1.0
0.8 0.8 0.8
Dslow (10−3 mm2/s)
0.6
Sensitivity
0.6 0.6
Sensitivity
Sensitivity
0.4 0.4 0.4
0.2 0.2 0.2
0.0 0.0 0.0
0.0 0.2 0.4 0.6 0.8 1.0 0.0 0.2 0.4 0.6 0.8 1.0 0.0 0.2 0.4 0.6 0.8 1.0
1 - specificity 1 - specificity 1 - specificity
1.0 1.0 1.0
0.8 0.8 0.8
Sensitivity
0.6
Sensitivity
0.6
Sensitivity
0.6
f (%)
0.4 0.4 0.4
0.2 0.2 0.2
0.0 0.0 0.0
0.0 0.2 0.4 0.6 0.8 1.0 0.0 0.2 0.4 0.6 0.8 1.0 0.0 0.2 0.4 0.6 0.8 1.0
1 - specificity 1 - specificity 1 - specificity
1.0 1.0 1.0
0.8 0.8 0.8
Dslow (10−3 mm2/s)
Sensitivity
Sensitivity
Sensitivity
0.6 0.6 0.6
0.4 0.4 0.4
0.2 0.2 0.2
0.0 0.0 0.0
0.0 0.2 0.4 0.6 0.8 1.0 0.0 0.2 0.4 0.6 0.8 1.0 0.0 0.2 0.4 0.6 0.8 1.0
1 - specificity 1 - specificity 1 - specificity
b = 10 s/mm2 b = 30 s/mm2
b = 20 s/mm2 Reference line
Figure 3: The receiver operating characteristic (ROC) curve for Dslow , f , and Dfast in the active, inactive, and control groups (threshold b
value: 30 s/mm2).
results confirmed that the activity could be detected by f in perfusion or diffusion to Dslow or f /Dfast are considered to
axSpA patients and the AUC for f was 0.613 (13.743) between be neglect. In our study, the results of Dslow presented dif-
the active and the inactive groups with the threshold b values ferences in the same way for the three different cases; how-
of 30 s/mm2. This improvement was expected to be potential ever, there is no statistical difference between them. We
clinical values for detecting the activity of the axSpA patients. considered that the threshold b values of 10, 20, and 30 s/
Furthermore, which is due to the different effect on mm2 effected on diffusion to Dslow . Recently, several studies
Dslow from the threshold b values of 10, 20, and 30 s/ suggested that this threshold b value may be too high as the
mm2. Therefore, the results for Dslow presented in turning point of a biexponential model is generally around
Figure 2 should be identical. The authors should explain 50 s/mm2 [15]. Our results also suggested a b value of 30 s/
why there are differences. b value = 200 s/mm2 has been mm2 should be selected for separating active patients with
popularly used to detect the disease activity of axSpA axSpA from inactive ones, which also corresponds to the
patients for the IVIM DWI threshold [8, 12]. When using turning point of the biexponential model for the IVIM
a threshold b value of 200 s/mm2, the contributions of the DWI fitting curve.8 BioMed Research International
So far as we know, it remains unclear whether f can SIJ: Sacroiliac joints
identify the axSpA activity using the full IVIM model [12]. MRI: Magnetic resonance imaging
In this study, we disclosed that f may have the ability to AxSpA: Axial spondyloarthritis
detect the axSpA activity with the optimal threshold b value SNR: Signal-to-noise ratio
of 30 s/mm2. Active sacroiliitis increases the ratio of extracel- IRB: Institutional review board
lular water to intracellular water and the movement of water ESR: Erythrocyte sedimentation rate
molecules, which is also associated with increased microvas- CRP: C-reactive protein
cular perfusion[26]. In previous studies, Dslow has been con- ASDAS: Spondyloarthritis disease activity score
firmed to be the most reliable parameter among the three ROI: Region of interest
parameters (Dslow , f , and Dfast ) for detecting the activity of ICC: Intraclass correlation coefficient
sacroiliitis in axSpA patients [8, 10, 11, 27]. Although the b BME: Bone marrow edema
value of 0 s/mm2 was excluded in our measurements, Dslow SSE: Sum of squares due to error
with threshold b values of 10, 20, and 30 s/mm2 was still SPSS: Statistical product and service solutions
the most effective indicator of disease activity. f and Dfast IBM: International business machines
in the IVIM model is related to perfusion [28]. The optimal SD: Standard deviation
threshold b value dramatically improved the diagnostic per- ROC: Receiver operating characteristic
formance for f . Dfast demonstrated the poor diagnostic per- BMD: Bone mineral density.
formance despite using any threshold b value, in agreement
with the result reported for the full IVIM model by Li et al. Data Availability
[15]. This result can be explained that Dfast tends to be
unstable unless an unrealistically high signal-to-noise ratio All the data related to this study are mentioned in the man-
(SNR) is achieved to an SNR of >122.48, while f can reach uscript. Any further data if required may be obtained on
to be steady at a moderate SNR of 40.48 [29]. Thereby, a request from the corresponding author.
combination of Dslow and f with the optimal threshold value
of 30 s/mm2 could supply more accurate information to Conflicts of Interest
detect the axSpA activity.
The authors declare no conflicts of interest.
Several limitations remained in current our study.
Firstly, taking scanning times for patients into account, the
relatively fewer numbers of 7 b values were utilized to probe
Authors’ Contributions
threshold b values in this study, which might reduce the Qiang Ye and Zhuoyao Xie contributed equally to this work.
accuracy of the parameters from IVIM DWI. Generally,
the optimal b value distribution could dramatically amplify Acknowledgments
IVIM parameter reliability, and the number of threshold b
values ranging from 6 to 12 is even suggested to be the min- This paper is supported by the National Natural Science
imal applied number in liver disease detection [30, 31]. Sec- Foundation of China (Grant No. 81871510).
ond, the relationship between bone mineral density (BMD)
and IVIM parameters is not covered in our study. Some References
studies believe that IVIM parameters are affected by
BMD[32, 33]. Hence, an investigation of the influence of [1] W. Zhu, X. He, K. Cheng et al., “Ankylosing spondylitis: etiol-
BMD on IVIM DWI is desirable in sacroiliitis in the future. ogy, pathogenesis, and treatments,” Bone Research, vol. 7,
Thirdly, b values that be selected and evaluated for the biex- no. 1, 2019.
ponential algorithm in this study are quite arbitrary and [2] J. Braun and T. Pincus, “Mortality, course of disease and prog-
empirical, which violates the free distribution of parameters. nosis of patients with ankylosing spondylitis,” Clinical and
Experimental Rheumatology, vol. 20, 6, Supplement 28,
In future studies, more b values will be studied and
pp. S16–S22, 2002.
evaluated.
[3] J. Braun and J. Sieper, “Ankylosing spondylitis,” The Lancet,
In conclusion, this study confirmed that Dslow has been
vol. 369, no. 9570, pp. 1379–1390, 2007.
confirmed to be the most reliable parameter among the three
[4] P. C. Robinson, R. Sengupta, and S. Siebert, “Non-radio-
parameters (Dslow , f , and Dfast ) for detecting the activity of graphic axial spondyloarthritis (nr-axSpA): advances in Clas-
sacroiliitis in axSpA patients. f will promisingly increase sification, Imaging and Therapy,” Imaging and Therapy.
the diagnostic accuracy of the axSpA activity to improve Rheumatology and Therapy, vol. 6, no. 2, pp. 165–177, 2019.
treatment for patients with axSpA using the optimal thresh- [5] C. Tsoi, J. F. Griffith, R. K. L. Lee, P. C. H. Wong, and L. S.
old b value of 30 s/mm2, whereas Dfast will not. Tam, “Imaging of sacroiliitis: current status, limitations and
pitfalls,” Quantitative Imaging in Medicine and Surgery,
Abbreviations vol. 9, no. 2, pp. 318–335, 2019.
[6] V. Strand and J. A. Singh, “Evaluation and management of the
IVIM: Intravoxel incoherent motion patient with suspected inflammatory spine disease,” Mayo
DWI: Diffusion-weighted imaging Clinic Proceedings, vol. 92, no. 4, pp. 555–564, 2017.
axSpA: Axial spondyloarthritis [7] D. Le Bihan, E. Breton, D. Lallemand, P. Grenier, E. Cabanis,
AUC: Area under the curve and M. Laval-Jeantet, “MR imaging of intravoxel incoherentBioMed Research International 9
motions: application to diffusion and perfusion in neurologic [21] D. Le Bihan, E. Breton, D. Lallemand, M. L. Aubin, J. Vignaud,
disorders,” Radiology, vol. 161, no. 2, pp. 401–407, 1986. and M. Laval-Jeantet, “Separation of diffusion and perfusion in
[8] J. Qin, J. Li, H. Yang et al., “Values of intravoxel incoherent intravoxel incoherent motion MR imaging,” Radiology,
motion diffusion weighted imaging and dynamic contrast- vol. 168, no. 2, pp. 497–505, 1988.
enhanced MRI in evaluating the activity of sacroiliitis in anky- [22] J. A. U. Perucho, H. C. C. Chang, V. Vardhanabhuti et al., “B-
losing spondylitis of rat model,” Magnetic Resonance Imaging, value optimization in the estimation of intravoxel incoherent
vol. 68, pp. 30–35, 2020. motion parameters in patients with cervical cancer,” Korean
[9] L. A. Bradbury, K. A. Hollis, B. Gautier et al., “Diffusion- Journal of Radiology, vol. 21, no. 2, pp. 218–227, 2020.
weighted imaging is a sensitive and specific magnetic reso- [23] O. Jalnefjord, M. Montelius, G. Starck, and M. Ljungberg,
nance sequence in the diagnosis of ankylosing spondylitis,” “Optimization of b-value schemes for estimation of the diffu-
The Journal of Rheumatology, vol. 45, no. 6, pp. 771–778, 2018. sion coefficient and the perfusion fraction with segmented
[10] Y. H. Zhao, S. L. Li, Z. Y. Liu et al., “Detection of active sacroi- intravoxel incoherent motion model fitting,” Magnetic Reso-
liitis with ankylosing spondylitis through intravoxel incoher- nance in Medicine, vol. 82, no. 4, pp. 1541–1552, 2019.
ent motion diffusion-weighted MR imaging,” European [24] A. S. Becker, J. A. Perucho, M. C. Wurnig et al., “Assessment of
Radiology, vol. 25, no. 9, pp. 2754–2763, 2015. cervical cancer with a parameter-free intravoxel incoherent
[11] Y. Zhao, Q. Zhang, W. Li et al., “Assessment of correlation motion imaging algorithm,” Korean Journal of Radiology,
between intravoxel incoherent motion diffusion weighted vol. 18, no. 3, pp. 510–518, 2017.
MR imaging and dynamic contrast-enhanced MR imaging of [25] W. Chen, J. Zhang, D. Long, Z. Wang, and J. M. Zhu, “Optimi-
sacroiliitis with ankylosing spondylitis,” BioMed Research zation of intra-voxel incoherent motion measurement in
International, vol. 2017, Article ID 8135863, 9 pages, 2017. diffusion-weighted imaging of breast cancer,” Journal of
[12] H. Sun, K. Liu, H. Liu et al., “Comparison of bi-exponential Applied Clinical Medical Physics, vol. 18, no. 3, pp. 191–199,
and mono-exponential models of diffusion-weighted imaging 2017.
for detecting active sacroiliitis in ankylosing spondylitis,” Acta [26] M. Zhang, L. Zhou, N. Huang, H. Zeng, S. Liu, and L. Liu,
Radiologica, vol. 59, no. 4, pp. 468–477, 2018. “Assessment of active and inactive sacroiliitis in patients with
[13] H. A. Dyvorne, N. Galea, T. Nevers et al., “Diffusion-weighted ankylosing spondylitis using quantitative dynamic contrast-
imaging of the liver with MultiplebValues: effect of diffusion enhanced MRI,” Journal of magnetic resonance imaging: JMRI,
gradient polarity and breathing acquisition on image quality vol. 46, no. 1, pp. 71–78, 2017.
and intravoxel incoherent motion Parameters—A pilot study,” [27] H. T. Sanal, S. Yilmaz, I. Simsek et al., “Apparent diffusion
Radiology, vol. 266, no. 3, pp. 920–929, 2013. coefficients of sacroiliitis in patients with established ankylos-
[14] C. Vieni, B. Ades-Aron, B. Conti et al., “Effect of intravoxel ing spondylitis,” Clinical Imaging, vol. 37, no. 4, pp. 734–739,
incoherent motion on diffusion parameters in normal brain,” 2013.
Neuro Image, vol. 204, p. 116228, 2020. [28] F. Wang, Y. Wang, Y. Zhou et al., “Comparison between types
[15] Y. T. Li, J. P. Cercueil, J. Yuan, W. Chen, R. Loffroy, and Y. X. I and II epithelial ovarian cancer using histogram analysis of
Wáng, “Liver intravoxel incoherent motion (IVIM) magnetic monoexponential, biexponential, and stretched-exponential
resonance imaging: a comprehensive review of published data diffusion models,” Journal of magnetic resonance imaging:
on normal values and applications for fibrosis and tumor eval- JMRI, vol. 46, no. 6, pp. 1797–1809, 2017.
uation,” Quantitative Imaging in Medicine and Surgery, vol. 7, [29] J. Pekar, C. T. Moonen, and P. C. van Zijl, “On the precision of
no. 1, pp. 59–78, 2017. diffusion/perfusion imaging by gradient sensitization,” Mag-
[16] Y. X. J. Wáng, Y. T. Li, O. Chevallier et al., “Dependence of netic Resonance in Medicine, vol. 23, no. 1, pp. 122–129, 1992.
intravoxel incoherent motion diffusion MR thresholdb-value [30] M. C. Wurnig, O. F. Donati, E. Ulbrich et al., “Systematic anal-
selection for separating perfusion and diffusion compartments ysis of the intravoxel incoherent motion threshold separating
and liver fibrosis diagnostic performance,” Acta radiologica, perfusion and diffusion effects: proposal of a standardized
vol. 60, no. 1, pp. 3–12, 2019. algorithm,” Magnetic resonance in medicine, vol. 74, no. 5,
[17] M. Rudwaleit, D. van der Heijde, R. Landewe et al., “The devel- pp. 1414–1422, 2015.
opment of assessment of SpondyloArthritis international soci- [31] E. E. ter Voert, G. Delso, M. Porto et al., “Intravoxel incoherent
ety classification criteria for axial spondyloarthritis (part II): motion protocol evaluation and data quality in normal and
validation and final selection,” Annals of the Rheumatic Dis- malignant liver tissue and comparison to the literature,” Inves-
eases, vol. 68, no. 6, pp. 777–783, 2009. tigative Radiology, vol. 51, no. 2, pp. 90–99, 2016.
[18] J. Sieper, M. Rudwaleit, X. Baraliakos et al., “The Assessment of [32] D. Yeung, S. Wong, J. F. Griffith, and E. Lau, “Bone marrow
SpondyloArthritis international Society (ASAS) handbook: a diffusion in osteoporosis: evaluation with quantitative MR dif-
guide to assess spondyloarthritis,” Annals of the rheumatic dis- fusion imaging,” Journal of Magnetic Resonance Imaging,
eases, vol. 68, Suppl 2, pp. ii1–ii44, 2009. vol. 19, no. 2, pp. 222–228, 2004.
[19] M. N. Magrey and U. Kiltz, “Chapter 9- clinical assessment of [33] N. Ohno, T. Miyati, H. Kasai et al., “Evaluation of perfusion-
axial Spondyloarthritis,” in Khan MA, Editors, P. Mease, Ed., related and true diffusion in vertebral bone marrow: a prelim-
pp. 121–133, Elsevier, Axial Spondyloarthritis, 2019. inary study,” Radiological Physics and Technology, vol. 8, no. 1,
[20] D. Le Bihan, R. Turner, and J. R. Macfall, “Effects of intravoxel pp. 135–140, 2014.
incoherent motions (IVIM) in steady-state free precession
(SSFP) imaging: application to molecular diffusion imaging,”
Magnetic Resonance in Medicine, vol. 10, no. 3, pp. 324–337,
1989.You can also read