Impact of sweet, umami, and bitter taste receptor (TAS1R and TAS2R) genomic and expression alterations in solid tumors on survival
←
→
Page content transcription
If your browser does not render page correctly, please read the page content below
www.nature.com/scientificreports
OPEN Impact of sweet, umami, and bitter
taste receptor (TAS1R and TAS2R)
genomic and expression alterations
in solid tumors on survival
1*
Ryan M. Carey , TaeBeom Kim2, Noam A. Cohen1,3, Robert J. Lee1,4 & Kevin T. Nead2,5
Originally identified on the tongue for their chemosensory role, the receptors for sweet, umami, and
bitter taste are expressed in some cancers where they regulate important cellular processes including
apoptosis and proliferation. We examined DNA mutations (n = 5103), structural variation (n = 7545),
and expression (n = 6224) of genes encoding sweet or umami receptors (TAS1Rs) and bitter receptors
(TAS2Rs) in 45 solid tumors subtypes compared to corresponding normal tissue using The Cancer
Genome Atlas and the Genotype Tissue Expression Project databases. Expression of TAS1R and TAS2R
genes differed between normal and cancer tissue, and nonsilent mutations occurred in many solid
tumor taste receptor genes (~ 1–7%). Expression levels of certain TAS1Rs/TAS2Rs were associated
with survival differences in 12 solid tumor subtypes. Increased TAS1R1 expression was associated with
improved survival in lung adenocarcinoma (mean survival difference + 1185 days, p = 0.0191). Increased
TAS2R14 expression was associated with worse survival in adrenocortical carcinoma (−1757 days,
p < 0.001) and esophageal adenocarcinoma (−640 days, p = 0.0041), but improved survival in non-
papillary bladder cancer (+ 343 days, p = 0.0436). Certain taste receptor genes may be associated with
important oncologic pathways and could serve as biomarkers for disease outcomes.
Sweet and bitter taste receptors, T1Rs and T2Rs respectively, are G-protein-coupled receptors (GPCRs) first
identified in type 1 and 2 taste cells on the t ongue1. The T1R family, and associated TAS1R genes, consists of 3
isoforms including TAS1R1, TAS1R2, and TAS1R3 located on the short arm of human chromosome 11,2. T1Rs
function as heterodimers (i.e. T1R1+3 and T1R2+3) to bind a variety of ligands including sucrose and amino
acids for detection of umami (T1R1+3) and sweet (T1R2+3) t aste3,4. There are 25 human T2R isoforms encoded
by TAS2R genes located on chromosomes 5, 7, and 1 21,5–7. T2Rs are activated by bitter compounds and signal
through Gα-mediated cAMP decrease, Gβγ-activation of phospholipase C, and downstream calcium (Ca2+)
release8–11. T1Rs and T2Rs have considerable genetic variability with many common polymorphisms that influ-
ence human taste preferences for foods11–13 like green leafy v egetables14, coffee15, and grapefruit16.
T2Rs and T1Rs are expressed in normal tissue outside of the oral cavity including in the airway epithelia17,18,
thyroid19, lung20, and gastrointestinal (GI) t ract21,22, where they have a diverse array of functions. Nasal epithelial
cells express functional T2Rs that bind bacterial quorum-sensing molecules to activate Ca2+-mediated nitric oxide
production to clear p athogens23. T1Rs in specialized airway solitary chemosensory cells sense changes in airway
surface liquid glucose concentration to modulate bactericidal T2R r esponses17,18. More recently, taste receptors
have also been investigated in several cancers including G I24–30, pancreatic31,32, breast33, thyroid34, acute myeloid
leukemia35, and head and neck squamous cell carcinoma36. For example, single nucleotide polymorphisms (SNPs)
in TAS2R38 which lead to different haplotypes and taste perception have been shown to be broadly associated
with overall cancer risk37 and risk of GI24,25,28 and colorectal26 malignancies specifically. In head and neck squa-
mous cell carcinoma, T2Rs in tumor cells bind bitter bacterial metabolites to activate apoptosis, and patients
with increased tumor expression of TAS2Rs appear to have improved overall s urvival36. Bitter agonists trigger
1
Department of Otorhinolaryngology – Head and Neck Surgery, Hospital of the University of Pennsylvania,
3400 Spruce Street, 5th floor Ravdin Suite A, Philadelphia, PA 19104, USA. 2Department of Epidemiology, The
University of Texas MD Anderson Cancer Center, Houston, TX, USA. 3Philadelphia Veterans Affairs Medical Center,
Philadelphia, PA, USA. 4Department of Physiology, University of Pennsylvania Perelman School of Medicine,
Philadelphia, PA, USA. 5Department of Radiation Oncology, The University of Texas MD Anderson Cancer Center,
Houston, TX, USA. *email: ryan.carey@pennmedicine.upenn.edu
Scientific Reports | (2022) 12:8937 | https://doi.org/10.1038/s41598-022-12788-z 1
Vol.:(0123456789)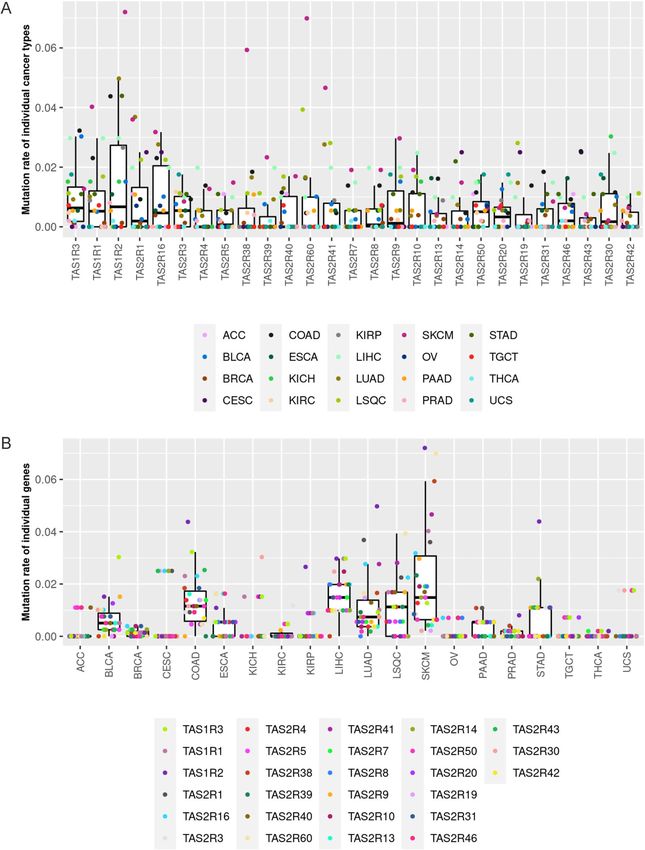
www.nature.com/scientificreports/
apoptosis and/or mitochondrial depolarization in other cancer cells as w ell38–40, including metastatic breast
cancer41, prostate cancer42, and acute myeloid leukemia cells35.
We hypothesized that TAS2R and TAS1R genetic and expression alterations are common in various solid
tumors and that these changes are associated with clinical outcomes. To gain further insight into taste receptor
genetics in malignancy, we compared TAS1Rs and TAS2Rs in solid tumors to corresponding normal tissue using
data derived from The Cancer Genome Atlas (TCGA)43,44 and the Genotype Tissue Expression Project (GTEx)45
databases46. We focused on differential expression (DE), mutations, and copy number variations for 20 types of
solid tumors, including 45 subtypes, and investigated associations with gene expression and survival outcomes.
Our findings identify several taste receptors that could serve as potential biomarkers for oncologic outcomes or
therapeutic targets, warranting further exploration.
Methods
Data source. We utilized previoulsy published data on GPCRs from Sriram et al. (https://insellab.github.
io/)46, derived from TCGA43,44 and the GTEx databases45, and data directly from TCGA obtained from cBioPor-
tal (https://www.cbioportal.org/). Twenty types of solid tumors, including 45 histologic subtypes, were compared
to corresponding normal tissue from the same anatomic sites. The GPCR genes examined included the 3 TAS1R
and 24 of the 25 TAS2R genes (excluding TAS2R45 which encodes an orphan receptor and did not have data
available). This study was determined to be institutional review board exempt by the University of Pennsylvania.
Differential expression analysis. Gene expression analysis between tumor and normal tissue was based
on RNA-seq data derived from TCGA43,44 and the G TEx45. The methods used for data curation, DE analysis, and
comparison of gene expression in tumors and normal tissue are previously d escribed46. Gene expression data
were available in transcripts per million (TPM), which is a normalization of gene abundance that corrects for
effective gene length, and counts per million (CPM), which is the number of times a gene is encountered per
million reads. TPM data were used for comparisons of different genes within a tumor dataset. CPM data were
utilized for comparing gene expression between samples from separate datasets that may have been normalized
differently.
Mutation and copy number variation analysis. Mutation and copy number variation data sources
and analysis are previously described46. Specifically, mutational data were obtained from the Baylor College of
Medicine sequencing center and Broad Institute Automated Pipeline and included somatic, nonsilent mutations
(gene-level) and somatic mutations (SNPs and small INDELs). Copy number estimates were obtained from
TCGA and included homozygous/two-copy deletion, heterozygous/single-copy deletions, no change, low-level
amplification, and high-level amplification.
Statistical analysis. Analyses were conducted in R version 4.0.3 (2020-10-10). RNA data were processed
by R package edgeR. Exact tests47 were used to estimate the fold-change (FC) in gene expression in tumors com-
pared to normal tissue. A median tumor expression cutoff of > 0.001 TPM and log2 FC > log2(1.5) or < log2(1/1.5)
were used. Gene changes with a false discovery rate (FDR) of < 0.05 were considered to be statistically significant.
Normalized expression data for tumors and normal tissue were plotted as median expression and upper and
lower quartiles.
Tumor samples were divided into high expression (above-median) and low expression (below-median) groups
for survival comparisons. The difference in mean survival days was calculated for the high and low expression
groups for different tumors. Kaplan–Meier survival analyses and Peto-Peto’s modified survival estimates were
performed for comparisons of genes identified as having statistically significant differences in mean survival
days for patients with clinical data available from cBioPortal (https://www.cbioportal.org/). Combined expres-
sion analyses were performed using a mean-normalized sum of expression of genes that individually predicted
survival. A p-value < 0.05 was considered statistically significant for survival analyses. The prognostic effectiveness
of gene expression data in the solid tumors was assessed using receiver operating characteristic (ROC) curves.
ROC curve analysis was performed in R software using procedures from the ‘pROC’ package. The median CPM
used in the Kaplan–Meier survival curves were used as the cutoffs for analysis.
Ethics approval and consent to participate. This study was determined to be institutional review
board exempt by the University of Pennsylvania.
Consent for publication. Not applicable.
Results
TAS1R and TAS2R genes are differentially expressed in solid tumors. DE analysis of TAS1Rs and
TAS2Rs was performed for 6,224 individual tumors from 45 solid tumor subtypes and compared to correspond-
ing normal anatomic tissue. There were statistically significant differences in median tumor expression of multi-
ple TAS1Rs and TAS2Rs across multiple cancers (Fig. 1). Most tumor subtypes had DE of at least one TAS1R/2R
gene, and a numerically higher number of cancers studied had decreased gene expression rather than increased
expression. TAS2R4, TAS2R5, TAS2R14, TAS2R19, TAS2R20, and TAS2R31 were frequently expressed at lower
levels in tumors compared to normal tissue; whereas, TAS1R3 and TAS2R38 were often expressed at higher lev-
els. Other genes including TAS1R1 showed increased and decreased expression depending on the tumor type.
Scientific Reports | (2022) 12:8937 | https://doi.org/10.1038/s41598-022-12788-z 2
Vol:.(1234567890)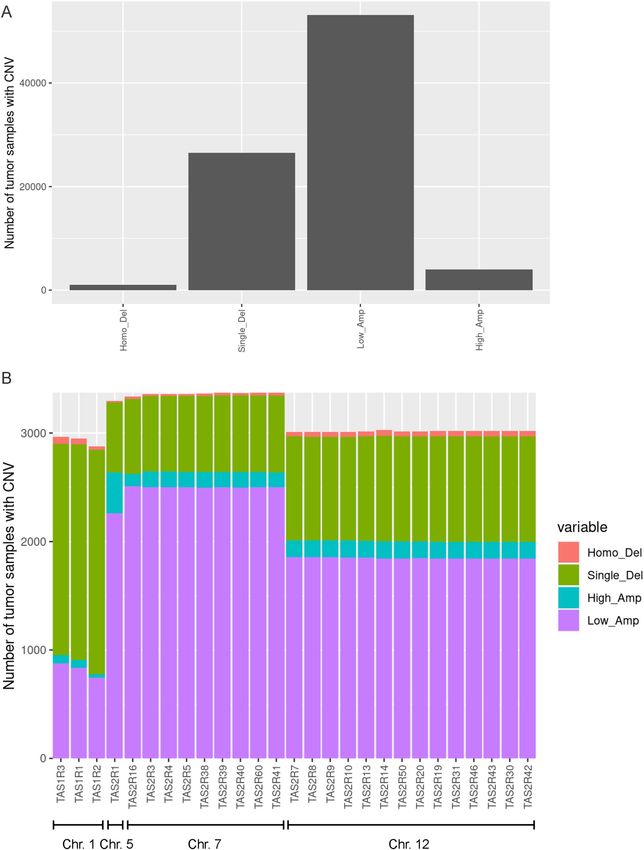
www.nature.com/scientificreports/
Figure 1. Multiple TAS1R and TAS2R genes are differentially expressed in solid tumors. To determine the
differential expression of genes, RNA sequencing data for solid tumor tissues from The Cancer Genome Atlas
(TCGA) were compared to corresponding normal tissues from the Genotype Tissue Expression Project (GTEx)
database. (A) Table showing the solid tumors surveyed for TAS1R/2R differential expression analysis with
TCGA cancer type, subtype/histology, and associated abbreviations. The number of TAS1R/2Rs with statistically
significant changes in expression are listed for each tumor subtype compared to normal tissue with log2 fold
change cutoff > log2(1.5) used for increased expression and < log2(1/1.5) for decreased expression (FDR < 0.05,
median TPM > 0.001). (B) Heatmap demonstrating log2 fold-change of TAS1R/2R expression in 45 solid tumor
subtypes compared to corresponding normal tissue with hierarchical clustering of differential expression.
Increased expression shown in green and decreased expression in red. DE differential expression; FDR false
discovery rate; GTEx Genotype Tissue Expression Project; TPM Transcripts Per Million; TCGAThe Cancer
Genome Atlas; aLSQC is abbreviated as LUSC in some sources.
Supplemental Fig. 1 shows the median expression in CPM for detectable TAS1R/2Rs between normal and
malignant tissues. In addition to the notable differences across malignancy types, these data also demonstrate the
expression of taste receptors across normal tissues outside of the oral cavity and the variability that exists between
normal tissues. TAS1R/TAS2R expression in TPM for each tumor type is shown in Supplemental Fig. 2. Within
the same anatomic sites, there is variability in the expression levels of different TAS1Rs and TAS2Rs. Expression
level variability follows similar patterns for cancer and normal tissue, with certain receptors consistently elevated
or decreased relative to others. Supplemental Fig. 3 shows median expression in TPM and the log2 fold-change
for tumors compared to normal tissue.
Somatic mutations and copy number variation in TAS1R and TAS2R genes. Analysis of TAS1R
and TAS2R mutations performed for all solid tumors with data available (n = 5103) showed that nonsilent muta-
tions occur in these genes (Fig. 2). Across all tumor types, the median percentage of tumors with nonsilent
mutations in TAS1Rs, including TAS1R1, TAS1R2, TAS1R3, was slightly less than 1%. Similarly, the TAS2Rs had
a median percentage of tumors with nonsilent mutations less than 1% (Fig. 2A).
The proportion of tumors with nonsilent TAS1R and TAS2R mutations varied for each cancer type with skin
melanoma having the highest rate of mutations overall (Fig. 2A, B). Specifically, nonsilent mutation rates in skin
melanoma were approximately 7% for TAS1R2 and TAS2R60, 6% for TAS2R38, and 4.5% for TAS2R41. In liver
hepatocellular carcinoma, the 3 TAS1Rs were each mutated in about 3% of individuals. TAS1R2 was mutated in
roughly 5% of lung, colon, and stomach adenocarcinomas and TAS2R60 was mutated in ~ 4% of lung squamous
cell carcinomas.
The types of somatic mutations in taste receptors for each solid tumor type are shown in Fig. 3A and Supple-
mental Fig. 4. For most tumors, missense mutations were the most common types of somatic mutations followed
Scientific Reports | (2022) 12:8937 | https://doi.org/10.1038/s41598-022-12788-z 3
Vol.:(0123456789)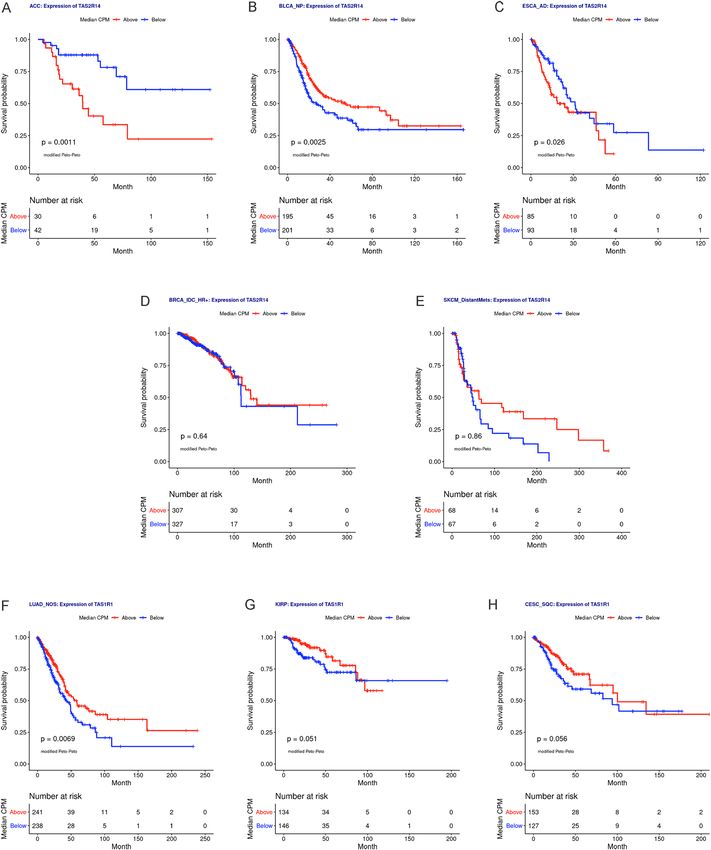
www.nature.com/scientificreports/
Figure 2. Somatic mutations in TAS1R and TAS2R genes in solid tumors. Analysis of nonsilent mutations in
TAS1R and TAS2R genes for different TCGA solid tumor types (n = 5103 for 20 tumor types with data available),
stratified by (A) gene and (B) cancer type. Dots represent the mutation rates in each tumor type or TAS1R/2R
gene. ACCAdrenocortical Cancer; BLCA bladder cancer; BRCAbreast cancer; CESC Cervical Cancer; COAD
colon adenocarcinoma; ESCA esophageal cancer; KICH Kidney Chromophobe; KIRC kidney clear cell
carcinoma; KIRP kidney papillary cell carcinoma; LIHC liver hepatocellular carcinoma; LSQC lung squamous
cell carcinoma; LUAD lung adenocarcinoma; OV ovarian cancer; PAAD pancreatic ductal adenocarcinoma;
PRAD prostate adenocarcinoma; SKCM skin cutaneous melanoma; TCGAThe Cancer Genome Atlas; TGCT
testicular germ cell tumor, THCA thyroid cancer; UCS Uterine Carcinosarcoma.
Scientific Reports | (2022) 12:8937 | https://doi.org/10.1038/s41598-022-12788-z 4
Vol:.(1234567890)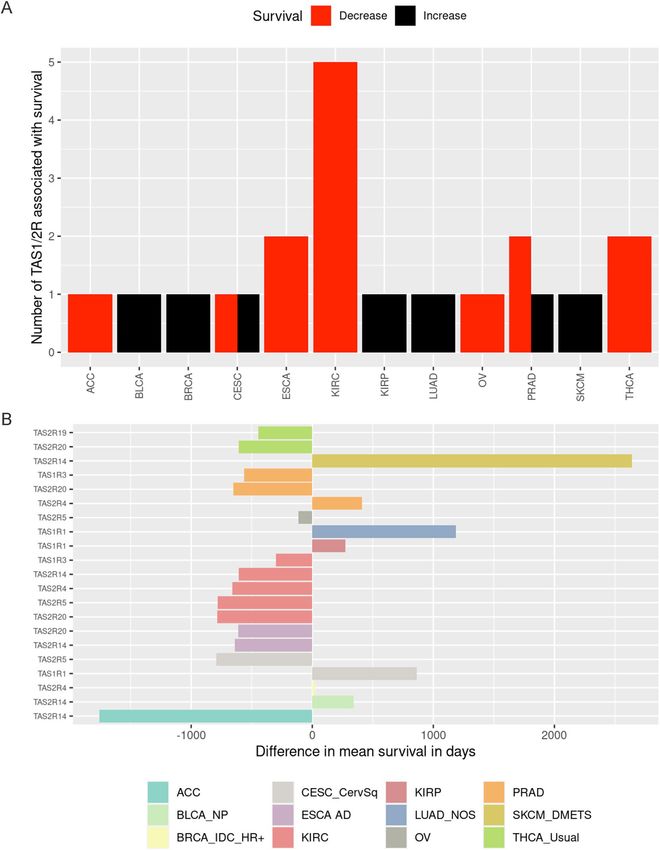
www.nature.com/scientificreports/
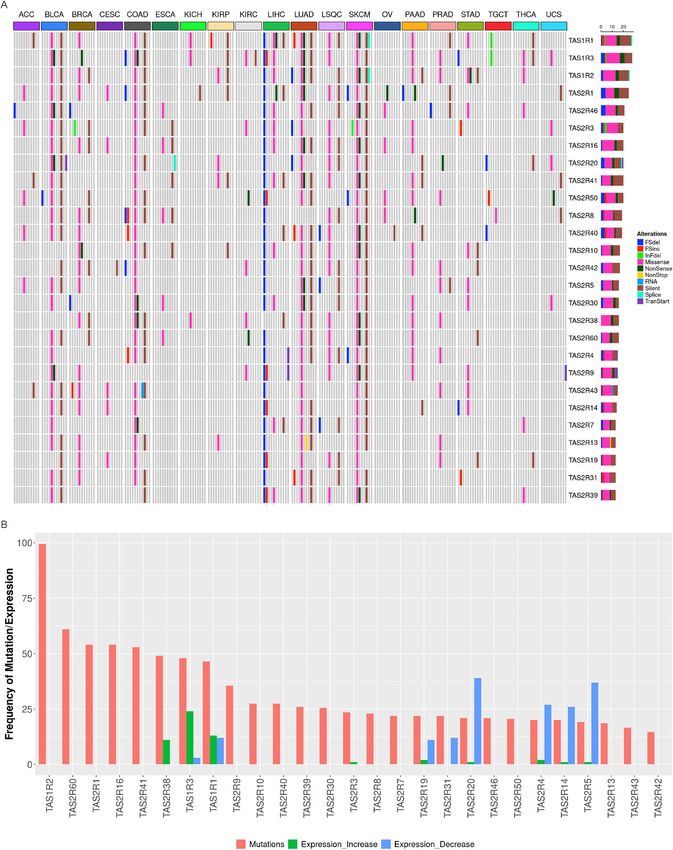
Figure 3. TAS1R and TAS2R mutation types in solid tumors and correlation of gene mutations with expression.
(A) Mutation landscape showing the different mutation types for TAS1R and TAS2R genes for different TCGA
solid tumor types (n = 5103 for 20 tumor types with data available). (B) Graph demonstrating the number of
tumors with nonsilent taste receptor mutations and the frequency of increased or decreased expression for the
same receptor. ACCAdrenocortical Cancer; BLCA bladder cancer; BRCAbreast cancer; CESC Cervical Cancer;
COAD colon adenocarcinoma; ESCA esophageal cancer; KICH Kidney Chromophobe; KIRC kidney clear cell
carcinoma; KIRP kidney papillary cell carcinoma; LIHC liver hepatocellular carcinoma; LSQC lung squamous
cell carcinoma; LUAD lung adenocarcinoma; OV ovarian cancer; PAAD pancreatic ductal adenocarcinoma;
PRAD prostate adenocarcinoma; SKCM skin cutaneous melanoma; TCGAThe Cancer Genome Atlas; TGCT
testicular germ cell tumor, THCA thyroid cancer; UCS Uterine Carcinosarcoma.
Scientific Reports | (2022) 12:8937 | https://doi.org/10.1038/s41598-022-12788-z 5
Vol.:(0123456789)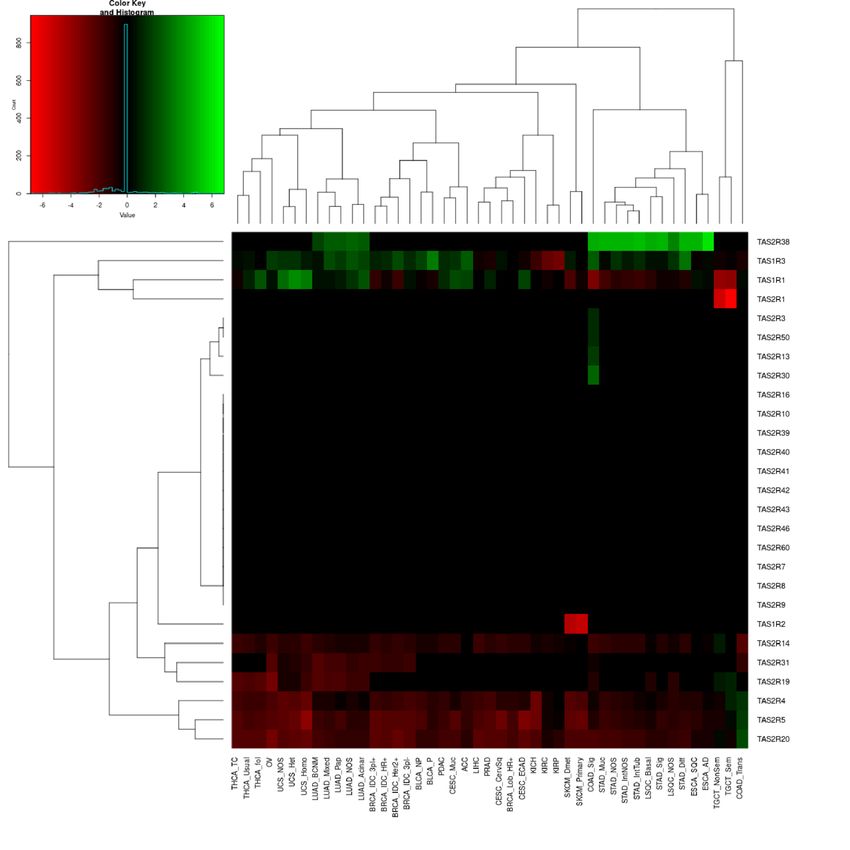
www.nature.com/scientificreports/
by silent mutations. Liver hepatocellular carcinoma, which had prevalent mutations in the 3 TAS1R genes located
on chromosome 1, was unique for its relatively high proportion of frame shift deletions relative to the other
malignancies. Figure 3B demonstrates the number of tumors with nonsilent taste receptor mutations and the
frequency of increased or decreased expression for the same receptor. The frequency of increased or decreased
taste receptor expression in tumors does not clearly correlate with the frequency of mutations.
CNV analysis was performed for TAS1R and TAS2R genes in 7,545 individual samples from 20 tumor types
(Fig. 4). Overall, low-amplification was the most common type of CNV followed by single copy deletions
(Fig. 4A). However, for TAS1Rs, single copy deletions were more common than low-amplifications (Fig. 4B).
The CNV pattern appeared to cluster based on the chromosome location of the different taste receptor genes. The
mutation and CNV analyses indicate that there are alterations in taste receptor genes that occur in malignancy.
TAS1R and TAS2R expression is associated with survival. After demonstrating that taste receptor
genetic and expression alterations occur in various solid tumors, we sought to determine if these genes served
as prognostic markers for clinical outcomes. By comparing tumors with high and low expression of specific
taste receptor genes (defined as above or below the median expression, respectively), we found that expression
of at least one TAS1R or TAS2R was statistically significantly associated with mean survival differences in 12
subtypes of solid tumors (Fig. 5A). When examining statistically significant associations, higher gene expression
was most commonly associated with shorter mean survival times (n = 14) compared to longer survival times
(n = 7). Increased gene expression in the following taste receptor genes had negative survival associations (i.e.
higher expression correlating with worse survival) in at least one tumor histology: TAS1R3, TAS2R14, TAS2R19,
TAS2R20, TAS2R4, and TAS2R5. Positive survival associations (i.e. higher expression correlating with improved
survival) were identified for TAS1R1, TAS2R14, and TAS2R4 in at least one malignancy.
The degree of survival impact was determined by calculating the difference in mean survival days between
above- and below-median expression groups for TAS1R and TAS2R genes in different tumors as shown in Fig. 5B
and Supplemental Table 1. The most dramatic positive survival association was present in melanoma distant
metastases for TAS2R14 with the high-expression group surviving a mean 2641 days (~ 7.2 years) longer than
the low-expression group (p = 0.0127). Adrenocortical carcinoma had the largest negative survival association
for TAS2R14 with mean survival difference of −1757 days (p = 0.0007). TAS1R1 had profound positive survival
associations in lung adenocarcinoma–not otherwise specified (mean difference 1185 days, p = 0.0191) and cervi-
cal squamous cell carcinoma (mean difference 862 days, p = 0.0098).
We performed Kaplan–Meier survival analyses for any taste receptor genes identified as having statisti-
cally significant mean survival differences between high and low expression groups and highlighted the most
frequently associated bitter taste receptor, TAS2R14 and umami taste receptor, TAS1R1 (Fig. 6). Kaplan–Meier
survival analyses for high- and low-expression groups of TAS2R14 were statistically significantly associated
with survival for adrenocortical cancer (p = 0.0011), non-papillary bladder cancer (p = 0.0025), and esophageal
adenocarcinoma (p = 0.026; Fig. 6A–E). Kaplan–Meier survival analyses for high- and low-expression groups
of TAS1R1 was statistically significant for lung adenocarcinoma (p = 0.0069) but not for kidney papillary cell
carcinoma (p = 0.051) or cervical esophageal squamous cell carcinoma (p = 0.056, Fig. 6F–H).
Kaplan–Meier analysis of kidney clear cell carcinoma showed significant survival associations for high and
low expression groups for TAS1R3 (p = 0.0062), TAS2R4 (p = 0.015), TAS2R5 (p = 0.0029), TAS2R14 (p < 0.001),
and TAS2R20 (p < 0.001) and the mean-normalized sum of expression of these genes that individually predicted
survival (p < 0.001, Supplemental Fig. 5). Additional Kaplan–Meier survival curves for expression of TAS2Rs,
TAS1Rs, and combined taste receptor gene groups are shown in Supplemental Fig. 6. Notably, statistically signifi-
cant survival associations were identified for TAS2R5 in cervical squamous cell carcinoma (p < 0.001), TAS2R20
in esophageal adenocarcinoma (p = 0.044), and TAS2R4, TAS2R20, and TAS1R3 in prostate adenocarcinoma
(p = 0.03, p = 0.033, and p = 0.023, respectively).
Prognostic roles of TAS2R14 and TAS1R1 for survival. The median CPM expression cutoffs used in
the Kaplan–Meier survival curves from Fig. 6 were used to generate ROC curves to assess the prognostic roles
of TAS2R14 and TAS1R1 in certain solid tumors (Fig. 7). The ROC curves demonstrated that these genes had
different specificity and sensitivity for predicting survival of solid tumor patients. The area under the receiver
operating characteristics was highest for TAS2R14 in adrenocortical cancer with associated sensitivity 65.4% and
specificity 71.7%. The predictive role of the other evaluated genes was relatively poor.
Discussion
Despite being best known for their role in taste sensing1, T2Rs and T1Rs have been identified in various extra-
oral tissues where they serve diverse chemosensory r oles17–22,48. Emerging data on the role of taste receptors in
malignancy led us to explore the genetic and expression alterations for solid tumors and implications on survival.
T2Rs have been studied in some c ancers24–29,31–36, but we are the first to show their expression across numerous
types of solid cancer tissues using data from TCGA. Our demonstration of TAS1R expression in solid tumors is
also highly novel, as there are no prior reports in the literature to our knowledge.
Using the GTEx data, we verified previous studies showing taste receptor expression in normal, extra-oral
human tissues such as the lung20, GI tract21,22, and s kin49,50. TAS2R14 was detected at relatively high levels in
many normal tissues in our study which is consistent with prior expression analyses including work in human
embryonic kidney (HEK) 293 cell lines and human epidermal keritoncytes where T2R14 is functional and serves
as a chemosensory r eceptor51,52. Our data on normal tissue expression provides a key resource for exploring
potential taste receptor pathways in physiologically normal tissue.
Scientific Reports | (2022) 12:8937 | https://doi.org/10.1038/s41598-022-12788-z 6
Vol:.(1234567890)www.nature.com/scientificreports/
Figure 4. Copy number variation (CNV) in TAS1R and TAS2R genes in solid tumors. (A–B) Graphical
representations of CNV in TAS1R and TAS2R genes for 20 tumor types (n = 7545) including the total number
of homozygous deletions, single-copy deletions, low-level amplifications, and high-level amplifications. Data is
shown for (A) all TAS1R and TAS2R genes and for (B) each gene organized by chromosome location. CNV copy
number variation; Chr. chromosome.
Scientific Reports | (2022) 12:8937 | https://doi.org/10.1038/s41598-022-12788-z 7
Vol.:(0123456789)www.nature.com/scientificreports/
Figure 5. TAS1R and TAS2R expression is associated with survival in solid tumors. Tumor samples were
divided into high and low expression groups and the difference in mean survival days was calculated for these
groups for each TAS1R/TAS2R gene and tumor. (A) Bar graph demonstrating the number of genes significantly
associated with increased (black) or decreased (red) survival in solid tumors (p < 0.05). Non-significant
associations are not shown. Negative survival difference indicates that higher gene expression corresponds
to shorter survival times while positive survival difference indicates that higher gene expression corresponds
to longer survival times. (B) Difference in mean survival in days between above-median and below-median
expression groups for each TAS1R and TAS2R genes for tumors that reached significance in (A). Negative
values imply an adverse impact on survival where patients with higher median expression survived shorter
than those with lower median expression and vice versa.ACCadrenocortical cancer; BLCA_NP non-papillary
bladder cancer; BRCA_IDC_HR + hormone receptor positive infiltrating ductal carcinoma; CESC_CervSq
cervical esophageal squamous cell carcinoma; CPM counts per million; ESCA_AD esophageal adenocarcinoma;
KIRC kidney clear cell carcinoma; KIRP kidney papillary cell carcinoma; LUAD_NOS lung adenocarcinoma
not otherwise specified; OV ovarian cancer; PRAD prostate adenocarcinoma; SKCM_DistantMets distantly
metastatic skin melanoma; THCA_usual thyroid cancer usual type.
Scientific Reports | (2022) 12:8937 | https://doi.org/10.1038/s41598-022-12788-z 8
Vol:.(1234567890)www.nature.com/scientificreports/
Figure 6. Bitter taste receptor TAS2R14 and umami receptor TAS1R1 expression are associated with survival
in select solid tumors. (A–E) Kaplan–Meier curves for high and low expression groups for TAS2R14 in (A)
adrenocortical cancer (ACC), (B) non-papillary bladder cancer (BLCA_NP), (C) esophageal adenocarcinoma
(ESCA_AD), (D) hormone receptor positive infiltrating ductal breast carcinoma (BRCA_IDC_HR +), and (E)
distantly metastatic skin melanoma (SKCM_DistantMets). Peto-Peto’s modified survival estimate was significant
for TAS2R14 expression in ACC, BLCA_NP, ESCA_AD, and kidney clear cell carcinoma (KIRC; shown in
Supplemental Fig. 5). (F–H) Kaplan–Meier survival curves for high and low expression groups for TAS1R1
in (F) lung adenocarcinoma (LUAD_NOS), (G) kidney papillary cell carcinoma (KIRP), and (H) cervical
esophageal squamous cell carcinoma (CESC_SQC). Peto-Peto’s modified survival estimate was statistically
significant for TAS1R1 expression in LUAD_NOS. ACCadrenocortical cancer; BLCA_NP non-papillary
bladder cancer; BRCA_IDC_HR + hormone receptor positive infiltrating ductal carcinoma; CESC_SQC cervical
esophageal squamous cell carcinoma; CPM counts per million; ESCA_AD esophageal adenocarcinoma; KIRC
kidney clear cell carcinoma; KIRP kidney papillary cell carcinoma; LUAD_NOS lung adenocarcinoma; SKCM_
DistantMets distantly metastatic skin melanoma.
Scientific Reports | (2022) 12:8937 | https://doi.org/10.1038/s41598-022-12788-z 9
Vol.:(0123456789)www.nature.com/scientificreports/
A ACC: Expression of TAS2R14 B BLCA_NP: Expression of TAS2R14 C ESCA_Ad: Expression of TAS2R14
100
100
100
80
80
80
Sensitivity (%)
Sensitivity (%)
Sensitivity (%)
60
60
60
40
40
40
AUC = 72.83 AUC = 52.57 AUC = 54.8
Median CMP = 1.73 Median CMP = 0.86 Median CMP = 0.99
20
20
20
Sensitivity = 65.38 Sensitivity = 48.26 Sensitivity = 54.67
Specificity = 71.74 Specificity = 48.44 Specificity = 55.34
0
0
0
0 20 40 60 80 100 0 20 40 60 80 100 0 20 40 60 80 100
100 Specificity (%) 100 Specificity (%) 100 Specificity (%)
D BRCA_IDC_HR+: Expression of TAS2R14 E SKCM_DistantMets: Expression of TAS2R14
100
100
80
80
Sensitivity (%)
Sensitivity (%)
60
60
40
40
AUC = 55.27 AUC = 53.91
Median CMP = 0.8 Median CMP = 1
20
20
Sensitivity = 57.14 Sensitivity = 46.88
Specificity = 52.91 Specificity = 48.72
0
0
0 20 40 60 80 100 0 20 40 60 80 100
100 Specificity (%) 100 Specificity (%)
F LUAD_NOS: Expression of TAS1R1 G KIRP: Expression of TAS1R1 H CESC_SQC: Expression of TAS1R1
100
100
100
80
80
80
Sensitivity (%)
Sensitivity (%)
Sensitivity (%)
60
60
60
40
40
40
AUC = 56.91 AUC = 58.71 AUC = 56.8
Median CMP = 0.2 Median CMP = 0.09 Median CMP = 0.06
20
20
20
Sensitivity = 44.44 Sensitivity = 36.59 Sensitivity = 44.78
Specificity = 46.1 Specificity = 48.33 Specificity = 42.25
0
0
0
0 20 40 60 80 100 0 20 40 60 80 100 0 20 40 60 80 100
100 Specificity (%) 100 Specificity (%) 100 Specificity (%)
Figure 7. Prognostic roles of TAS2R14 and TAS1R1 for survival in solid tumors. Gene expression data from
TCGA was used to generate receiver operating characteristic (ROC) curves using the median counts per million
(CPM) cutoffs used in the Kaplan-Meier survival curves from Fig. 6. ROC curves are shown for TAS2R14 in (A)
adrenocortical cancer (ACC), (B) non-papillary bladder cancer (BLCA_NP), (C) esophageal adenocarcinoma
(ESCA_AD), (D) hormone receptor positive infiltrating ductal breast carcinoma (BRCA_IDC_HR +), and
(E) distantly metastatic skin melanoma (SKCM_DistantMets). ROC curves were also generated for TAS1R1
in (F) lung adenocarcinoma (LUAD_NOS), (G) kidney papillary cell carcinoma (KIRP), and (H) cervical
esophageal squamous cell carcinoma (CESC_SQC). The red line represents the sensitivity curve, and the blue
line represents random chance. The X axis shows the false positive rate, presented as ‘100–Specificity (%)’.
The Y axis indicates the true positive rate, shown as ‘Sensitivity (%)’. The area under the receiver operating
characteristics was highest for TAS2R14 in adrenocortical cancer (sensitivity 65.4% and specificity 71.7%).
ACCadrenocortical cancer; BLCA_NP non-papillary bladder cancer; BRCA_IDC_HR + hormone receptor
positive infiltrating ductal carcinoma; CESC_SQC cervical esophageal squamous cell carcinoma; CPM counts
per million; ESCA_AD esophageal adenocarcinoma; KIRC kidney clear cell carcinoma; KIRP kidney papillary
cell carcinoma; LUAD_NOS lung adenocarcinoma; ROC receiver operating characteristic; SKCM_DistantMets
distantly metastatic skin melanoma.
Scientific Reports | (2022) 12:8937 | https://doi.org/10.1038/s41598-022-12788-z 10
Vol:.(1234567890)www.nature.com/scientificreports/
The DE comparison of TAS1R/2Rs between normal and cancerous tissues showed several expression altera-
tions that varied between cancer types. Compared to their corresponding normal tissue, most solid tumors differ-
entially expressed one or more taste receptor gene and there was a trend toward decreased expression of TAS2Rs
across many of the malignancies. Bitter agonists, which bind to functional T2Rs, have been shown to activate
apoptosis in prostate c ancer42, metastatic breast c ancer41, acute myeloid leukemia c ells35, pancreatic c ancer32, and
head and neck squamous cell c arcinoma36. Given the potential role of some T2Rs in regulating apoptosis, it is
possible that decreased expression of TAS2Rs contributes to unregulated proliferation in malignancy or serves an
integral role in oncogenesis, potentially explaining the general trend towards decreased expression in cancer com-
pared to normal tissue. Importantly, our DE analysis compared the median expression for tumor versus normal
tissue and did not specifically explore the distribution of TAS1R/2R expression of individual samples for a given
anatomic site/cancer which may mask or dilute variability in expression that exists between samples/individuals.
Using the same logic that some T2Rs may regulate apoptosis and impact growth regulation, we predicted that
taste receptor expression levels may be a prognostic feature for stratifying outcomes in solid tumors. We did in
fact find positive survival differences for higher expression of some taste receptor genes in certain malignancies;
however, more taste receptors were associated with a negative survival difference (i.e. higher gene expression
corresponded to shorter survival times). These findings may be related to the diverse array of functions and
ligands for the T1Rs and T2Rs and potential synergistic or antagonistic effects of these receptors and ligands in
different tumor types. Alternatively, changes in taste receptor expression may be related to other genetic changes
in cancer cells that have more pronounced impacts on survival.
Regardless of receptor function, TAS1R and TAS2R gene expression had significant survival associations in
numerous subtypes of solid tumors, suggesting that they could potentially be refined to serve as biomarkers
for disease prognosis or selection of treatment intensity in some cancers. Changes in expression for TAS1R1,
TAS1R3, TAS2R4, TAS2R5, TAS2R14, TAS2R19, and TAS2R20 had survival associations in at least one tumor
histology. The most notable survival associations were seen for expression of TAS2R14 in adrenocortical carci-
noma, esophageal adenocarcinoma, and non-papillary bladder cancer which were significant based on analysis
of mean survival difference and Kaplan–Meier analysis. Similarly, increased TAS1R1 expression was associated
with improved survival in lung adenocarcinoma in both analysis methods. The efficacy of median TAS2R14 and
TAS1R1 expression in predicting survival was assessed (with TAS2R14 in adrenocortical carcinoma perform-
ing best), but additional biomarker development is necessary to determine if combinations of various TAS1R/
TAS2R expression levels and additional clinical variables may allow for improved sensitivity and specificity.
Interestingly, kidney clear cell carcinoma showed significant negative survival associations for 5 genes (TAS1R1,
TAS2R4, TAS2R5, TAS2R14, and TAS2R20) and a combined group based on expression of these 5 genes, which
suggests that this tumor type may be particularly well suited for a genetic risk screening tool based on TAS2Rs.
The candidate prognostic genes identified in our study will need to be further evaluated and validated to fully
understand their clinical utility.
Because specific genes, such as TAS2R4 and TAS2R14, had opposing survival associations in different malig-
nancies, it is possible that their functions in certain cancers vary and extend beyond apoptotic signaling pathways
previously described. The variability in T2R function has been evidenced in basic science work where common
bitter ligands that have anti-proliferative effects in some cancers32,35,36,41,42 instead have pro-tumor actions in
other malignancies such as submandibular gland cancer c ells53. Adding to the potential multifaceted impact of
taste receptors, certain T2Rs are activated by bacterial metabolites, such as T2R38 activation by Pseudomonas
aeruginosa N-3-oxo-dodecanoyl-L-homoserine lactone in pancreatic cancer32, suggesting that tumor-microbiome
crosstalk and the specific microenvironment may impact cancer through these receptors. From a therapeutic
perspective, taste receptors with positive impacts on survival could potentially be targetted with T1R/T2R-acti-
vating drugs delivered topically to a tumor. Alternatively, receptors with pro-tumor effects could be candidates
for immunomodulators or biologics aimed at neutralizing their function.
We showed that nonsilent mutations occurred in TAS1R and TAS2R genes and occurred at different rates for
different cancer types. Some of the highest rates of mutations occurred in skin melanoma, liver hepatocellular
carcinoma, lung adenocarcinoma, colon adenocarcinoma, stomach adenocarcinoma, and lung squamous cell
carcinoma. Importantly, TAS2R genes have a high density of polymorphisms, including amino acid substitu-
tions, compared with other gene f amilies55. Polymorphisms in taste receptor genes that regulate their function
in terms of taste have also been linked to alterations in susceptibilty to infection and inflammatory disease due
to their role in i mmunity18. We propose that these same polymorphisms may have even further reaching clini-
cal roles by regulating T2R function within tumor cells. These pre-existing polymorphisms may have equal or
more profound impacts in cancer than the cancer-derived mutations in these genes. While the clinical impact
of taste receptor mutations and polymorphisms was not specifically analyzed in the current study, this should
be the topic of future work.
Importantly, the complex taste receptor genetics underlying individual taste preferences (e.g., for bitter coffee,
green leafy vegetables, hoppy beer)11–16 may also underlie outcomes in cancer through their impact on diet and
consumption of certain foods and beverages. For example, one prior study showed that TAS1R genetic variations
(determined by blood sample genotype) were associated with dietary fruit consumption and cigarette use and
possibly gastric cancer r isk30. Further work is required to fully separate out tumor cell-dependent versus diet-
dependent effects of taste receptor polymorphisms.
In summary, this study was the first to characterize taste receptor DNA mutations, structural variation,
differential expression, and survival associations across numerous solid tumors. Our finding that expression
levels of specific taste receptor genes predicted survival suggests that these genes could serve as biomarkers for
clinical outcomes or targets in certain malignancies. There are several limitations of our study which can serve
as opportunities for additional analyses. These limitations include the need for investigation of taste receptor
function in malignancy, analysis of survival associations based on genetic mutations and polymorphisms, and
Scientific Reports | (2022) 12:8937 | https://doi.org/10.1038/s41598-022-12788-z 11
Vol.:(0123456789)www.nature.com/scientificreports/
incorporation of a wider range of clinical variables and outcome measures. Furthermore, in vitro and in vivo
studies on the functional role of taste receptors and their genes are warranted to reveal potential associations
with cancer progression and behavior which cannot be fully determined through in silico analyses. Regardless,
our work will serve as a launching point for exploration of this novel class of GPCRs in malignancy which may
improve disease stratification and treatment.
Data availability
All relevant data are within the paper and its Supporting information files, with additional information available
at the open-access websites https://insellab.github.io/ and https://www.cbioportal.org/.
Received: 17 November 2021; Accepted: 16 May 2022
References
1. Bachmanov, A. A. et al. Genetics of taste receptors. Curr. Pharm. Des. 20, 2669–2683. https://doi.org/10.2174/138161281131999
90566 (2014).
2. Li, X. T1R receptors mediate mammalian sweet and umami taste. Am. J. Clin. Nutr. 90, 733s–737s. https://doi.org/10.3945/ajcn.
2009.27462G (2009).
3. Damak, S. et al. Detection of sweet and umami taste in the absence of taste receptor T1r3. Science 301, 850–853. https://doi.org/
10.1126/science.1087155 (2003).
4. Zhao, G. Q. et al. The receptors for mammalian sweet and umami taste. Cell 115, 255–266. https://d oi.o rg/1 0.1 016/s 0092-8 674(03)
00844-4 (2003).
5. Donaldson, S. H. & Boucher, R. C. Update on pathogenesis of cystic fibrosis lung disease. Curr. Opin. Pulm. Med. 9, 486–491
(2003).
6. Behrens, M. & Meyerhof, W. Oral and extraoral bitter taste receptors. Res. Probl. Cell Differ. 52, 87–99. https://doi.org/10.1007/
978-3-642-14426-4_8 (2010).
7. Behrens, M. & Meyerhof, W. Bitter taste receptor research comes of age: From characterization to modulation of TAS2Rs. Semin.
Cell Dev. Biol. https://doi.org/10.1016/j.semcdb.2012.08.006 (2010).
8. Gilbertson, T. A., Damak, S. & Margolskee, R. F. The molecular physiology of taste transduction. Curr. Opin. Neurobiol. 10, 519–527
(2000).
9. Kinnamon, S. C. & Margolskee, R. F. Mechanisms of taste transduction. Curr. Opin. Neurobiol. 6, 506–513 (1996).
10. Margolskee, R. F. Molecular mechanisms of bitter and sweet taste transduction. J. Biol. Chem. 277, 1–4. https://doi.org/10.1074/
jbc.R100054200 (2002).
11. Margolskee, R. F. The molecular biology of taste transduction. BioEssays : News and Rev. Mol. Cell. Dev. Biol. 15, 645–650. https://
doi.org/10.1002/bies.950151003 (1993).
12. Li, D. & Zhang, J. Diet shapes the evolution of the vertebrate bitter taste receptor gene repertoire. Mol. Biol. Evol. 31, 303–309.
https://doi.org/10.1093/molbev/mst219 (2014).
13. Lanier, S. A., Hayes, J. E. & Duffy, V. B. Sweet and bitter tastes of alcoholic beverages mediate alcohol intake in of-age undergradu-
ates. Physiol. Behav. 83, 821–831. https://doi.org/10.1016/j.physbeh.2004.10.004 (2005).
14. Fushan, A. A., Simons, C. T., Slack, J. P., Manichaikul, A. & Drayna, D. Allelic polymorphism within the TAS1R3 promoter is
associated with human taste sensitivity to sucrose. Curr. Biol. : CB 19, 1288–1293. https://d oi.o
rg/1 0.1 016/j.c ub.2 009.0 6.0 15 (2009).
15. Wieczorek, M. N., Walczak, M., Skrzypczak-Zielińska, M. & Jeleń, H. H. Bitter taste of Brassica vegetables: The role of genetic
factors, receptors, isothiocyanates, glucosinolates, and flavor context. Crit. Rev. Food Sci. Nutr. 58, 3130–3140. https://doi.org/10.
1080/10408398.2017.1353478 (2018).
16. Hayes, J. E. et al. Allelic variation in TAS2R bitter receptor genes associates with variation in sensations from and ingestive behaviors
toward common bitter beverages in adults. Chem. Sens. 36, 311–319. https://doi.org/10.1093/chemse/bjq132 (2011).
17. Hayes, J. E., Feeney, E. L., Nolden, A. A. & McGeary, J. E. Quinine bitterness and grapefruit liking associate with allelic variants in
TAS2R31. Chem. Sens. 40, 437–443. https://doi.org/10.1093/chemse/bjv027 (2015).
18. Hariri, B. M. et al. Flavones modulate respiratory epithelial innate immunity: Anti-inflammatory effects and activation of the
T2R14 receptor. J. Biol. Chem. 292, 8484–8497. https://doi.org/10.1074/jbc.M116.771949 (2017).
19. Carey, R. M. & Lee, R. J. Taste receptors in upper airway innate immunity. Nutrients https://doi.org/10.3390/nu11092017 (2019).
20. Clark, A. A. et al. TAS2R bitter taste receptors regulate thyroid function. Faseb J. 29, 164–172. https://d oi.o
rg/1 0.1 096/fj
.1 4-2 62246
(2015).
21. Kinnamon, S. C. Taste receptor signalling - from tongues to lungs. Acta Physiol. (Oxf) 204, 158–168. https://doi.org/10.1111/j.
1748-1716.2011.02308.x (2012).
22. Janssen, S. et al. Bitter taste receptors and alpha-gustducin regulate the secretion of ghrelin with functional effects on food intake
and gastric emptying. Proc. Natl. Acad. Sci. U.S.A. 108, 2094–2099. https://doi.org/10.1073/pnas.1011508108 (2011).
23. Wu, S. V. et al. Expression of bitter taste receptors of the T2R family in the gastrointestinal tract and enteroendocrine STC-1 cells.
Proc. Natl. Acad. Sci. U.S.A. 99, 2392–2397. https://doi.org/10.1073/pnas.042617699 (2002).
24. Freund, J. R. et al. Activation of airway epithelial bitter taste receptors by Pseudomonas aeruginosa quinolones modulates calcium,
cyclic-AMP, and nitric oxide signaling. J. Biol. Chem. 293, 9824–9840. https://doi.org/10.1074/jbc.RA117.001005 (2018).
25. Choi, J. H. et al. Genetic variation in the TAS2R38 bitter taste receptor and gastric cancer risk in Koreans. Sci. Rep. 6, 26904. https://
doi.org/10.1038/srep26904 (2016).
26. Yamaki, M. et al. Genotyping analysis of bitter-taste receptor genes TAS2R38 and TAS2R46 in Japanese patients with gastrointestinal
cancers. J. Nutr. Sci. Vitaminol. 63, 148–154. https://doi.org/10.3177/jnsv.63.148 (2017).
27. Carrai, M. et al. Association between TAS2R38 gene polymorphisms and colorectal cancer risk: A case-control study in two
independent populations of Caucasian origin. PLoS ONE 6, e20464. https://doi.org/10.1371/journal.pone.0020464 (2011).
28. Barontini, J. et al. Association between polymorphisms of TAS2R16 and susceptibility to colorectal cancer. BMC Gastroenterol.
17, 104. https://doi.org/10.1186/s12876-017-0659-9 (2017).
29. Choi, J. H. & Kim, J. TAS2R38 bitterness receptor genetic variation and risk of gastrointestinal neoplasm: A meta-analysis. Nutr.
Cancer 71, 585–593. https://doi.org/10.1080/01635581.2018.1559935 (2019).
30. Schembre, S. M., Cheng, I., Wilkens, L. R., Albright, C. L. & le Marchand, L. Variations in bitter-taste receptor genes, dietary intake,
and colorectal adenoma risk. Nutr. Cancer 65, 982–990. https://doi.org/10.1080/01635581.2013.807934 (2013).
31. Choi, J. H. et al. Variations in TAS1R taste receptor gene family modify food intake and gastric cancer risk in a Korean population.
Mol. Nutr. Food Res. 60, 2433–2445. https://doi.org/10.1002/mnfr.201600145 (2016).
32. Stern, L. et al. Overcoming chemoresistance in pancreatic cancer cells: role of the bitter taste receptor T2R10. J. Cancer 9, 711–725.
https://doi.org/10.7150/jca.21803 (2018).
Scientific Reports | (2022) 12:8937 | https://doi.org/10.1038/s41598-022-12788-z 12
Vol:.(1234567890)www.nature.com/scientificreports/
33. Gaida, M. M. et al. Expression of the bitter receptor T2R38 in pancreatic cancer: Localization in lipid droplets and activation by
a bacteria-derived quorum-sensing molecule. Oncotarget 7, 12623–12632. https://doi.org/10.18632/oncotarget.7206 (2016).
34. Singh, N., Chakraborty, R., Bhullar, R. P. & Chelikani, P. Differential expression of bitter taste receptors in non-cancerous breast
epithelial and breast cancer cells. Biochem. Biophys. Res. Commun. 446, 499–503. https://d oi.o rg/1 0.1 016/j.b
brc.2 014.0 2.1 40 (2014).
35. Choi, J. H. et al. Genetic variations in TAS2R3 and TAS2R4 bitterness receptors modify papillary carcinoma risk and thyroid
function in Korean females. Sci. Rep. 8, 15004. https://doi.org/10.1038/s41598-018-33338-6 (2018).
36. Salvestrini, V. et al. Denatonium as a bitter taste receptor agonist modifies transcriptomic profile and functions of acute myeloid
leukemia cells. Front. Oncol. 10, 1225. https://doi.org/10.3389/fonc.2020.01225 (2020).
37. Carey, R. M. et al. T2R bitter taste receptors regulate apoptosis and may be associated with survival in head and neck squamous
cell carcinoma. bioRxiv https://doi.org/10.1101/2021.05.17.444527 (2021).
38. Lambert, J. D. et al. Bitter taste sensitivity, food intake, and risk of malignant cancer in the UK Women’s Cohort Study. Eur. J. Nutr.
58, 2111–2121. https://doi.org/10.1007/s00394-018-1772-4 (2019).
39. Wen, X. et al. Denatonium inhibits growth and induces apoptosis of airway epithelial cells through mitochondrial signaling
pathways. Respir. Res. 16, 13. https://doi.org/10.1186/s12931-015-0183-9 (2015).
40. Sharma, P. et al. Antimitogenic effect of bitter taste receptor agonists on airway smooth muscle cells. Am. J. Physiol. Lung. Cell.
Mol. Physiol. 310, L365-376. https://doi.org/10.1152/ajplung.00373.2015 (2016).
41. Pan, S., Sharma, P., Shah, S. D. & Deshpande, D. A. Bitter taste receptor agonists alter mitochondrial function and induce autophagy
in airway smooth muscle cells. Am. J. Physiol. Lung Cell Mol. Physiol. 313, L154-l165. https://doi.org/10.1152/ajplung.00106.2017
(2017).
42. Singh, N., Shaik, F. A., Myal, Y. & Chelikani, P. Chemosensory bitter taste receptors T2R4 and T2R14 activation attenuates prolif-
eration and migration of breast cancer cells. Mol. Cell. Biochem. https://doi.org/10.1007/s11010-019-03679-5 (2020).
43. Martin, L. T. P. et al. Bitter taste receptors are expressed in human epithelial ovarian and prostate cancers cells and noscapine
stimulation impacts cell survival. Mol. Cell. Biochem. 454, 203–214. https://doi.org/10.1007/s11010-018-3464-z (2019).
44. Cerami, E. et al. The cBio cancer genomics portal: an open platform for exploring multidimensional cancer genomics data. Cancer
Discov. 2, 401–404. https://doi.org/10.1158/2159-8290.cd-12-0095 (2012).
45. Gao, J. et al. Integrative analysis of complex cancer genomics and clinical profiles using the cBioPortal. Sci. Sig. https://doi.org/10.
1126/scisignal.2004088 (2013).
46. John, L. et al. The genotype-tissue expression (GTEx) project. Nat. Gen. 45, 580–585. https://doi.org/10.1038/ng.2653 (2013).
47. Sriram, K., Moyung, K., Corriden, R., Carter, H. & Insel, P. A. GPCRs show widespread differential mRNA expression and frequent
mutation and copy number variation in solid tumors. PLoS Biol. 17, e3000434. https://d oi.o
rg/1 0.1 371/j ourna l.p
bio.3 00043 4 (2019).
48. Robinson, M. D. & Smyth, G. K. Small-sample estimation of negative binomial dispersion, with applications to SAGE data. Bio-
statistics (Oxford, England) 9, 321–332. https://doi.org/10.1093/biostatistics/kxm030 (2008).
49. Laffitte, A., Neiers, F. & Briand, L. Functional roles of the sweet taste receptor in oral and extraoral tissues. Curr. Opin. Clin. Nutr.
Metab. Care 17, 379–385. https://doi.org/10.1097/mco.0000000000000058 (2014).
50. Shaw, L. et al. Personalized expression of bitter “taste” receptors in human skin. PLoS ONE 13, e0205322. https://doi.org/10.1371/
journal.pone.0205322 (2018).
51. Ho, H. K. et al. Functionally expressed bitter taste receptor TAS2R14 in human epidermal keratinocytes serves as a chemosensory
receptor. Exp. Dermatol. 30, 216–225. https://doi.org/10.1111/exd.14250 (2021).
52. Meyerhof, W. et al. The molecular receptive ranges of human TAS2R bitter taste receptors. Chem. Sens. 35, 157–170. https://doi.
org/10.1093/chemse/bjp092 (2010).
53. Lin, Y. C. et al. Genome dynamics of the human embryonic kidney 293 lineage in response to cell biology manipulations. Nat.
Commun. 5, 4767. https://doi.org/10.1038/ncomms5767 (2014).
54. Dmytrenko, G., Castro, M. E. & Sales, M. E. Denatonium and naringenin promote SCA-9 Tumor growth and angiogenesis: Par-
ticipation of arginase. Nutr. Cancer 69, 780–790. https://doi.org/10.1080/01635581.2017.1328605 (2017).
55. Kim, U., Wooding, S., Ricci, D., Jorde, L. B. & Drayna, D. Worldwide haplotype diversity and coding sequence variation at human
bitter taste receptor loci. Hum. Mutat. 26, 199–204. https://doi.org/10.1002/humu.20203 (2005).
Acknowledgements
Results are partly based upon data from the UCSC Xena Project (https://xena.ucsc.edu), The Cancer Genome
Atlas (TCGA, https://cancergenome.nih.gov/), and The Genotype-Tissue Expression Database (GTEx, https://
gtexportal.org/home/).
Author contributions
Conceptualization and Visualization: R.M.C., N.A.C., R.J.L., K.T.N; Investigation and Formal Analysis: T.B.K.,
R.M.C., K.T.N.; Writing–Original Draft: R.M.C.; Writing–Review and Editing: R.M.C., T.B.K., N.A.C., R.J.L.,
K.T.N.; Data Curation and Resources: K.T.N; Supervision: K.T.N.
Funding
This study was supported by an American Head and Neck Society Pilot Grant to R.M.C. and a National Institute
of Health Grant R01DC016309 to R.J.L. K.T.N. is a Cancer Prevention Research Institute of Texas (CPRIT) Schol-
ars in Cancer Research. K.T.N. is supported by CPRIT RR190077, NCI L30CA253796, and NCI K08CA263313.
The funders had no role in study design, data collection, analysis, writing, or decision to submit.
Competing interests
The authors declare no competing interests.
Additional information
Supplementary Information The online version contains supplementary material available at https://doi.org/
10.1038/s41598-022-12788-z.
Correspondence and requests for materials should be addressed to R.M.C.
Reprints and permissions information is available at www.nature.com/reprints.
Publisher’s note Springer Nature remains neutral with regard to jurisdictional claims in published maps and
institutional affiliations.
Scientific Reports | (2022) 12:8937 | https://doi.org/10.1038/s41598-022-12788-z 13
Vol.:(0123456789)www.nature.com/scientificreports/
Open Access This article is licensed under a Creative Commons Attribution 4.0 International
License, which permits use, sharing, adaptation, distribution and reproduction in any medium or
format, as long as you give appropriate credit to the original author(s) and the source, provide a link to the
Creative Commons licence, and indicate if changes were made. The images or other third party material in this
article are included in the article’s Creative Commons licence, unless indicated otherwise in a credit line to the
material. If material is not included in the article’s Creative Commons licence and your intended use is not
permitted by statutory regulation or exceeds the permitted use, you will need to obtain permission directly from
the copyright holder. To view a copy of this licence, visit http://creativecommons.org/licenses/by/4.0/.
© The Author(s) 2022
Scientific Reports | (2022) 12:8937 | https://doi.org/10.1038/s41598-022-12788-z 14
Vol:.(1234567890)You can also read