Imaging-guided two-photon excitation-emission-matrix measurements of human skin tissues - SPIE ...
←
→
Page content transcription
If your browser does not render page correctly, please read the page content below
Imaging-guided two-photon excitation-
                 emission-matrix measurements of
                 human skin tissues

                 Yingqiu Yu
                 Anthony M. D. Lee
                 Hequn Wang
                 Shuo Tang
                 Jianhua Zhao
                 Harvey Lui
                 Haishan Zeng

Downloaded From: https://www.spiedigitallibrary.org/journals/Journal-of-Biomedical-Optics on 08 Jan 2022
Terms of Use: https://www.spiedigitallibrary.org/terms-of-use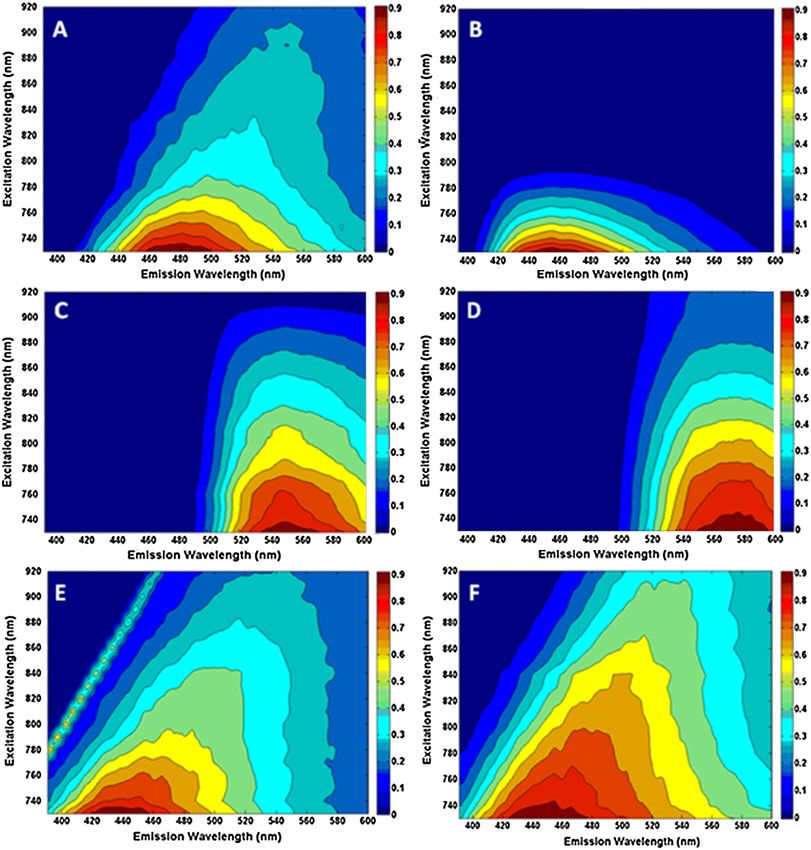
Journal of Biomedical Optics 17(7), 077004 (July 2012)

                Imaging-guided two-photon excitation-emission-matrix
                measurements of human skin tissues
                Yingqiu Yu,a,b Anthony M. D. Lee,a Hequn Wang,a Shuo Tang,b Jianhua Zhao,a,c Harvey Lui,a,c and Haishan Zenga,c
                a
                  Imaging Unit, Integrative Oncology Department, British Columbia Cancer Agency Research Center, 675 West 10th Avenue,
                Vancouver, BC, V5Z 1L3, Canada
                b
                  University of British Columbia, Department of Electrical and Computer Engineering, 5500-2332 Main Mall, Vancouver, BC, V6T 1Z4, Canada
                c
                  University of British Columbia and Vancouver Coastal Health Research Institute, Department of Dermatology and Skin Science, 835 West 10th
                Avenue, Vancouver, BC, V5Z 4E8, Canada

                              Abstract. There are increased interests on using multiphoton imaging and spectroscopy for skin tissue character-
                              ization and diagnosis. However, most studies have been done with just a few excitation wavelengths. Our objective
                              is to perform a systematic study of the two-photon fluorescence (TPF) properties of skin fluorophores, normal skin,
                              and diseased skin tissues. A nonlinear excitation-emission-matrix (EEM) spectroscopy system with multiphoton
                              imaging guidance was constructed. A tunable femtosecond laser was used to vary excitation wavelengths from
                              730 to 920 nm for EEM data acquisition. EEM measurements were performed on excised fresh normal skin tissues,
                              seborrheic keratosis tissue samples, and skin fluorophores including: NADH, FAD, keratin, melanin, collagen, and
                              elastin. We found that in the stratum corneum and upper epidermis of normal skin, the cells have large sizes and the
                              TPF originates from keratin. In the lower epidermis, cells are smaller and TPF is dominated by NADH contributions.
                              In the dermis, TPF is dominated by elastin components. The depth resolved EEM measurements also demonstrated
                              that keratin structure has intruded into the middle sublayers of the epidermal part of the seborrheic keratosis lesion.
                              These results suggest that the imaging guided TPF EEM spectroscopy provides useful information for the develop-
                              ment of multiphoton clinical devices for skin disease diagnosis. © 2012 Society of Photo-Optical Instrumentation Engineers (SPIE).
                              [DOI: 10.1117/1.JBO.17.7.077004]

                              Keywords: two-photon excitation fluorescence; second harmonic generation; two-photon excitation fluorescence excitation-emission
                              matrix; multiphoton imaging; skin fluorophore; seborrheic keratosis.
                              Paper 12189 received Mar. 21, 2012; revised manuscript received May 23, 2012; accepted for publication May 30, 2012; published
                              online Jul. 6, 2012.

                1     Introduction                                                                 emission wavelengths for the best performance of imaging ana-
                As skin cancer is the most prevalent type of cancer, it is important               lysis of specific tissue types. EEM of purified fluorophore may
                to develop diagnostic techniques for accurate early stage diagno-                  serve as a unique signature. Based on these signatures, EEM of
                sis to improve the chances for curative action. Nonlinear optical                  complex tissues can be used to identify the fluorophores and their
                imaging methods are very promising for noninvasive diagnosis of                    relative distributions in the tissue in a more reliable manner. The
                skin diseases, leveraging the advantages of deep imaging depth,                    variations of emission from intrinsic fluorophores with the
                high resolution, fast imaging speed, and rich endogenous fluor-                    change of excitation wavelengths can be used to analyze the bio-
                ophores.1 Two nonlinear imaging mechanisms, two-photon                             chemical state of cells and tissues. EEM can display these varia-
                excited fluorescence (TPF) and second harmonic generation                          tions within a single contour plot and thus facilitate fast and
                (SHG) have been widely applied in research for skin character-                     reliable analysis.
                ization and diagnosis.2–4 Because different endogenous fluoro-                         One-photon EEM has been widely investigated for skin
                phores can generate comparable intensities of TPF, integrated                      research,9 and research has also shown the difference between
                TPF imaging alone may not be sufficient to provide biochemical                     one-photon spectra and two-photon spectra.8 When conven-
                composition information. However, TPF spectral measurements                        tional single-photon EEM is applied to bulk tissue, the result
                can provide biochemical and constituent information of the tis-                    is a mixture of signals emitted from different tissue depths,
                sue, and it can be sensitive to the physiological state of the skin                which is hard to interpret for analysis of tissue compositions.
                and the presence of disease. Several groups have used TPF spec-                    In two-photon EEM study, using the optical sectioning capabil-
                troscopic analysis for in vivo or ex vivo tissue studies at one or a               ity of TPF and SHG, EEM can be acquired from a specific thin
                few excitation wavelengths.5–8 Collection of the TPF emission                      layer and even a specific small region-of-interest. Spectral anal-
                spectrum as a function of excitation wavelength to generate a                      ysis can then be accurately targeted to particular locations in
                two-photon excitation-emission matrix (2P-EEM) can allow                           skin tissues with minimal interference from the surrounding tis-
                even greater sensitivity to distinguish fluorophores and disease                   sues. Furthermore, SHG is a new contrast in two-photon EEM,
                states. EEM can also assist in choosing the optimal excitation/                    which can provide extra information of collagen fibers in skin
                                                                                                   dermis. Moreover, two-photon emissions (TPF and SHG) in the
                                                                                                   UV-visible range are excited by a laser beam in the near IR
                Address all correspondence to: Haishan Zeng, Imaging Unit, Integrative Oncol-
                                                                                                   range. Hence the excitation beam will incur less absorption
                ogy Department, British Columbia Cancer Agency Research Centre, 675 West
                10th Ave, Vancouver, BC, Canada V5Z 1L3. Tel: 604 675 8083; Fax: 604675
                8099; E-mail: hzeng@bccrc.ca                                                       0091-3286/2012/$25.00 © 2012 SPIE

                Journal of Biomedical Optics                                               077004-1                                             July 2012   •   Vol. 17(7)

Downloaded From: https://www.spiedigitallibrary.org/journals/Journal-of-Biomedical-Optics on 08 Jan 2022
Terms of Use: https://www.spiedigitallibrary.org/terms-of-use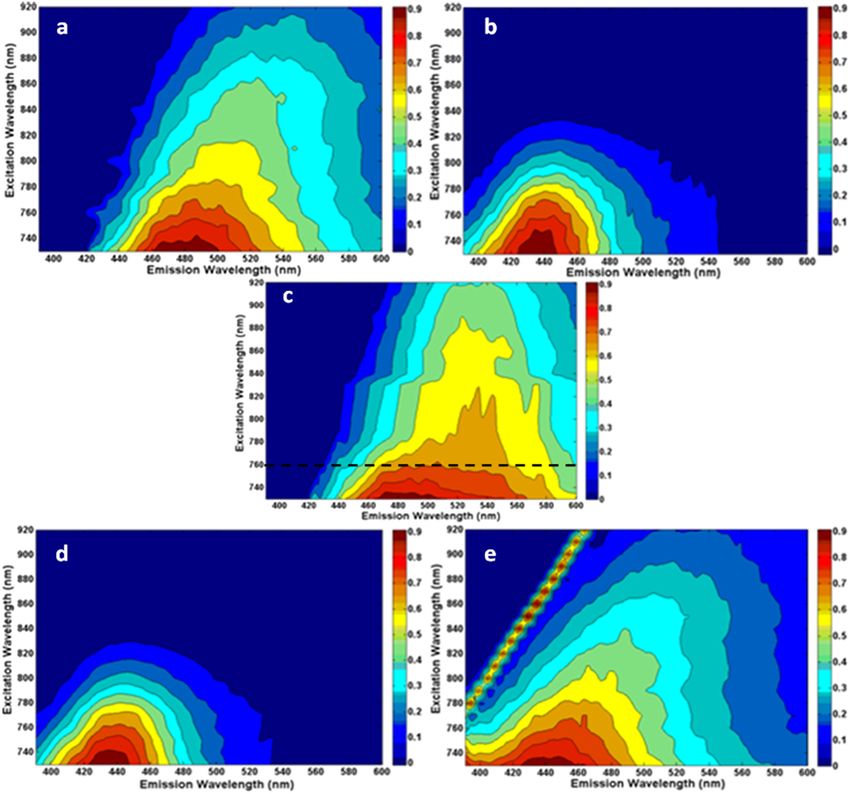
Yu et al.: Imaging-guided two-photon excitation-emission-matrix measurements : : :

                and scattering during transmission in tissue samples and have                      Vancouver General Hospital. The bulk tissue samples without
                larger penetration depths than single-photon fluorescence. So                      sectioning were placed on a microscope slide and used directly
                it is beneficial to characterize the tissue endogenous fluoro-                     for EEM measurements within 1 h after excision when still
                phores and skin tissue with two-photon EEM. We have                                fresh. After all EEM measurements, we fixed the tissue in for-
                previously measured two-photon EEM for collagen, elastin                           malin and then applied hematoxylin and eosin (H&E) staining
                samples, and excised skin dermis without imaging guidance.10                       for histologic image acquisition. A normal tissue sample from
                In this study, we developed a system to use simultaneous TPF                       the temple region of one subject and a seborrheic keratosis tissue
                and SHG imaging to guide the EEM acquisition from different                        sample from the shoulder region of another subject were
                layers of human skin tissue samples. This provides coregistered                    studied.
                comprehensive morphologic and biochemical information of
                human skin tissue samples. We studied tissue samples from                          2.3     Experimental Setup and System Calibration
                both normal skin and diseased skin (seborrheic keratosis).
                                                                                                   A schematic diagram of the experimental setup is shown in
                2     Materials and Methods                                                        Fig. 1. A 720 to 950 nm tunable femto-second laser (pulse-
                                                                                                   width: 140 fs FWHM, repetition rate: 80 MHz, Chameleon,
                2.1     Purified Fluorophores                                                      Coherence Inc., Santa Clara, CA) was used as the excitation
                Purified skin fluorophores were purchased and used directly in                     source. A computer controlled attenuator including a λ∕2
                the raw form (dry powder or in solution). Two-photon EEM mea-                      wave-plate and a polarization beam splitter was installed
                surements were performed by placing each sample evenly over a                      directly at the beam exit of the laser to control the excitation
                microscope slide and then covered with a piece of cover glass on                   power. The beam was scanned over tissue samples by the com-
                the top. Fluorophores studied include NADH (N6879-25MG,                            bination of a resonant scanner (CRS8, Cambridge Technology,
                α-Nicotinamide adenine dinucleotide, reduced disodium salt, ana-                   Lexington, MA) as the fast axis and a galvonometer scanner
                log of β-NADH, chemically reduced; Sigma-Aldrich), FAD                             (VM500þ, Cambridge Technology, Lexington, MA) as the
                (F6625-10MG, flavin adenine dinucleotide disodium salt hydrate;                    slow axis. The field of view (FOV) for imaging can be varied
                Sigma-Aldrich), keratin (K0253, Sigma-Aldrich; 1 mg∕mL solu-                       from 60 × 60 μm2 to 500 × 500 μm2. For spectral measurements
                tion in urea), melanin (M8631-250MG; Sigma-Aldrich), elastin                       of smaller region of interest (ROI), the laser beam can be
                (GH421, elastin from human skin; Elastin Products Co., Inc.)                       scanned over smaller area down to 20 × 20 μm2. The resonant
                and collagen (HS150 collagen type I, acid soluble, from                            scanner has a scanning frequency of 8 kHz, which enables real-
                human skin; Elastin Products Co., Inc.).                                           time imaging (∼12 frames per second).11 The emitted signal was
                                                                                                   separated from the excitation beam using a dichroic mirror
                2.2     Excised Skin Tissue Samples                                                (FF665-Di02-25 × 36, Semrock, Lake Forest, Illinois). It was
                                                                                                   then split by a 50∕50 beam splitter (NT32-363, Edmund Optics,
                The use of human specimens followed a protocol approved by                         Barrington, NJ) into an imaging channel and a spectroscopy
                the University of British Columbia Research Ethics Board                           channel. The beam in the imaging channel was further split
                (Certificate No. H96-70499). Excised skin tissue samples                           using a long pass dichroic (Di01-R405-25 × 36, Semrock,
                used in this study were obtained from the Skin Care Centre,                        Lake Forest, Illinois) and collected by two photomultiplier

                                       Fig. 1 Optics setup of the image-guided EEM system (PBS: polarization beam splitter; fs: femto second).

                Journal of Biomedical Optics                                               077004-2                                            July 2012   •   Vol. 17(7)

Downloaded From: https://www.spiedigitallibrary.org/journals/Journal-of-Biomedical-Optics on 08 Jan 2022
Terms of Use: https://www.spiedigitallibrary.org/terms-of-use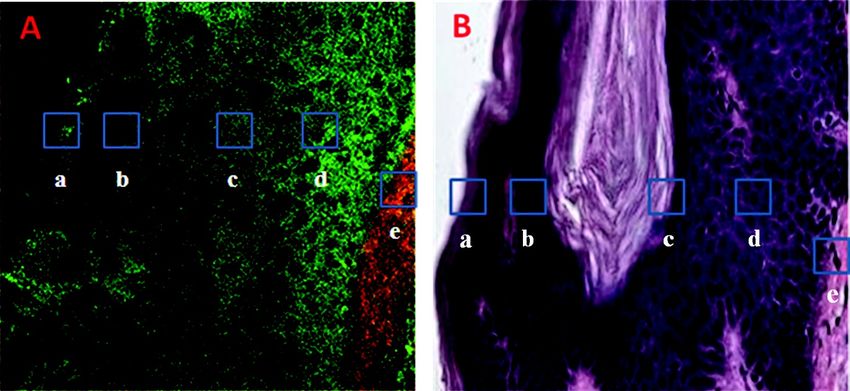
Yu et al.: Imaging-guided two-photon excitation-emission-matrix measurements : : :

                tubes (PMT) for TPF and SHG imaging, respectively. Emission                        0.12] arranged in a hexagon pattern at the input end to provide a
                spectra are collected by a spectrometer (SpectraPro-150, Roper                     much larger collection area than a single fiber. The output end
                Scientific, Princeton, NJ) for EEM data accumulation. The                          (Fig. 1, inset b) has all of the 90 fibers arranged as 2 straight
                exposure time for each emission spectrum was between 2                             lines with 45 fibers in each line so that most of the collected
                and 3 s. During this time period, the laser beam had scanned                       light can be coupled into the narrow entrance slit of the spectro-
                over the ROI for 24 to 36 times. Therefore, each emission spec-                    meter. The width of this line-shape bundle of fibers is 200 μm,
                trum represented the average emission signal (SHG or TPF)                          leading to a spectral resolution of 4 nm. The f-number (f∕) of
                from the ROI. A specially designed fiber bundle was applied                        the spectrograph system (f∕4) has been matched with the NA of
                here to increase the collection area of emitted photons for a                      the fiber (0.12) as: f∕ ¼ 1∕ð2 × NAÞ for optimum perfor-
                high signal-to-noise ratio in the spectral acquisition. The                        mance. (Fig. 1).
                arrangement of fibers within the fiber bundle between the                              Due to the sinusoidal scanning pattern of the resonant scan-
                imaging system and the spectrometer has two different patterns                     ner, a linearization algorithm was applied to correct the resulted
                (Fig. 1, inset a and inset b). The fiber bundle has 90 small fibers                image distortion,12 which was incorporated into the system soft-
                [single fiber core diameter: 100 μm; numerical aperture (NA):                      ware for real-time display.

                Fig. 2 Two-Photon EEM of endogenous fluorophores of human skin. (a) Keratin, (b) NADH, (c) FAD, (d) melanin, (e) collagen, (f) elastin (excitation
                wavelength: 730 to 920 nm, excitation power: 20 mw, exposure time: 3 s, ROI∶ 100 × 100 μm2).

                Journal of Biomedical Optics                                               077004-3                                            July 2012   •   Vol. 17(7)

Downloaded From: https://www.spiedigitallibrary.org/journals/Journal-of-Biomedical-Optics on 08 Jan 2022
Terms of Use: https://www.spiedigitallibrary.org/terms-of-use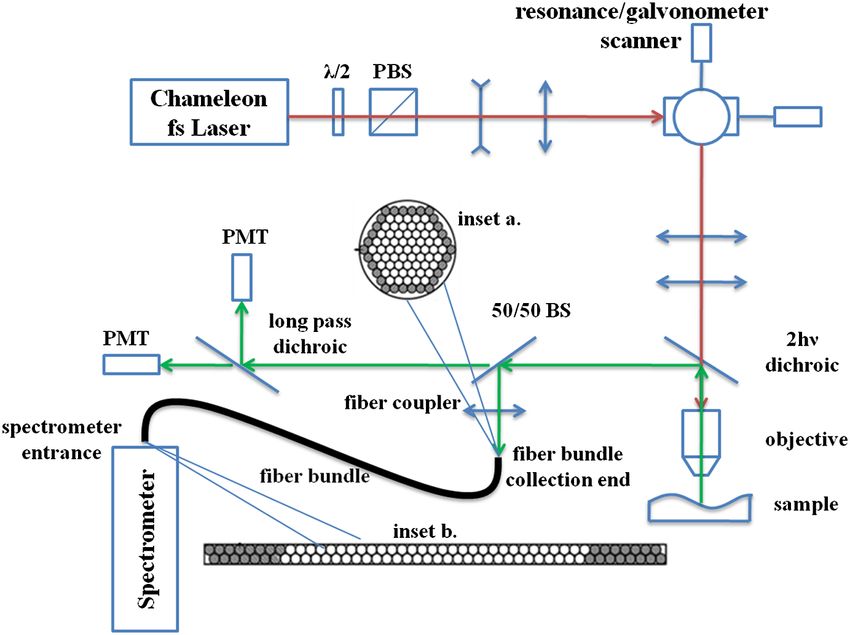
Yu et al.: Imaging-guided two-photon excitation-emission-matrix measurements : : :

                    To acquire accurate two-photon EEM, two sets of calibra-                       emission spectra of keratin at a couple of different excitation
                tions were completed including excitation path and emission                        wavelengths. Our EEM covered more excitation wavelengths
                path calibrations. In the excitation path, excitation power                        and for those overlapping excitation wavelengths, our results
                after the objective was calibrated to maintain a constant                          are consistent with Ref. 13. For example, the excitation-
                power for various excitation wavelengths. In the emission                          emission pair of (760 nm, 485 nm) and (860 nm, 525 nm)
                path, we completed wavelength calibration for the spectrometer                     we observed matched with their results of two pairs located
                using a Hg(Ar) calibration lamp (HG-1, Ocean Optics, Dunedin,                      at (760 nm, 475  5 nm) and (860 nm, 515  5 nm).13 Here
                FL) and the system (wavelength dependent) response calibration                     the first number in parentheses is a given excitation wavelength,
                for the CCD detector and all the optical components in the emis-                   whereas the second number is the wavelength of corresponding
                sion beam path and inside the spectrometer using a NIST certi-                     emission spectrum maximum intensity position. These are char-
                fied tungsten lamp (RS-10A-1, Gamma Scientific, San Diego,                         acteristics of individual emission spectra, which are different
                CA). The standard tungsten lamp was coupled to an integration                      from the excitation-emission maximum pair of the whole
                sphere, which was then placed with its exit port aligned with the                  EEM plot in the literature.
                objective lens. The standard light then went through the whole                         Figure 2(b) shows the EEM of NADH. We observed an exci-
                emission path including the objective, the grating as well as                      tation-emission pair at (730 nm, 460 nm), which matches with
                other optical components and reached the CCD detector. The                         the (730 nm, 465 nm) pair in Ref. 14. The excitation-emission
                standard lamp spectrum supplied by the manufacture was                             pairs in Fig. 2(c) to 2(f) (EEMs for FAD, melanin, collagen, and
                then divided by the measured spectrum by the CCD to generate                       elastin, respectively) were also matched to certain extent with
                a calibration curve. The experimental tissue spectra were                          the reported results.10,14,15 These excitation-emission pairs are
                calibrated by multiplying with this calibration curve.                             summarized in Table 1. Because of the distinct EEM pattern
                                                                                                   of different fluorophores, it is helpful to use these fluorophore
                3     Results and Discussion                                                       signatures to characterize the physiologic/biologic composition
                                                                                                   of skin tissue from the measured EEMs.
                3.1       EEM of Extracted Endogenous Fluorophores
                                                                                                   3.2     EEM of Human Skin Tissue Ex Vivo
                To help the analysis of the EEM of skin tissue, we performed
                a comprehensive study of the two-photon EEM of extracted                           The following experiment was performed on a piece of fresh
                endogenous fluorophores in skin tissue, including NADH, FAD,                       normal skin (∼2-mm thick, ∼1 × 1 cm2 area) excised from
                keratin, melanin, elastin, and collagen. Figure 2 shows the two-                   the temple area. The bulk tissue without sectioning was used
                photon EEMs of the six endogenous fluorophores measured.                           directly for EEM measurements within 1 hour after excision.
                NADH, FAD, keratin, elastin, and collagen samples were mea-                        Using the optical sectioning capability of the multi-modality
                sured in the original condition (either dry powder or solution)                    system, five distinct layers as revealed by the TPF/SHG imaging
                from purchase. Melanin is measured in the 1 mg∕mL NH4 OH                           were measured at different depths from stratum corneum to the
                solution because its fluorescence is too weak for measurement                      dermis. All EEMs were acquired from the whole FOV of the
                when it is in the solid form. There is no measurable TPF signal                    correlated images.
                from NH4 OH solution, so no data processing was needed to                             TPF imaging channel is represented by the green pseudoco-
                separate contributions from melanin and NH4 OH. Excitation                         lor and SHG imaging channel is in red. As shown in Fig. 3,
                wavelength was tuned from 730 to 920 nm in 10-nm steps.                            imaging depths of the four sublayers in the epidermis are:
                In Fig. 2(a) to 2(d) are the main fluorophores in the cell-rich                    10, 20, 30, and 40 μm, respectively. The sublayer with an ima-
                epidermis layer, and Fig. 2(e) and 2(f) are the fluorophores                       ging depth of 60 μm is in the dermis compartment. FOV for all
                in the fiber-rich dermis layer. Due to the limited tunable wave-                   images is 100 × 100 μm2 and the scale bar in the figures repre-
                length range of our laser, we did not observe the full excitation-                 sents 20 μm2. All Images were taken under the excitation wave-
                emission maxima from the EEMs. The keratin EEM in Fig. 2(a)                        length of 790 nm and the excitation power of 30 mW. All the
                suggests that its excitation-emission maximum will occur at an                     images shown in Fig. 3 are averaged over 50 frames of raw
                excitation wavelength shorter than 730 nm and the emission                         images. As seen in Fig. 3(a), stratum corneum cells have
                wavelength close to 480 nm. Reference 13 measured the TPF                          large size. The EEM excitation-mission pair located at

                                         Table 1 Comparison of excitation-emission pairs of reported results and our measurement results.

                Fluorophore                           Measurement results (nm)                                                Reported results (nm)

                Keratin                                (760, 485), (860, 525)                                           (760, 475  5), (860, 515  5)

                NADH                                          (730, 460)                                                          (730, 465)

                FAD                                    (730, 550), (900, 543)                                               (730, 545), (900, 540)

                Melanin                                       (800, 579)                                                          (800, 565)

                Collagen                        (750, 458), (770, 475), (850, 510)                         (750, 461.9  0.2), (770, 472.5  0.2), (850, 503.0  0.2)

                Elastin                         (750, 454), (770, 472), (850, 508)                         (750, 457.9  0.4), (770, 465.5  0.4), (850, 503.3  0.5)

                Journal of Biomedical Optics                                               077004-4                                              July 2012   •   Vol. 17(7)

Downloaded From: https://www.spiedigitallibrary.org/journals/Journal-of-Biomedical-Optics on 08 Jan 2022
Terms of Use: https://www.spiedigitallibrary.org/terms-of-use
Yu et al.: Imaging-guided two-photon excitation-emission-matrix measurements : : :
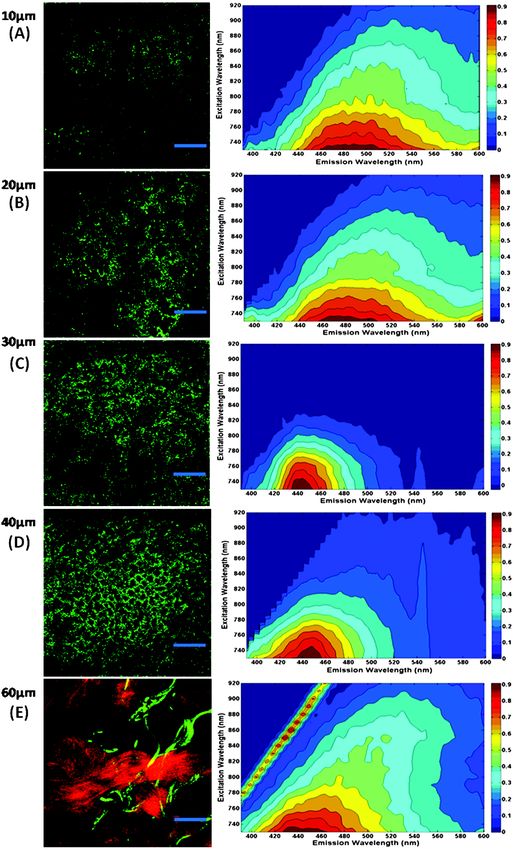
Fig. 3 Image-guided nonlinear EEM of normal human temple skin. Left column shows the pseudocolor image (TPF: green, SHG: red). Right column
shows related EEM. Imaging depths include 10, 20, 30, 40, and 60 μm (imaging FOV∶ 100 × 100 μm2, 50 frames averaged, scale bar: 20 μm, excitation
power: 30 mW, excitation wavelength: 790 nm. EEM measurement excitation wavelength: 730–920 nm, exposure time: 2 s, ROI∶ 100 × 100 μm2).
Journal of Biomedical Optics 077004-5 July 2012 • Vol. 17(7)
Downloaded From: https://www.spiedigitallibrary.org/journals/Journal-of-Biomedical-Optics on 08 Jan 2022
Terms of Use: https://www.spiedigitallibrary.org/terms-of-useYu et al.: Imaging-guided two-photon excitation-emission-matrix measurements : : :
Fig. 4 Cross section images of human skin tissue with SK. (a) Combined image of TPF and SHG channels by pseudocolor (TPF: green, SHG: red).
(b) Histology image with H&E staining (imaging FOV∶ 200 × 200 μm2, Blue square: 20 × 20 μm2).
(730 nm, 470 nm) is close to that of purified keratin as in our collagen fibers in skin tissue, which may be due to that the pur-
purified fluorophore measurement (730 nm, 480 nm). As we ification process has changed the structures of collagen.
imaged deeper, the number of cells increased, whereas the As an example of characterizing skin diseases, we investi-
size of the cells decreased. EEMs for the first two sub-layers gated a seborrheic keratosis (SK) tissue sample from the
[Fig. 3(a) and 3(b)] indicate that most of the TPF signals in shoulder region of a subject and compared with the results
these layers come from keratin, which mainly exists at and from normal skin. SK tissue usually has unique histologic char-
near the surface of skin. For the third and fourth sub-layers acteristics, such as basal cells mixed with squamous cells and
[Fig. 3(c) and 3(d)], the stratum spinosum and stratum basale, keratin-filled invaginations of the epithelium. As shown in
EEMs have the pattern and excitation emission pairs resembling Fig. 4, a slice of human shoulder SK skin is imaged with a
that of pure NADH as shown in Fig. 2(b). It indicates that most FOV of 200 × 200 μm2 for both two-photon images (TPF,
of the TPF signal in these layers originates from NADH. NADH SHG) and the histology image. This is a cross-section view
is significantly involved in redox reactions for metabolism; including epidermis and dermis compartments. Figure 4(a)
hence these EEMs show that cells are more active in stratum shows the overlay image of TPF and SHG channels (TPF in
spinosum and stratum basal layers [Fig. 3(c) and 3(d)], green, SHG in red), and Fig. 4(b) shows the matching H&E
which matches with the point of view of skin biology. Because stained histology image to the best extend.
cells in epidermis originate from stratum basale layer and keep EEMs are acquired from five small areas (ROI) on this cross
proliferating and migrating to the top layers, the cells at a deeper section as indicated by the blue squares (20 × 20 μm2) in Fig. 4.
layer are more active for metabolism. In Fig. 3(e), image and The EEMs are shown in Fig. 5 in the same order. In Fig. 5(a), the
EEM data have been obtained for one layer in the dermis com- EEM has a similar pattern and excitation-emission pair as that of
partment. SHG channel was added and optimized for this layer pure keratin sample. It is related to the blue square (a) in Fig. 4
(a) and 4(b), where keratin structure can be observed clearly in
for image-guidance purpose. The array of narrow peaks [along a
the histological image. In both Fig. 5(b) and 5(d), the EEMs
diagonal line started at (780 nm, 390 nm)] in the EEM plot com-
resemble that of pure NADH, which shows agreement with
prises SHG peaks with each emission peak located at exactly
the cellular structures as highlighted by the blue square (b)
one-half of the excitation wavelength, respectively. The SHG
and (d) in Fig. 4(a) and 4(b).
signal originates from collagen fiber in the dermis layer. The
In Fig. 5(c), EEM seems to be a mixture of signals originating
peaks with much broader bandwidth represent TPF signal.
from various structures. The contour pattern and excitation-emis-
TPF part of this EEM has a similar major excitation-emission sion pairs below excitation of 760 nm (black dotted line) are similar
pair of (730 nm, 450 nm) and overall pattern similar to both to pure keratin, while EEM above 760 nm shows similarity with
purified elastin and purified collagen. However, on the that of purified FAD sample in terms of the upright oriented EEM
image, we see well-distinguished red and green bundles. The pattern and similar major excitation-emission-pairs for individual
red bundles represent SHG signals that can only come from col- emission spectra, for example the pairs at (820 nm, 540 nm),
lagen fibers. Therefore, these large red colored bundles are col- (880 nm, 538 nm), and (900 nm, 535 nm) for the tissue are similar
lagen fibers for sure. They are pure red color without any green to the pairs at (820 mn, 548 nm), (880 nm, 542 nm), and (900 nm,
color component, indicating that collagen does not have signif- 540 nm) for the FAD sample. This spectral characteristic matches
icant fluorescence in this case (no TPF signal), otherwise they with the image signal in the blue square (c) on Fig. 4(b), which
would appear yellowish. Therefore, the measured TPF spectral includes both keratin and cellular structures in it. This analysis
signals must come mostly from elastin. Indeed the image shows shows the advantage of EEM compared with single emission spec-
pure green smaller fibers that must be elastic fibers because of trum or excitation spectrum, because this tissue characteristic can-
the lack of red color components and they are the dominant not be fully revealed using only one excitation wavelength or one
source of TPF spectral signals. SHG intensity in this EEM emission wavelength. More importantly, the EEM reveals the fact
plot was attenuated 20 times so that the contour details of that keratin structure has intruded into the middle sublayers of the
SHG and TPF signal can be displayed on a single plot. The epidermis part of the SK lesion. This result matches with the bio-
SHG/TPF ratio for purified collagen is different from that of logic characteristics of SK tissues, demonstrating the capability and
Journal of Biomedical Optics 077004-6 July 2012 • Vol. 17(7)
Downloaded From: https://www.spiedigitallibrary.org/journals/Journal-of-Biomedical-Optics on 08 Jan 2022
Terms of Use: https://www.spiedigitallibrary.org/terms-of-useYu et al.: Imaging-guided two-photon excitation-emission-matrix measurements : : :
Fig. 5 EEM for human skin tissue with SK. (a)–(e) are measured from the corresponding blue square areas in Fig. 4 (excitation wavelength: 730 to
920 nm; excitation power: 30 mW, exposure time: 2 s, ROI∶ 20 × 20 μm2).
great potential of applying the image-guided EEM for diagnosis Comparing the results from normal skin tissue with that from
of skin diseases. Figure 5(e) shows EEM for the last blue square SK, EEMs show different characteristics at different layers and
(e) in Fig. 4(a) and 4(b), which is located in the dermis layer mainly show reasonable agreement with the biochemical characteristics
containing fiber structures. The array of narrow peaks [along a of both tissue types. These results suggest the possibility of apply-
diagonal line started at (780 nm, 390 nm)] is related to SHG ing imaging-guided nonlinear EEM for skin disease diagnosis.
peaks from collagen. The TPF spectra have a contour pattern simi-
lar to both purified elastin and purified collagen, whereas the image 4 Conclusions
in Fig. 4(a), box (e) showed red color for the majority of pixels and We presented a nonlinear EEM spectroscopy system with multi-
yellow color for many other pixels nested within the red pixels. modality imaging guidance. The system was designed to opti-
(The green pixels near the upper-left corner appear more likely mize the imaging and spectroscopy performance in terms of
to be cellular components, not collagen/elastic fibers.) This sug- imaging speed, resolution, and emission collection efficiency.
gests that in this region of this SK lesion, collagen has great con- Preliminary experiments on purified skin fluorophores as
tributions to the TPF signals, different from normal dermal skin well as fresh normal and diseased skin tissues were carried
where elastin is the dominant TPF signal source. These differences out. With the depth-resolving capability, it revealed information
deserve further investigations. in distinct skin layers inside the epidermis and dermis
Journal of Biomedical Optics 077004-7 July 2012 • Vol. 17(7)
Downloaded From: https://www.spiedigitallibrary.org/journals/Journal-of-Biomedical-Optics on 08 Jan 2022
Terms of Use: https://www.spiedigitallibrary.org/terms-of-useYu et al.: Imaging-guided two-photon excitation-emission-matrix measurements : : :
compartments of bulk human skin tissue samples. Those EEMs 2. J. Paoli et al., “Multiphoton laser scanning microscopy on non-mela-
show reasonable agreement with the tissue biologic character- noma skin cancer: morphologic features for future non-invasive diag-
nosis,” J. Invest. Derm. 128(5), 1248–1255 (2008).
istics observed by both the multiphoton imaging and the histol-
3. J. Paoli, M. Smedh, and M. B. Ericson, “Multiphoton laser scanning
ogy images. In the stratum corneum and upper epidermis (up to microscopy: a novel diagnostic method for superficial skin cancers,”
20 μm in depth) of normal skin, the cells have large sizes and the Semin. Cutan. Med. Surg. 28(3), 190–195 (2009).
TPF fluorescence originates from keratin. In the lower epider- 4. R. Cicchi et al., “multidimensional non-linear imaging of basal cell
mis, cells are smaller and the TPF fluorescence is dominated by carcinoma,” Opt. Express 15(16), 10135–10148 (2007).
NADH contributions. We also further confirmed previous find- 5. Y. Wu and J. Y. Qu, “Two-photon autofluorescence spectroscopy and
ings that in the dermis of normal skin, SHG signals originate second-harmonic generation of epithelial tissue,” Opt. Lett. 30(22),
3045–3047 (2005).
from collagen, and that TPF are dominated by elastin compo- 6. L. H. Laiho et al., “Two-photon 3-D mapping of ex vivo human skin
nents. It has also revealed interesting differences between endogenous fluorescence species based on fluorescence emission
normal skin and SK tissues. The depth resolved EEM measure- spectra,” J. Biomed. Opt. 10(2), 024016 (2005).
ments demonstrated the fact that keratin structure has intruded 7. S. Zhuo et al., “The layered-resolved microstructure and spectroscopy
into the middle sublayers of the epidermis part of the SK lesion. of mouse oral mucosa using multiphoton microscopy,” Phys. Med. Biol.
These results suggest that the imaging guided TPF EEM spec- 52(16), 4967–4980 (2007).
8. W. Zheng et al., “Autofluorescence of epithelial tissue: single-photon
troscopy provides useful information for the development of versus two-photon excitation,” J. Biomed. Opt. 13(5), 054010
multiphoton clinical devices for skin disease diagnosis. (2008).
9. R. S. DaCosta, H. Andersson, and B. C. Wilson, “Molecular fluores-
cence excitation-emission matrices relevant to tissue spectroscopy,”
Acknowledgments Photochem. Photobio. 78(4), 384–392 (2003).
This work was funded by the Canadian Dermatology Founda- 10. J. Chen et al., “Spectroscopic characterization and microscopic imaging
tion, the Natural Sciences and Engineering Research Council of of extracted and in situ cutaneous collagen and elastic tissue compo-
Canada, the VGH and UBC Hospital Foundation In It for Life nents under two-photon excitation,” Skin. Res. Tech. 15(4), 418–426
(2009).
Fund, the BC Hydro Employees Community Services Fund, and 11. A. M. D. Lee et al., “In vivo video rate multiphoton microscopy imaging
the BC Cancer Agency. A.M.D.L. acknowledges the Michael of human skin,” Opt. Lett. 36(15), 2865–2867 (2011).
Smith Foundation for Health Research (MSFHR) and the Cana- 12. M. J. Sanderson, “Acquisition of multiple real-time images for laser
dian Institutes of Health Research Skin Research Training Cen- scanning microscopy,” Microscopy Anal. 18(4), 17–23 (2004).
tre (CIHR-SRTC) for postdoctoral fellowship support. H.W. 13. A. M. Pena et al., “Spectroscopic analysis of keratin endogenous signal
acknowledges CIHR-SRTC for doctoral fellowship support. for skin multiphoton microscopy,” Opt. Express 13(16), 6268–6274
(2005).
14. S. Huang, A. A. Heikal, and W. W. Webb, “Two-photon fluorescence
spectroscopy and microscopy of NADP(H) and flavoprotein,” Biophy. J.
References
82(5), 2811–2825(2002).
1. W. R. Zipfel, R. M. Williams, and W. W. Webb, “Nonlinear magic: 15. K. Teuchner et al., “Fluorescence studies of melanin by stepwise two-
multiphoton microscopy in the biosciences,” Nat. Biotechnol. 21(11), photon femtosecondlaser excitation,” J. Fluorescence. 10(3), 275–281
1369–1377 (2003). (2000).
Journal of Biomedical Optics 077004-8 July 2012 • Vol. 17(7)
Downloaded From: https://www.spiedigitallibrary.org/journals/Journal-of-Biomedical-Optics on 08 Jan 2022
Terms of Use: https://www.spiedigitallibrary.org/terms-of-useYou can also read