Ice velocity changes on Penny Ice Cap, Baffin Island, since the 1950s
←
→
Page content transcription
If your browser does not render page correctly, please read the page content below

Journal of Glaciology (2017), 63(240) 716–730                                                                               doi: 10.1017/jog.2017.40
              © The Author(s) 2017. This is an Open Access article, distributed under the terms of the Creative Commons Attribution licence (http://creativecommons.
              org/licenses/by/4.0/), which permits unrestricted re-use, distribution, and reproduction in any medium, provided the original work is properly cited.

                               Ice velocity changes on Penny Ice Cap, Baffin Island,
                                                 since the 1950s
                              NICOLE SCHAFFER,1,2 LUKE COPLAND,1 CHRISTIAN ZDANOWICZ3
                   1
                       Department of Geography, Environment and Geomatics, University of Ottawa, Ottawa, Ontario K1N 6N5, Canada
                         2
                          Natural Resources Canada, Geological Survey of Canada, 601 Booth St., Ottawa, Ontario K1A 0E8, Canada
                                        3
                                         Department of Earth Sciences, Uppsala University, Uppsala 75236, Sweden
                                             Correspondence: Nicole Schaffer

                            ABSTRACT. Predicting the velocity response of glaciers to increased surface melt is a major topic of
                            ongoing research with significant implications for accurate sea-level rise forecasting. In this study we
                            use optical and radar satellite imagery as well as comparisons with historical ground measurements to
                            produce a multi-decadal record of ice velocity variations on Penny Ice Cap, Baffin Island. Over the
                            period 1985–2011, the six largest outlet glaciers on the ice cap decelerated by an average rate of
                            21 m a−1 over the 26 year period (0.81 m a−2), or 12% per decade. The change was not monotonic,
                            however, as most glaciers accelerated until the 1990s, then decelerated. A comparison of recent
                            imagery with historical velocity measurements on Highway Glacier, on the southern part of Penny Ice
                            Cap, shows that this glacier decelerated by 71% between 1953 and 2009–11, from 57 to 17 m a−1.
                            The recent slowdown of outlet glaciers has coincided with increases in mass loss, terminus retreat
                            and an inferred reduction in basal sliding. Measured decelerations are greater than the total short-
                            term variability measured from both seasonal and interannual fluctuations, and support the hypothesis
                            that glacier thinning and/or increased meltwater production promotes a long-term reduction in ice
                            motion.
                            KEYWORDS: Arctic glaciology, glacier mass balance, ice cap, ice velocity, remote sensing

              1. INTRODUCTION                                                                         Bartholomew and others (2012) measured pronounced mul-
              Anomalously high summer temperatures over the last few                                  tiday speedup events inferred to be forced by rapid variations
              decades have resulted in sharply increased mass losses of                               in meltwater input to the subglacial system from diurnal and
              glaciers and ice caps in the Canadian Arctic Archipelago                                weather-related fluctuations. Similarly, Fitzpatrick and others
              (CAA), particularly since 2005 (Gardner and others, 2011;                               (2013) measured a dramatic acceleration (100% over 11
              Harig and Simons, 2016). Between 2003 and 2009, glaciers                                days) on the lower portion of an outlet glacier, located on
              and ice caps of Baffin and Bylot Islands in the southern CAA                            the western sector of the GIS, 4 days after the onset of melt.
              lost mass at an area-averaged rate 1.6 times greater than gla-                          Similar positive relationships between melt and short-term
              ciers in the northern CAA (Gardner and others, 2012).                                   velocity variations have been observed on temperate and
              Projections by a coupled atmosphere/snow model forced                                   polythermal valley glaciers (Iken, 1981; Mair and others,
              with the IPCC’s moderate RCP4.5 greenhouse gas emission                                 2003; Copland and others, 2003b) .
              scenario forecast sustained and irreversible glacier mass                                  However, other recent studies indicate that the relation-
              losses in the CAA, increasing from −51 ± 26 Gt a−1 over                                 ship between increased surface melt rates and glacier veloci-
              the period 2000–11 to −144 ± 33 Gt a−1 by the end of the                                ties is not straightforward. For example, Sundal and others
              21st century, resulting in a projected 18% loss of the cur-                             (2011) found a positive correlation between surface melt
              rent ice volume (Lenaerts and others, 2013).                                            rates and peak velocities during early summer (∼May to
                 A major unresolved question in assessing the response of                             mid-July) for land-terminating glaciers in southwestern
              Arctic glaciers to climate change is whether they will speed                            Greenland over a 5 year period, but found that mean
              up or slow down as surface melt rates increase.                                         summer velocity was lower during high melt years. A slow-
              Observations of short-term, high velocity events on some                                down occurred when a critical amount of meltwater
              parts of the Greenland ice sheet (GIS) in summer (Zwally                                entered the ice sheet, causing a switch to a channelized sub-
              and others, 2002) have led to concerns that accelerated ice                             glacial drainage network. In years with high surface melting
              motion may occur as the climate warms and surface melt                                  this switch occurred earlier in the summer, resulting in lower
              rates increase. In turn, this could produce dynamic thinning                            mean summer ice velocities compared with years with less
              (Alley and others, 2005) and greater drawdown of ice from                               melt. Simulations using subglacial hydrology models
              the interior, resulting in increasing mass wasting rates in                             support this pattern as they show that when the subglacial
              response to future warming (Parizek and Alley, 2004).                                   water inputs exceed a critical rate, subglacial channelization
              Several studies support the short-term speedup mechanism                                occurs rapidly (Schoof, 2010; Banwell and others, 2016).
              initially proposed by Zwally and others (2002), in that deliv-                          Other studies have identified a relationship between high
              ery of surface meltwater to the ice-sheet bed results in an                             summer melt rates and the evolution of a more efficient sub-
              over-pressurized basal drainage network, reduced basal fric-                            glacial drainage system, which results in lower velocities the
              tion and a short-term increase in ice motion. For example,                              following winter (Burgess and others, 2013; Sole and others,

Downloaded from https://www.cambridge.org/core. 05 Feb 2022 at 04:57:28, subject to the Cambridge Core terms of use.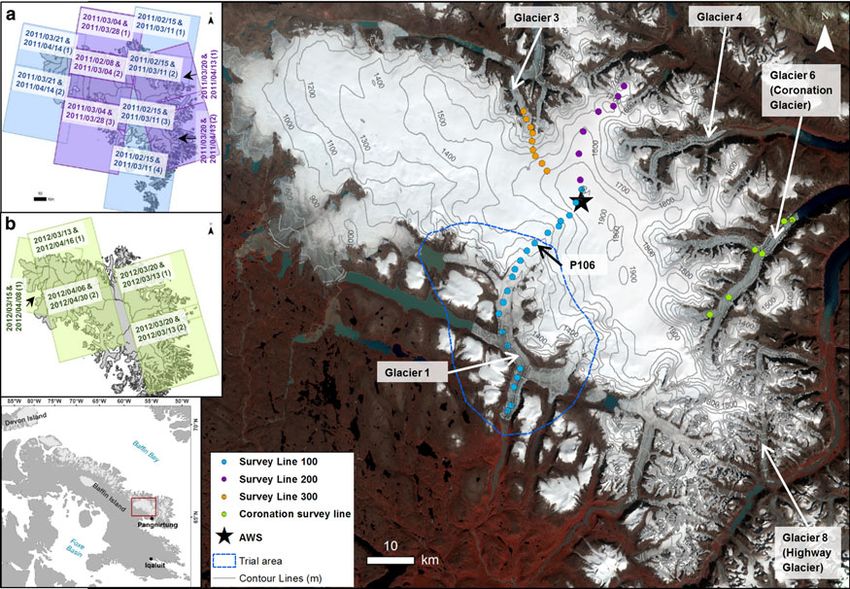
Schaffer and others: Ice velocity changes on Penny Ice Cap, Baffin Island, since the 1950s                                                           717

          2013; Tedstone and others, 2013). Long-term (≥8 years) ice                               largest land ice mass on Baffin Island, using optical and radar
          motion measurements from a land-terminating region of the                                remote sensing imagery updated to 2014, as well as compar-
          western GIS (Tedstone and others, 2015) and many other                                   isons of these data with earlier, historical field measurements.
          non-surging glaciers elsewhere (van de Wal and others,                                   In an earlier study, Heid and Kääb (2012b) used repeat satel-
          2008; Heid and Kääb, 2012b; Waechter and others, 2015;                                   lite optical imagery to assess velocity changes for parts of 12
          Thomson and Copland, 2017) also reveal decreasing ice vel-                               outlet glaciers on PIC between 1985 and 2011. The present
          ocities despite an overall increase in temperature and surface                           study examines velocity variations across the whole of PIC
          melt rates.                                                                              in much greater detail over the same period by producing a
             In the northern CAA, Van Wychen and others (2016)                                     complete ice-cap wide velocity map for 2011/12, and
          found a deceleration of several major tidewater glaciers                                 mapping ice motion along the centre flow lines and several
          since ∼2011, but two more than doubled their speed                                       transverse profiles for key outlet glaciers, rather than at a
          between 1999 and 2015, despite being non surge-type,                                     limited set of point locations, as was done by Heid and
          and now account for ∼62% of the total dynamic (iceberg)                                  Kääb (2012b). The acquired velocity data are also compared
          discharge from all ice masses in the northern CAA. Other                                 with in situ mass-balance data, and to estimates of ice mass
          measurements in the same region have identified ice velocity                             loss obtained with a time-varying mass-balance model.
          variations on timescales of years to decades, some of which                              These comparisons provide insights into the causes and pat-
          are related to glacier surging (e.g. Copland and others,                                 terns of ice velocity variability on one of the largest ice caps
          2003a, b; Williamson and others, 2008; Van Wychen and                                    in the CAA over the past 30–60 years.
          others, 2012, 2014). Together, these studies indicate that
          glacier velocities vary considerably across the Canadian
          Arctic, but it is currently unclear if observed long-term varia-                         2. STUDY SITE
          tions are related to contemporary changes in climate. Large                              PIC (67°N, 66°W) is the southernmost large Canadian Arctic
          Arctic ice masses can take hundreds of years to respond                                  ice cap, covering an area of ∼6300 km2 (Fig. 1). Higher top-
          dynamically to a change in mass balance (Oerlemans,                                      ography and relief dominate the eastern side of the ice cap,
          2005), so it is possible that the recent changes in ice                                  which reaches a maximum elevation of ∼1930 m at its
          motion may represent a delayed response to climate varia-                                summit. Toward the west, elevations decrease gradually
          tions in the distant past, rather than an immediate response                             and PIC terminates in a broad, gently sloping lobe-like
          to current changes in surface melt rates and/or marine condi-                            region. Major outlet glaciers radiate from the ice cap interior
          tions (e.g. ocean temperature, sea-ice extent). Understanding                            through deeply-incised valleys toward the north, east and
          this connection is important for projecting future changes in                            south. Two of these outlet glaciers are tidewater terminating:
          ice motion, and resulting glacier mass changes.                                          Coronation Glacier in the south-east, and an unnamed
             In this study, we present a multi-decadal record of ice vel-                          glacier in the north-central sector (Glacier 3). These
          ocity variations since the 1950s on Penny Ice Cap (PIC), the                             glaciers discharge 10.6 and 9.3 Mt a−1, respectively, which

          Fig. 1. Map of PIC (67°N, 66°W) with mass-balance survey lines, automatic weather station (AWS; star) and the block size trial area (blue
          polygon). RADARSAT-2 image pair footprints used to produce the velocity map shown in Figure 3 are included as insets for the (a) 2011
          fine beam and (b) 2012 ultrafine beam images. Background image: Landsat 5, 19 August 1985.

Downloaded from https://www.cambridge.org/core. 05 Feb 2022 at 04:57:28, subject to the Cambridge Core terms of use.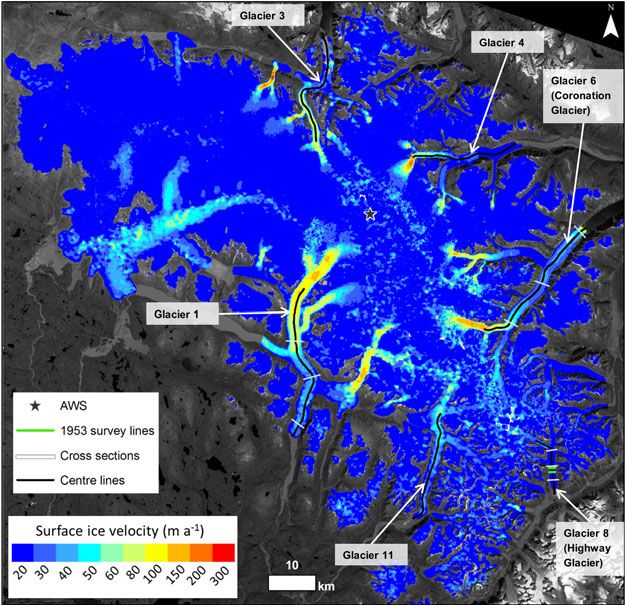
718                                                                Schaffer and others: Ice velocity changes on Penny Ice Cap, Baffin Island, since the 1950s

              accounted for 0.23% of the total mass loss over PIC in 2011                             1985–87 and 2009/10 over parts of 12 outlet glaciers.
              (Van Wychen and others, 2015). The mean, maximum and                                    Their results showed a mean decrease in ice motion of
              minimum air temperatures measured by an automatic                                       25% per decade, with the greatest change of more than
              weather station (AWS) at the PIC summit between 1 August                                −20 m a−1 on Coronation Glacier, Glacier 1 and Glacier 4
              2007 and 31 July 2008 were −15.4, 2.9 and −42.9°C,                                      (Fig. 1). Heid and Kääb (2012b) also investigated ice
              respectively. Annual surface mass balance (SMB) measure-                                motion during an intermediate period (1997/98) and found
              ments have been conducted on PIC since 2006 along three                                 that average speeds had increased by 1.5 m a−1 between
              survey lines (designated 100, 200 and 300; Fig. 1). Based                               1985–87 and 1997/98, then decreased by 11.3 m a−1
              on these measurements, the mean equilibrium line altitude                               between 1997/98 and 2009/10 over the 12 outlet glaciers
              (ELA) between 2006 and 2014 was ∼1646 m, varying                                        measured. More recently, Van Wychen and others (2015)
              between ∼1320 m in low mass loss years to 1820 m during                                 used speckle-tracking of winter 2010/11 ALOS PALSAR
              high mass loss years. The average SMB along the 100                                     Synthetic Aperture Radar satellite data to show that the
              survey line (Fig. 1), which covers an elevation range 329–                              interior and the western sectors of PIC were slow-moving
              1817 m, was −1.3 m w.e. a−1 between 2007 and 2014,                                      (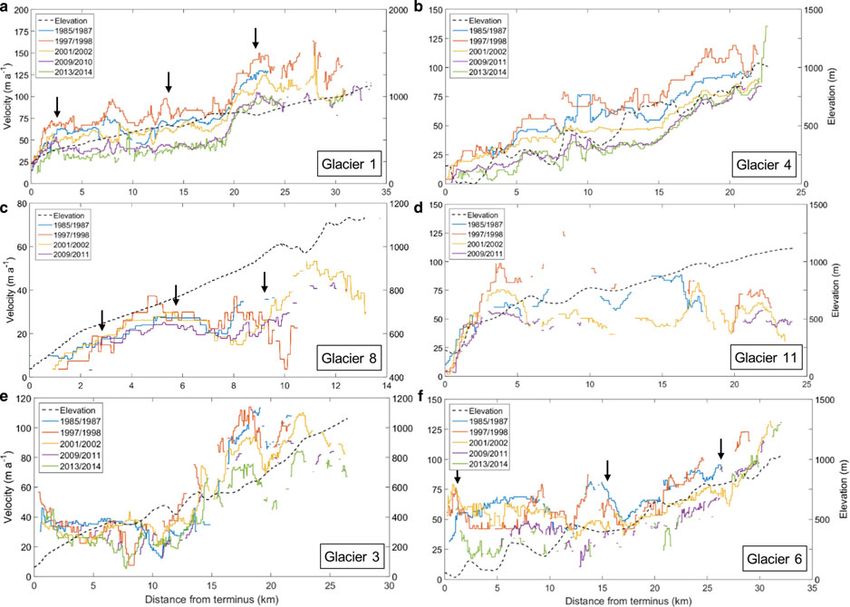
Schaffer and others: Ice velocity changes on Penny Ice Cap, Baffin Island, since the 1950s                                                                    719

          analysis was generally restricted to the ablation area and cre-                          Table 2. RADARSAT-2 image pairs used in this study
          vassed parts of the accumulation area.
              Features visible in any two Landsat images were tracked                              Image t = 1                  Image t = 2                 Image segment
          using automatic matching of image pairs with a cross-correl-                             YYYY/MM/DD                  YYYY/MM/DD
          ation method that operates in the frequency domain using
                                                                                                   2011/02/08                    2011/03/04                        2
          oriented (complex) images (CCF-O), called orientation cor-                               2011/02/15                    2011/03/11                        1
          relation (Fitch and others, 2002). This method performed                                 2011/02/15                    2011/03/11                        2
          best in a global evaluation of glacier feature tracking                                  2011/02/15                    2011/03/11                        3
          methods that are effective on striped Landsat 7 images                                   2011/02/15                    2011/03/11                        4
          (Heid and Kääb, 2012a). The outer portions of Landsat 7                                  2011/03/04                    2011/03/28                        1
          images are striped from 31 May 2003 onwards due to the                                   2011/03/04                    2011/03/28                        3
                                                                                                   2011/03/20                    2011/04/13                        1
          failure of the scan line corrector (http://www.lta.cr.usgs.gov/
                                                                                                   2011/03/20                    2011/04/13                        2
          LETMP). The image correlation software CIAS (Kääb and                                    2011/03/21                    2011/04/14                        1
          Vollmer, 2000; Heid and Kääb, 2012a), which includes                                     2011/03/21                    2011/04/14                        2
          CCF-O, was used for the optical image analyses (http://                                  2012/03/13                    2012/04/06                        1
          www.mn.uio.no/geo/english/research/projects/icemass/cias).                               2012/03/15                    2012/04/08                        1
              CCF-O converts Landsat images to oriented images,                                    2012/03/20                    2012/04/13                        1
          where each pixel is a complex number that represents the                                 2012/03/20                    2012/04/13                        2
                                                                                                   2012/04/06                    2012/04/30                        2
          orientation of the intensity gradient (Fitch and others, 2002;
          Heid and Kääb, 2012a). The oriented images are matched                                   The 2011 imagery is fine beam (8 m resolution), while the 2012 imagery is
          by systematically correlating a block of pixel values in the                             ultrafine beam (3 m resolution). See Figures 1a, b for image footprints.
          first image with the same size block moved repeatedly
          within a larger window size in the second image. Cross cor-
          relation is operated in the frequency domain and a cross-cor-                            and Gray (2005), modified to process RADARSAT-2 data
          relation surface, representing matches between the reference                             (Van Wychen and others, 2014). The program tracks the
          block in the first image and the block position within the                               relative displacement of small image chips by applying a
          window in the second image, is produced. The peak of this                                two-dimensional cross-correlation algorithm to accurately
          cross-correlation surface represents the best match from                                 co-registered image pairs (co-registration was completed
          which the displacement between the blocks is calculated.                                 using an area cross-correlation technique; Gray and others,
              We determined an optimal image matching block size                                   2001). If there is good coherence between image pairs, the
          and Landsat band for each image pair after testing various                               radar speckle in the two image chips will be correlated and
          options on a trial area of ∼40 km2 (Fig. 1; Table 1). A                                  a calculation of relative displacement can be made. If
          search area twice the block size and a velocity vector                                   obvious features are present (e.g. crevasses), the program
          spacing of 120 m were used for all image pairs. Point velocity                           will track the displacement of those features instead (Short
          mismatches were removed from the dataset (Section 3.3)                                   and Gray, 2005). Displacements were calculated for both
          and the remaining vectors were interpolated to a raster                                  azimuth and range directions using chip sizes of ∼453 m in
          with 120 m grid spacing using the point to raster conversion                             azimuth and ∼688 m in range for the fine beam imagery,
          tool in ArcMap 10.3.1. Final rasters were clipped to PIC using                           and ∼177 m in azimuth and ∼188 m in range for the ultrafine
          the Randolph Glacier Inventory glacier outline version 4.0                               beam imagery. These chip sizes were chosen to provide a
          (Pfeffer and others, 2014). Velocities along centre flow line                            balance between high noise at small chip sizes and lack of
          and transverse profiles on the major outlet glaciers of PIC                              velocity detail at large chip sizes. The Canadian Digital
          were extracted from the rasters for every decade of the                                  Elevation Dataset (1 : 250,000, Level 1) was used to remove
          study period to quantify changes in ice motion through                                   the topographic component of the slant-range displacement.
          space and time.                                                                          Displacements were calibrated using manually selected
                                                                                                   areas of zero motion, such as bedrock outcrops, to remove
                                                                                                   systematic biases due to inaccuracies in the baseline or
          3.2. Speckle tracking (radar imagery)                                                    squint effects during image acquisition (Gray and others,
          To investigate the recent spatial variability in ice motion in                           2001).
          areas where optical image matching does not work (e.g.,                                      Final displacements were converted to annual velocities.
          the accumulation area), we produced an ice cap-wide map                                  Image pair results with the least number of mismatches
          of glacier motion from speckle tracking of RADARSAT-2                                    were selected, prioritizing the higher resolution 2012
          data. Scenes were acquired from the Canadian Space                                       results for fast flowing areas (Fig. 1). Point velocities were fil-
          Agency every 24 days between 5 February and 28 April                                     tered to remove mismatches (Section 3.3), merged into one
          2011, and 13 March to 26 April 2012. Images from a                                       file and interpolated to 100 m grid spacing using the
          period of below-freezing temperatures (hereafter: ‘winter’)                              inverse-distance weighting method with a fixed 500 m
          were selected to maximize coherence, which can be ham-                                   search radius in ArcMap 10.3.1. The final raster was
          pered when there is surface melt or snowfall between                                     clipped to the area of PIC using the outline provided by the
          scenes. In total, 11 image pairs from 2011 (fine beam; 8 m                               Randolph Glacier Inventory version 4.0 (Pfeffer and others,
          resolution) and five image pairs from 2012 (ultrafine beam;                              2014).
          3 m resolution) were used to cover the entire ice cap
          (Table 2; Fig. 1). Whenever possible, the higher resolution
          2012 images were prioritized for fast flowing areas.                                     3.3. Filtering velocity vectors
             Ice surface motion was determined using a custom-written                              Incorrect matches are occasionally produced by the feature
          Matlab speckle-tracking code based on that used by Short                                 tracking and speckle-tracking algorithms when there are no

Downloaded from https://www.cambridge.org/core. 05 Feb 2022 at 04:57:28, subject to the Cambridge Core terms of use.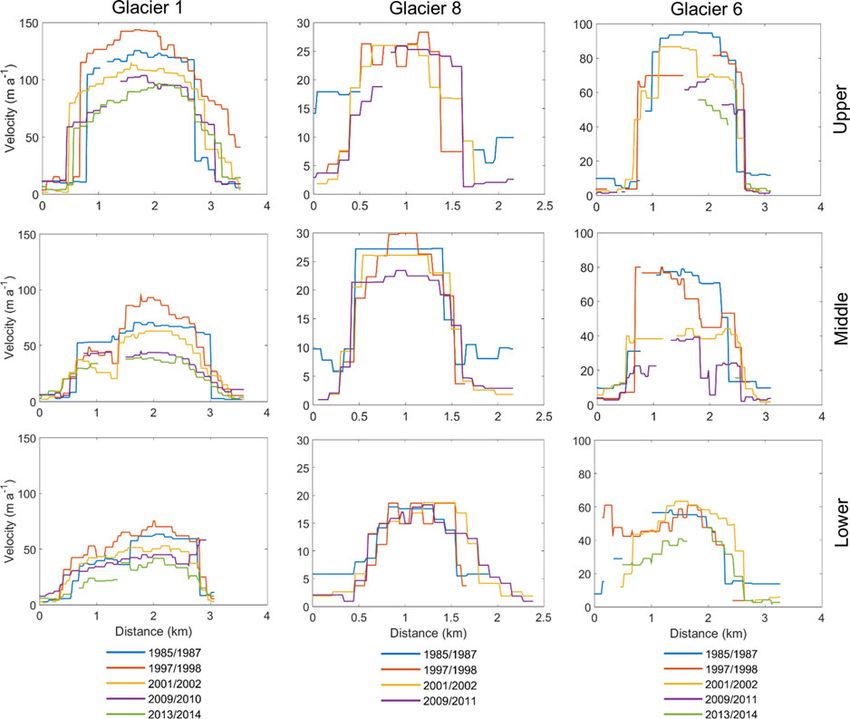
720                                                                Schaffer and others: Ice velocity changes on Penny Ice Cap, Baffin Island, since the 1950s

              repeatable patterns to track or if there is a pattern shift not                         errors of ∼10–20 m a−1 (Short and Gray, 2005). Based on
              associated with glacier movement. For example, a lack of                                130,727 measurements of apparent motion over bedrock
              patterning can occur if there is snow cover present for                                 areas, the mean error associated with speckle tracking of
              feature tracking, or if there is a lack of coherence due to                             RADARSAT-2 data over PIC was 5.6 m a−1. For 13,233
              snowfall or melt between repeat images used for speckle                                 measurements along ice divides where zero horizontal
              tracking. Velocity vector outputs from feature and speckle                              motion was assumed, the mean error was 10.4 m a−1
              tracking were therefore checked manually and filtered in                                (Table 3). Ice divides delineated in version 4.0 of the
              ArcMAP, following the methodology of Copland and others                                 Randolph Glacier Inventory were used for this analysis.
              (2009), Van Wychen and others (2014) and Waechter and                                   The estimated errors over bedrock and ice divides are suffi-
              others (2015). Three criteria were used for filtering:                                  ciently low to confidently map the ice motion over all major
                                                                                                      outlet glaciers on PIC and provide meaningful results in
              (a) The direction of ice motion should follow surface flow                              slower moving areas.
                  features (e.g. medial moraines) and topography where
                  motion is constrained;
              (b) The ice motion direction or magnitude should not                                    3.5. Seasonal and interannual variability
                  change dramatically (∼≥45°) over short distances;                                   Glacier motion varies seasonally and from year to year in
              (c) Motion should generally be faster at the centre of the                              response to short-term fluctuations in meltwater availability,
                  glacier than at the margins.                                                        among other factors. To evaluate if the observed long-term
                                                                                                      (decadal) velocity changes were meaningful, we quantified
                 The filtering was partially automated by finding the area                            the ice motion variability on interannual and seasonal
              with the highest velocities in a region of interest (e.g. an                            timescales.
              outlet glacier) and calculating the 99% confidence interval                                The interannual variability was calculated from in situ
              for the fastest flowing part of the region. Point velocities                            dual-frequency GPS (dGPS) measurements collected
              that fell outside the 99% confidence interval were auto-                                between 2011 and 2014 along three mass-balance transects
              matically removed. Remaining vectors were then manu-                                    (Fig. 1; Table 4), and by optical matching of Landsat images
              ally removed if they (a) did not meet two or more of the                                from 2008 to 2014 (Table 1). Velocities measured using these
              criteria outlined above or (b) did not meet one of the cri-                             methods along a glacier centre flow line were used to
              teria and there was no plausible reason for the anomalous                               compute the standard deviation (σ), corrected for the total
              vector(s).                                                                              number of measurements (n) at each location. The 95% con-
                                                                                                      fidence interval, representing the interannual variability, was
                                                                                                      then calculated from 1:96ðσ=√nÞ.
              3.4. Error analysis                                                                        To estimate the seasonal variability, we computed the dif-
              The accuracy of the CCF-O matching method is stated as ∼1/                              ference between the annual motion derived from the in situ
              10 of a pixel (Heid and Kääb, 2012a). In Landsat images, the                            dGPS measurements, and the winter synthetic aperture
              pixel noise limits the image-to-image registration accuracy to                          radar (SAR) velocities derived from the RADARSAT-2
              ∼5 m for the ETM+ sensor (Lee and others, 2004) and ∼6 m                                (2011/12) data processed for this study and from the ALOS
              for the TM sensor (Storey and Choate, 2004). In this study, the                         PALSAR (2010/11) data processed by Van Wychen and
              apparent motion of 703,902 points located on ice-free stable                            others (2015). The SAR velocity values at each dGPS meas-
              ground was, on average, 5.4 m a−1, and ranged from 3.5 to                               urement location were extracted and the difference
              9.2 m a−1 depending on the image pair (Table 3). We                                     between the annual dGPS and winter SAR velocities, stan-
              assume that this provides a representative error for our                                dardized to annual values, were calculated. The total short-
              study, encompassing the effects from all sources. This error                            term variability was calculated from the root sum of
              level enables an effective determination of glacier motion                              squares of the interannual and seasonal variability, assuming
              since the speed of most outlet glaciers on PIC (∼100–120                                the two terms to be uncorrelated.
              m a−1) far exceeds this amount.
                 Errors associated with the speckle tracking method and
              associated cross-correlation technique are discussed in                                 3.6. Mass balance
              Gray and others (2001), Joughin (2002), Short and Gray                                  To assess potential controls on long-term variations in ice
              (2004) and Van Wychen and others (2012). For 24-day                                     motion, we calculated annual in situ SMB from the 100
              repeat imagery with good coherence, speckle tracking pro-                               survey line between 2007 and 2014 (Fig. 1), and also used
              vides velocity errors of 2–10 m a−1 in the Canadian Arctic                              estimated SMB outputs from 1958 to 2014 from the regional
              (Short and Gray, 2005). In heavily crevassed, faster-flowing                            atmospheric climate model RACMO2.3 (Lenaerts and others,
              regions, the program switches to feature tracking with                                  2012; Noël and others, 2015). The RACMO2.3 model is

              Table 3. Error estimates for surface ice velocities on PIC determined from apparent motion over stationary areas (bedrock (BR) and ice divides
              (ID)) for both feature tracking (optical imagery) and speckle tracking (SAR)

              Imagery               1985–87                1997/98                2001/02                2009/10         2011/12              2011/12             2013/14
                                      BR                     BR                     BR                     BR              BR                   ID                  BR

              Optical               9.2 ± 3.6              3.5 ± 5.1              3.9 ± 4.0              4.8 ± 3.7                                                5.5 ± 4.3
              SAR                                                                                                        5.6 ± 4.8           10.4 ± 7.9

              Values represent the average ice motion, while error values are the standard deviation. All values are in m a−1.

Downloaded from https://www.cambridge.org/core. 05 Feb 2022 at 04:57:28, subject to the Cambridge Core terms of use.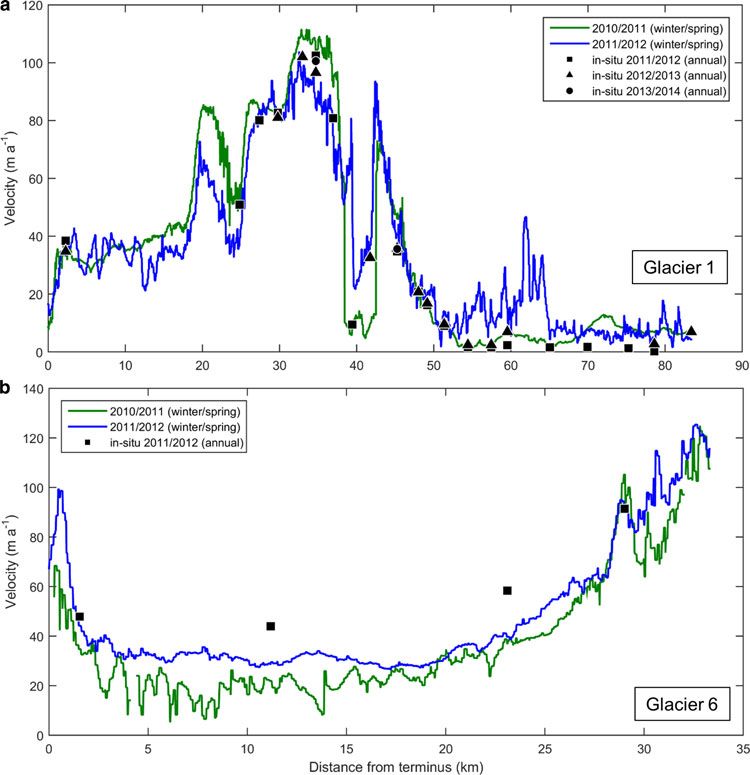
Schaffer and others: Ice velocity changes on Penny Ice Cap, Baffin Island, since the 1950s                                                               721

          Table 4. Comparison of displacements derived from in situ dGPS (annual) and satellite derived ice motion (winter) for Glaciers 1 and 6 (loca-
          tion of dGPS stations denoted in Fig. 1). The latitude (lat.), longitude (long.), distance from the glacier terminus (dist.), velocities at each stake
          location (dGPS), corresponding SAR velocity (SAR) and the difference in velocity between the dGPS and SAR datasets (Diff.) are provided

          Lat.                                         Long.             Dist.                        dGPS                            SAR                      Diff.

                                                                                                     m a−1                            m a−1                   m a−1

          °N                                            °W                km              2011/12            2012/13        2010/11           2011/12       SAR-dGPS

          Glacier 1 (land-terminating)
          Survey line 100
          67.28                                       −65.85                57               1.5                 2.4           1.8             14.1             6.0
          67.25                                       −65.88                54               1.7                 2.4           1.1             11.1             4.1
          67.23                                       −65.91                51               9.0                 9.6           9.2             14.0             2.4
          67.22                                       −65.96                49              16.1                16.7          18.9             19.4             2.7
          67.21                                       −65.97                48              20.8                20.7          17.9             22.8            −0.4
          67.20                                       −66.02                45              34.8                35.8          47.9             40.6             9.0
          67.18                                       −66.09                42               –                  32.6           –                –              −9.3
          67.16                                       −66.13                39               9.4                 –             9.1             44.4            17.3
          67.15                                       −66.16                37              80.9                 –            91.6             74.7             2.3
          67.13                                       −66.19                35             102.5                96.6         103.4             84.3            −5.7
          67.12                                       −66.21                33               –                 102.1           –                –              −0.5
          67.09                                       −66.23                30              82.7                81.0          82.8             80.2            −0.4
          67.07                                       −66.26                27              80.1                 –            84.0             83.7             3.8
          67.05                                       −66.28                25              50.9                 –            53.8             39.4            −4.3
          66.86                                       −66.26                 2              38.4                34.8          34.4             34.2            −2.3
          Survey line 200
          67.29                                       −65.85               60                 2.3                 6.9           6.9            15.1             6.3
          67.34                                       −65.85               65                 1.6                 –             1.4             4.3             1.3
          67.39                                       −65.83               70                 1.6                 –             8.0             7.7             6.2
          67.42                                       −65.75               75                 1.3                 –             7.7             6.4             5.8
          67.43                                       −65.67               79                 0.2                 2.7           6.7             3.9             3.9
          67.47                                       −65.61               83                 –                   6.9           7.9             4.3            −0.8
                                                                         Mean                                                                                   2.2
          Glacier 6 (water-terminating)
          Coronation survey line
          67.03                                       −65.26               29                91.4                 –          105.2             90.9             6.7
          67.06                                       −65.16               23                58.3                 –           37.0             39.7           −20.0
          67.13                                       −64.99               11                43.9                 –           21.9             29.5           −18.2
          67.19                                       −64.83                2                47.8                 –           34.8             44.2            −8.4
                                                                         Mean                 –                   –            –                –             −10.0

          forced by ERA-interim, the most recent reanalysis data from                               4. RESULTS
          the European Centre for Medium-Range Weather Forecasts.
          It includes a scheme for snow redistribution, and outputs                                 4.1. Ice cap-wide velocity patterns
          SMB data at a grid resolution of 11 km.                                                   The SAR-derived velocity map of PIC shows that most of the
              We assessed how well the model represents measured                                    ice cap is slow-moving (
722                                                                Schaffer and others: Ice velocity changes on Penny Ice Cap, Baffin Island, since the 1950s

              elevation regions in the accumulation area, with faster                                 pronounced increase in velocity at their termini, while
              motion limited to topographically constrained outlet glaciers                           land-terminating glaciers show decreasing velocities at
              (Fig. 3). The highest velocities occur in areas of high relief on                       their termini.
              the upper reaches of outlet glaciers and range from ∼100 to                                Most glaciers show considerable velocity changes over
              250 m a−1. Low velocities over much of PIC suggest that the                             time. For example, velocities over the majority of the ablation
              ice is frozen to the bed and flowing by internal deformation                            area of Glacier 1 showed a significant decrease between
              only, whereas areas of higher velocity likely represent a tran-                         1985–87 and 2013/14 (Fig. 4). When analyzed in more
              sition from cold to warm basal conditions as the ice is chan-                           detail, however, it is clear that the glacier velocity changes
              nelled into topographically constrained valleys, allowing for                           were not uniform through the study period. For all glaciers
              basal sliding in addition to deformation (Burgess and others,                           except Glacier 6, velocities increased from 1985–87 to
              2005; Van Wychen and others, 2016).                                                     1997/98, and decreased thereafter. For example, Glacier 1
                                                                                                      velocities increased by an average of 13.0 m a−1 between
                                                                                                      1985–87 and 1997/98, and decreased by 34.5 m a−1
              4.2. Velocity changes through time                                                      between 1997/98 and 2009/10. On Glacier 4, velocities
              The annual velocities derived from optical image matching                               increased by 9.9 m a−1 in the first 12 year period and
              show clear patterns and temporal changes over most of the                               decreased by 32.4 m a−1 in the second 12 year period. In
              major outlet glaciers (Figs 4, 5). Individual velocity vectors                          contrast, velocities on Glacier 6 decreased by 6.2 m a−1 in
              align well with glacier flow features, such as medial mor-                              the first period and further decreased by 19.7 m a−1 in the
              aines, which provides confidence in the results (Fig. 4                                 second period.
              insets). To visualize the flow patterns, centre flow line veloci-                          The temporal and spatial variability along the centre flow
              ties were extracted for the ablation area of the six outlet gla-                        line for the three glaciers with the most complete records is
              ciers with the best data coverage between 1985 and 2014:                                shown in Figure 6. In general, velocities initially increased
              four land-terminating (Glaciers 1, 4, 8, 11) and two tide-                              until 1998, and decreased thereafter for the two land-termin-
              water-terminating (Glaciers 3, 6) (Figs 3, 5). For most glaciers,                       ating glaciers (Glaciers 1 and 4), and also between 25 and
              velocities are highest near the top of their ablation areas. The                        35 km up-ice from the terminus of Glacier 6. Lower portions
              main exception is Glacier 11, which has relatively low                                  of Glacier 6 showed a different pattern, with decreasing vel-
              overall velocities and does not have a distinct area of high                            ocities from 1985 to 2014 between 5 and 25 km from the ter-
              velocity up-glacier. On Glaciers 1, 3 and 6 there is a notice-                          minus, and an increase in velocities after 1998 within 5 km of
              able decrease or levelling of velocities at 20, 15 and 17 km                            the glacier terminus.
              from the terminus, respectively, associated with areas of                                  Figure 7 summarizes the changes in glacier velocity pre-
              relatively flat topography. On Glacier 3, a large peak in vel-                          sented on Figures 5, 6. The mean values along the centre
              ocity at ∼17 km likely arose due to the merging of a tributary                          flow line for each year (e.g. 1985/87) were calculated,
              with the main glacier trunk. Tidewater glaciers show a                                  excluding points missing data for one or more years.

              Fig. 3. RADARSAT-2 derived surface velocity map of PIC from images acquired in winter 2011 and 2012 (see Fig. 1). The location of the
              automatic weather station (AWS; star), glacier cross sections (white bars), centre flow lines (black lines), and sites of velocity measurement
              from 1953 on Highway Glacier (green bars; Ward, 1955) are indicated. Background image: Landsat 5, 22 July 1998.

Downloaded from https://www.cambridge.org/core. 05 Feb 2022 at 04:57:28, subject to the Cambridge Core terms of use.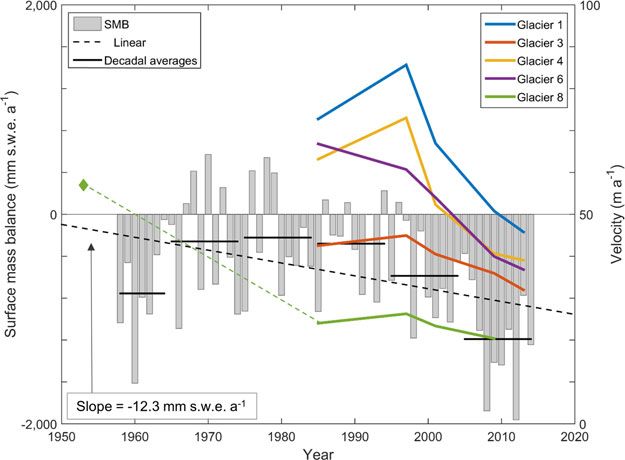
Schaffer and others: Ice velocity changes on Penny Ice Cap, Baffin Island, since the 1950s                                                   723

          Fig. 4. Spatial distribution of surface velocities on Glacier 1 between (a) 1985–87 and (b) 2013/14 from feature tracking of optical image pairs.
          Insets show individual velocity vectors.

          Fig. 5. Surface velocity changes from 1985 to 2014 for land-terminating (Glaciers 1, 4, 8, 11) and tidewater-terminating (Glaciers 3, 6) centre
          flow lines on PIC derived from feature tracking of optical image pairs. The locations of transverse profiles shown in Figure 9 are indicated with
          black arrows.

Downloaded from https://www.cambridge.org/core. 05 Feb 2022 at 04:57:28, subject to the Cambridge Core terms of use.
724                                                                Schaffer and others: Ice velocity changes on Penny Ice Cap, Baffin Island, since the 1950s

              Fig. 6. Surface velocity changes from 1985 to 2014 on PIC for the three outlet glaciers with the most continuous data coverage. Each series
              represents the averaged velocity over a section of the centre flow line identified by its distance from the terminus.

              Glacier 11 was not included in this figure because the data                             stakes A and B, indicating that the stake measurements
              are so sparse that an average value would not be meaningful.                            were representative of annual motion. Our own measure-
              Between 1985 and the most recent velocity estimate (2011 or                             ments show that the average ice motion over these two his-
              2014), all six PIC outlet glaciers decelerated (Figs 5, 7). This                        torical transects slowed by ∼71% from 57 m a−1 in 1953 to
              deceleration has coincided with terminus retreats, measured                             17 m a−1 in 2009–11, with consistent velocity decreases at
              along the centreline of each glacier, of 178, 380, 840 and                              all stakes (Fig. 8).
              939 m, respectively, for land-terminating Glaciers 1, 4, 8                                  Transverse profiles across the upper, middle and lower
              and 11, and with retreats of 973 and 820 m for tidewater                                sections of the ablation area of three glaciers (Glaciers 1, 8,
              Glaciers 3 and 6, respectively. On Highway Glacier                                      6) showed an increase in motion between 1985–87 and
              (Glacier 8), historical measurements allow a reconstruction                             1997/98, followed by a decrease thereafter (Fig. 9).
              of velocity changes over the past 58 years. From stake mea-                             Transverse profiles can aid in identifying the relative import-
              surements made along two transverse profiles ∼0.87 km                                   ance of basal sliding vs internal deformation. Where basal
              apart with a mean elevation of 760 m a.s.l., Ward (1955) esti-                          sliding dominates, ice tends to move with high and relatively
              mated the mean annual surface velocity of the glacier to be                             constant velocities near the glacier centre, and velocities
              57 m a−1 over a 38 day period in July and August 1953                                   decrease rapidly close to the margins (Kamb and others,
              (Figs 3, 8). He also calculated the annual surface motion                               1985; Fatland and others, 2003; Copland and others,
              from the change in position of a medial moraine (situated                               2009). This has been termed blockschollen (or plug flow)
              between stakes A and B; Fig. 8) between 1948 air photos                                 by Kick (1962). In contrast, glaciers that flow primarily by
              and 1953 field measurements. A mean annual ice velocity                                 internal ice deformation usually display a transverse velocity
              of 60 m a−1 was obtained, which compared well with                                      pattern where motion decreases gradually from the centre
              equivalent annual speeds of 50 and 74 m a−1 measured at                                 flow line towards the margins. On PIC, the transverse flow

              Fig. 7. Comparison of velocity and mass-balance changes observed on PIC since the early 1950s: Average annual glacier velocities derived
              from optical imagery (1985–2014), the ice cap-wide average annual and decadal mean SMB simulated by RACMO2 (1958–2014), linear SMB
              trends over the same period and the average 1953 velocity on Highway Glacier (Glacier 8) calculated from eight stake measurements (green
              diamond; Ward, 1955).

Downloaded from https://www.cambridge.org/core. 05 Feb 2022 at 04:57:28, subject to the Cambridge Core terms of use.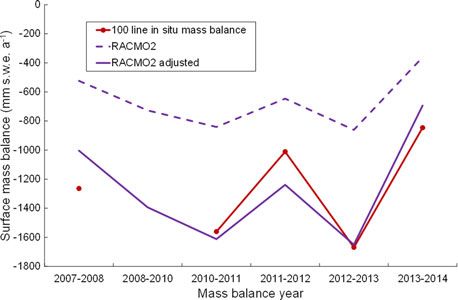
Schaffer and others: Ice velocity changes on Penny Ice Cap, Baffin Island, since the 1950s                                                           725

                                                                                                   from four locations on Glaciers 1 and four locations on
                                                                                                   Glacier 6 were ±8.9 m a−1 and ±3.7 m a−1, respectively.
                                                                                                   The minimum confidence interval for Glacier 1 was found
                                                                                                   near the terminus, and for Glacier 6 it was ∼10–25 km
                                                                                                   from the glacier terminus.
                                                                                                       To calculate the seasonal variability, speckle tracking vel-
                                                                                                   ocities were extracted along a transect that started at each
                                                                                                   glacier terminus and connected the dGPS points (Fig. 11,
                                                                                                   Table 4). The average difference between all the dGPS
                                                                                                   annual point velocities and SAR-derived winter velocities at
                                                                                                   the same location was 2.2 m a−1 (std dev. = 8.0 m a−1) for
                                                                                                   Glacier 1. This figure is within the error limits of the SAR
                                                                                                   data (±5.6 m a−1), indicating that there was no significant dif-
                                                                                                   ference between winter and annual velocities for this glacier.
                                                                                                   In contrast, on Glacier 6 the differences averaged −10.0 m a−1
                                                                                                   (std dev. = 12.4 m a−1), which was outside of the SAR error
                                                                                                   limits, indicating that winter velocities were significantly
                                                                                                   lower than annual velocities on this glacier. The deviation
                                                                                                   between winter and annual velocities was greatest in the
                                                                                                   centre of Glacier 6, ∼10–25 km from the terminus.
                                                                                                       The total short-term variability was estimated from the root
                                                                                                   sum of squares of the seasonal and interannual variability.
                                                                                                   For land-terminating Glacier 1, this was ±8.9 m a−1 and for
                                                                                                   tidewater Glacier 6 it was ±12.9 m a−1. The mean net decel-
                                                                                                   eration between 1985 and 2011, for the four land-terminat-
                                                                                                   ing glaciers was −25.5 m a−1 and for the two tidewater
                                                                                                   glaciers it was −20.3 m a−1, well above recent short-term
                                                                                                   motion variability. All glaciers except Glacier 6 accelerated
                                                                                                   from 1985–87 to 1997/98, and all decelerated from 1997/
          Fig. 8. Velocity stake measurements from 1953 on the upper (A-D)                         98 to 2009–11. The velocity changes in the first 12-year
          and lower elevation (α-δ) Highway Glacier transverse transects                           period for all tidewater glaciers and Glacier 8 were within
          (Ward, 1955; Fig. 3) with annual optical imagery results extracted                       the range of total short-term variability, whereas the
          along the same transect. Zero motion in 1953 was assumed to                              changes in the second 12-year period exceeded the short-
          occur at the glacier edge defined using the oldest Landsat image                         term variability for Glaciers 1, 4, 6 and 11. When averaged
          available (16 August 1975).                                                              over all glaciers, velocity changes in the second period
                                                                                                   exceeded the short-term velocity variability for both land
                                                                                                   (−23.6 m a−1) and tidewater (−14.5 m a−1) glaciers.
          patterns of Glaciers 1 and 6 show a rapid decrease in velocity
          near the glacier margins, typical of flow dominated by basal
          sliding, during years with faster flow (e.g. 1997/98), or in
          areas of higher flow (e.g. the upper glacier; Fig. 9). In con-                           5. DISCUSSION
          trast, lower flow years and slower moving parts of these gla-
                                                                                                   This widespread deceleration across PIC between 1985 and
          ciers, are generally characterized by a transverse flow profile
                                                                                                   2011 or 2014 (Figs 5, 7) suggests that it is primarily driven by
          more typical of internal ice deformation. Glacier 8 maintains
                                                                                                   factors common to all glaciers, rather than local effects such
          a plug-type flow from 1985 to 2011 in both its upper and
                                                                                                   as changes in individual glacier thicknesses, localized slope
          middle regions. Likewise, the upper portion and left side of
                                                                                                   gradients, or melt patterns. The RACMO2.3 simulation indi-
          Glacier 1 (∼0.5 km) maintain a flow structure more similar
                                                                                                   cates a sustained, long-term decrease in SMB (Fig. 7) over PIC
          to plug-type flow than deformation.
                                                                                                   since the mid-1980s, consistent with increases in summer
                                                                                                   and winter temperature anomalies reported in this region
                                                                                                   since 1985 (Zdanowicz and others, 2012; Vincent and
          4.3. Short-term variability of ice velocities                                            others, 2015) and with increased mass losses over PIC deter-
          To quantify the interannual variability of ice motion, we com-                           mined from NASA Airborne Topographic Mapper (ATM)
          pared annual in situ dGPS measurements collected within                                  altimetry elevation changes from 1995 to 2013 (Schaffer,
          500 m of the centre flow line on Glaciers 1 and 6 with the                               2017). The surface elevation changes from 2005 to 2013
          optical feature tracking results (Fig. 10) at the same distance                          resulted in an estimated mass loss rate of −5.4 ± 1.9 Gt a−1,
          from the terminus. To check if the dGPS velocities were com-                             four times greater than in the previous 5 years (1995–2000:
          parable with those along the centre line, we compared the                                −1.3 ± 0.72 Gt a−1; Gardner and others, 2012). Increased
          velocity at the location of each dGPS point to the nearest                               melt is also evidenced by a near doubling of the volume-
          location along the centre line using the speckle tracking                                tric fraction of infiltration ice layers in near-surface firn
          raster (Fig. 3). Velocities were found to be comparable (400 vertical meters below the present day ELA (Schaffer,
          dence intervals for interannual velocity variations calculated                           2017).

Downloaded from https://www.cambridge.org/core. 05 Feb 2022 at 04:57:28, subject to the Cambridge Core terms of use.
726 Schaffer and others: Ice velocity changes on Penny Ice Cap, Baffin Island, since the 1950s
Fig. 9. Cross-sectional surface ice velocities from feature tracking of optical image pairs for the upper, middle and lower ablation areas of
Glaciers 1, 8 and 6 on PIC (1985–2014). Distance was measured looking in an up-glacier direction, from left to right across each glacier.
The connection between ice motion variations and SMB (2011) and Schoof (2010). The lack of variability between
changes can be investigated by comparing the RACMO2.3 our winter and annual velocity measurements toward the
SMB model output to glacier velocities (Fig. 7). The initial end of our study period (2009–2014) also supports this con-
increase in velocities between 1985 and 1998 followed tention (Fig. 10).
several years of positive SMB from the late 1960s to late To assess the relative importance of internal deformation
1970s. This period of positive balance coincided with anom- at different periods, we used historical and current measure-
alously low regional temperatures in both summer and ments of ice thickness and surface slope at Highway Glacier
winter measured at weather stations close to PIC (Bradley, (Ward, 1955) to compute expected deformation rates using a
1973; Zdanowicz and others, 2012). After 1998, there was simplified form of Glen’s flow law (Glen, 1955):
a marked decrease in motion for all PIC glaciers, which
was accompanied by a 325% decrease in mass balance ε_ ¼ Aτng ð1Þ
from −0.28 m w.e. a−1 between 1985 and 1994 to −1.19
m w.e. a−1 between 2005 and 2014. These patterns where ε_ is the strain rate, τ is the basal shear stress, and A and
suggest that the outlet glaciers of PIC respond quickly to ng are empirically-derived values, the first varying with ice
increases in surface melt rates by decelerating, and acceler- temperature. The surface velocity due to creep (Ui) was cal-
ate in response to mass accumulation at times of positive culated by replacing τ with the equation for driving stress and
SMB. integrating with respect to height to obtain:
The transverse velocity profiles at PIC provide insights into
the relationships between mass loss and ice motion as they Ui ¼ 2Aðρi gH tan αÞng H ð2Þ
record a transition from plug-type flow associated with high
basal sliding rates, to motion increasingly influenced by where ρi is the density of ice, g is the gravitational constant, α
internal deformation as velocities decreased from 1985 to is the surface slope and H is the ice thickness. These cal-
2014 (Fig. 9). This suggests a shift from a distributed to a culations were made for 1953 and 2010 at two stakes
more efficient channelized subglacial hydrological system, closest to the glacier centreline (B and β in Fig. 8) using
and an overall drop in basal water pressure, as mass loss ρi = 910 kg m−3, α = 3.5° (measured in 1953) and ng = 3.3.
increases, supporting the findings of Sundal and others Measurements of summer ice temperatures near the surface
Downloaded from https://www.cambridge.org/core. 05 Feb 2022 at 04:57:28, subject to the Cambridge Core terms of use.Schaffer and others: Ice velocity changes on Penny Ice Cap, Baffin Island, since the 1950s 727
Fig. 10. Annual variability in surface ice velocities on PIC along glacier centre lines captured with optical imagery (coloured lines) and in situ
dGPS measurements (black triangles or squares) from 2008 to 2014, including 95% confidence interval error bars for: (a) Glacier 1 (land-
terminating); (b) Glacier 6 (tidewater-terminating). The 95% confidence intervals for dGPS points at ∼11 km and ∼23 km for Glacier 6 are728 Schaffer and others: Ice velocity changes on Penny Ice Cap, Baffin Island, since the 1950s
Fig. 11. Winter SAR-derived surface ice velocities (coloured lines) and annual in situ dGPS velocity measurements along the central flow line
of PIC outlet glaciers (Fig. 3) connecting the dGPS point locations on: (a) Glacier 1 (land-terminating); (b) Glacier 6 (tidewater-terminating).
2010/11 and 2011/12 SAR velocities were derived from ALOS PALSAR and RADARSAT-2 data, respectively.
surface meltwater on the GIS is thought to have been respon- Velocities on land-terminating outlet glaciers range from
sible for the observed slowdown, due to the expansion of a ∼100 to 250 m a−1 and generally decrease down-glacier.
channelized subglacial drainage system resulting in In contrast, tidewater glaciers showed a distinct increase in
increased drainage efficiency and lower basal water pres- velocities in their lower terminus region. The six outlet gla-
sures. As on PIC, thinning only accounted for a small per- ciers examined in detail as part of this study showed an
centage (17–33%) of the slowdown (Tedstone and others, overall deceleration between 1985 and 2014, with an early
2015). Likewise, Heid and Kääb (2012b) found that glacier- period of moderate speedup for most glaciers from 1985–
ized regions dominated by land-terminating glaciers with 87 to 1997/98, followed by a pronounced slowdown there-
negative mass balance experienced decreasing ice velocities after. The deceleration after 1998, as well as the long-term
over the past few decades, with reported decadal mean slowdown over the entire study period (1985–2014) for
decelerations of 43% in the Pamir (50 glaciers studied), 8% PIC, was beyond the estimated short-term ice motion vari-
in the Caucasus (16 glaciers) and 11% in the Alaska Range ability. Historical measurements on Highway Glacier show
(nine glaciers). The same is true for Glacier d’Argentière in that velocities there have decreased by 71% since 1953.
France (Vincent and others, 2009), Glacier Universidad We postulate that decreased ice motion on PIC is corre-
in the Andes (Wilson and others, 2016), Franz Josef Glacier lated with increased mass loss and with a transition from
in New Zealand (Anderson and others, 2014), White motion dominated by basal sliding to motion increasingly
Glacier on Axel Heiberg Island (Thomson and Copland, influenced by internal deformation. This is confirmed for
2017) and the lowermost 10 km of Kaskawulsh Glacier in Highway Glacier, where the estimated rate of internal
the Yukon (Waechter and others, 2015). deformation could only account for 30% of the surface vel-
ocity in 1953, but increased to 70% by 2010. Our findings
support the hypothesis of Schoof (2010) that increased
6. CONCLUSIONS surface melt enhances the formation of an efficient channe-
This study has confirmed that most of PIC is slow-moving lized subglacial drainage system, which results in lower
(Schaffer and others: Ice velocity changes on Penny Ice Cap, Baffin Island, since the 1950s 729
in response to a warming climate. The response of tidewater drainage system behavior and ice velocity. J. Geophys. Res.:
glaciers is more variable as they are controlled by marine Earth Surf., 117(F3), 1–17 (doi: 10.1029/2011JF002220)
influences and changes in backstress, in addition to Bradley RS (1973) Seasonal climatic fluctuations on Baffin Island
changes in ice thickness and subglacial hydrology. On PIC, during the period of instrumental records. Arctic, 26(3), 230–243
Burgess DO, Sharp MJ, Mair DWF, Dowdeswell JA and Benham TJ
tidewater glaciers are decelerating. However, this is not
(2005) Flow dynamics and iceberg calving rates of Devon Ice
true for all tidewater glaciers in the CAA. For example,
Cap, Nunavut, Canada. J. Glaciol., 51(173), 219–230 (doi:
Trinity and Wykeham Glaciers on Ellesmere Island have 10.3189/172756505781829430)
more than doubled in speed over the past 15 years (Van Burgess EW, Larsen CF and Forster RR (2013) Summer melt regulates
Wychen and others, 2016). Likewise in Greenland, wide- winter glacier flow speeds throughout Alaska. Geophys. Res.
spread acceleration of outlet glaciers occurred in the early- Lett., 40(23), 6160–6164 (doi: 10.1002/2013GL058228)
to mid-2000s (Luckman and others, 2006; Howat and Copland L, Sharp M and Dowdeswell A (2003a) The distribution
others, 2008). and flow characteristics of surge-type glaciers in the Canadian
Further work is needed to confirm the cause of deceler- high Arctic. Ann. Glaciol., 36(1), 73–81 (doi: 10.3189/
ation observed across PIC. Thickness change and ice tem- 172756403781816301)
perature measurements over the most dynamically active Copland L, Sharp MJ, Nienow P and Bingham RG (2003b) The distri-
bution of basal motion beneath a high Arctic polythermal glacier.
outlet glaciers (e.g. Glacier 1) are required to accurately
J. Glaciol., 49(166) (doi: 10.3189/172756503781830511)
determine the contribution of internal deformation vs basal Copland L and 8 others (2009) Glacier velocities across the
sliding to the observed changes in velocity. For tidewater gla- Karakoram. Ann. Glaciol., 50(52), 41–49 (doi: 10.3189/
ciers, measurements of sea surface temperatures and 172756409789624229)
bathymetry in Baffin Bay, as well as continued monitoring Fatland DR, Lingle CS and Truffer M (2003) A surface motion survey
of glacier motion and runoff, are required. of Black Rapids Glacier, Alaska, U.S.A. Ann. Glaciol., 36(1), 29–
36 (doi: 10.3189/172756403781816095)
Fitch AJ, Kadyrov A, Christmas WJ and Kittler J (2002) Orientation
correlation. In Proceedings of the British Machine Vision
ACKNOWLEDGEMENTS Conference 2002, 2–5 September 2002, Cardiff, UK, 133–142
We thank Geological Survey of Canada staff (Alexander (doi: 10.5244/C.16.11)
Chichagov and Mark Ednie), Parks Canada staff in Fitzpatrick AW and 8 others (2013) Ice flow dynamics and surface
Pangnirtung and Iqaluit, Alexandre Bevington, Patricia meltwater flux at a land-terminating sector of the Greenland ice
Payton and Charles Latour for their assistance with field sheet. J. Glaciol., 59(216), 687–696 (doi: 10.3189/2013JoG12J143)
Gardner A, Moholdt G, Arendt A and Wouters B (2012) Accelerated
work, Laurence Gray for providing the speckle tracking
contributions of Canada’s Baffin and Bylot Island glaciers to sea
code, Wesley Van Wychen for guidance using the code level rise over the past half century. Cryosphere, 6, 1103–1125
and the Department of Earth Sciences at Uppsala (doi: 10.5194/tc-6-1103-2012)
University for hosting N. Schaffer during part of this study. Gardner AS and 8 others (2011) Sharply increased mass loss from
We would also like to thank various data providers: Brice glaciers and ice caps in the Canadian Arctic Archipelago.
Noël at the Institute for Marine and Atmospheric Research Nature, 473(7347), 357–360 (doi: 10.1038/nature10089)
Utrecht (IMAU) for the RACMO2.3 model outputs, the US Glen JW (1955) The creep of polycrystalline ice. Proc. R. Soc.
Geological Survey for Landsat imagery and the National Lond., 228(1175), 519–538 (doi: 10.1098/rspa.1955.0066)
Science Foundation who funded the creation of the Gray AL, Short N, Mattar KE and Jezek KC (2001) Velocities and flux
ArcticDEM by DigitalGlobe Inc. (awards 1043681, of the Filchner Ice shelf and its tributaries determined from
speckle tracking interferometry. Can. J. Remote Sens., 27(3),
1559691 and 1542736). This work was supported by
193–206 (doi: 10.1080/07038992.2001.10854936)
funding from the Ontario Graduate Scholarship (OGS),
Harig C and Simons FJ (2016) Ice mass loss in Greenland, the Gulf of
Natural Sciences and Engineering Research Council of Alaska, and the Canadian Archipelago: seasonal cycles and
Canada (NSERC), Northern Scientific Training Program decadal trends. Geophys. Res. Lett., 43(7), 3150–3159 (doi:
(NSTP), Canada Foundation for Innovation (CFI), Ontario 10.1002/2016GL067759)
Research Fund, Polar Continental Shelf Program (PCSP) Heid T and Kääb A (2012a) Evaluation of existing image matching
and University of Ottawa. methods for deriving glacier surface displacements globally
from optical satellite imagery. Remote Sens. Environ., 118,
339–355 (doi: 10.1016/j.rse.2011.11.024)
Heid T and Kääb A (2012b) Repeat optical satellite images reveal
REFERENCES widespread and long term decrease in land-terminating glacier
Alley RB, Clark PU, Huybrechts P and Joughin I (2005) Ice-sheet and speeds. Cryosphere, 6, 467–478 (doi: 10.5194/tc-6-467-2012)
sea-level changes. Science, 310, 456–460 (doi: 10.1126/ Howat IM, Joughin I, Fahnestock M, Smith BE., and Scambos TA.
science.1114613) (2008) Synchronous retreat and acceleration of southeast
Anderson B and 6 others (2014) Annual to daily ice velocity and Greenland outlet glaciers 2000-06: Ice dynamics and coupling
water pressure variations on Ka Roimata o Hine Hukatere to climate. J. Glaciol., 54(187), 646–660 (doi: 10.3189/
(Franz Josef Glacier), New Zealand. Arct. Antarct. Alpine Res., 002214308786570908)
46(4), 919–932 (doi: 10.1657/1938-4246-46.4.919) Iken A (1981) The effect of the subglacial water pressure on the
Baird PD (1953) Baffin Island expedition, 1953: a preliminary field sliding velocity of a glacier in an idealized numerical model.
report. Arctic, 6, 227–251 (doi: 10.14430/arctic3878) J. Glaciol., 27(97), 407–421 (doi: 10.3198/1981JoG27-97-
Banwell A, Hewitt I, Willis I and Arnold N (2016) Moulin density 407-421)
controls drainage development beneath the Greenland Ice Luckman A, Murray T, de Lange R, and Hanna E (2006) Rapid
Sheet. J. Geophys. Res. Earth Surf., 121, 2248–2269 (doi: and synchronous ice-dynamic changes in East Greenland.
10.1002/2015JF003801) Geophys. Res. Lett., 33(3), 1–4 (doi: 10.1029/2005GL025428)
Bartholomew I and 5 others (2012) Short-term variability in Joughin I (2002) Ice-sheet velocity mapping: a combined interfero-
Greenland Ice Sheet motion forced by time-varying meltwater metric and speckle-tracking approach. Ann. Glaciol., 34(1),
drainage: implications for the relationship between subglacial 195–201 (doi: 10.3189/172756402781817978)
Downloaded from https://www.cambridge.org/core. 05 Feb 2022 at 04:57:28, subject to the Cambridge Core terms of use.730 Schaffer and others: Ice velocity changes on Penny Ice Cap, Baffin Island, since the 1950s
Kääb A and Vollmer M (2000) Surface geometry, thickness changes Tedstone AJ and 5 others (2015) Decadal slowdown of a land-ter-
and flow fields on creeping mountain permafrost: automatic minating sector of the Greenland Ice Sheet despite warming.
extraction by digital image analysis. Permafrost Periglac. Nature, 526, 692–695 (doi: 10.1038/nature15722)
Process., 11, 315–326 (doi: 10.1002/1099-1530(200012)) Thomson L and Copland L (2017) Multi-decadal reduction in glacier
Kamb B and 7 others (1985) Glacier surge mechanism: 1982–1983 velocities and mechanisms driving deceleration at polythermal
surge of variegated glacier, Alaska. Science, 227(4686), 469–479 White Glacier, Arctic Canada. J. Glaciol., 63(239), 450–463
(doi: 10.1126/science.227.4686.469) (doi: 10.1017/jog.2017.3)
Kick W (1962) Variations of some central Asiatic glaciers. IASH van de Wal RSW and 6 others (2008) Large and rapid melt-
Publ. (Symp. Obergurgl 1962 – Variations Regime Exist. induced velocity changes in the ablation zone of the
Glaciers), 58, 223–229 Greenland Ice Sheet. Science, 321(5885), 111–113 (doi:
Lee DS, Storey JC, Choate MJ and Hayes RW (2004) Four years of 10.1126/science.1158540)
Landsat-7 on-orbit geometric calibration and performance. IEEE Van Wychen W and 5 others (2012) Spatial and temporal variation
Trans. Geosci. Remote Sens., 42(12), 2786–2795 (doi: of ice motion and ice flux from Devon Ice Cap, Nunavut,
10.1109/TGRS.2004.836769) Canada. J. Glaciol., 58(210), 657–664 (doi: 10.3189/
Lenaerts JT and 5 others (2013) Irreversible mass loss of Canadian 2012JoG11J164)
Arctic Archipelago glaciers. Geophys. Res. Lett., 40(5), 870– Van Wychen W and 6 others (2014) Glacier velocities and dynamic
874 (doi: 10.1002/grl.50214) ice discharge from the Queen Elizabeth Islands, Nunavut,
Mair D and 5 others (2003) Hydrological controls on patterns of Canada. Geophys. Res. Lett., 41(2), 484–490 (doi: 10.1002//
surface, internal and basal motion during three spring events’’: 2013GL058558)
Haut Glacier d’Arolla, Switzerland. J. Glaciol., 49(167), 555– Van Wychen W, Copland L, Burgess D, Gray L and Schaffer N
567 (doi: 10.3189/172756503781830467) (2015) Glacier velocities and dynamic discharge from the Ice
Noël B and 5 others (2015) Evaluation of the updated regional masses of Baffin Island and Bylot Island, Nunavut, Canada.
climate model RACMO2.3: Summer snowfall impact on the Can. J. Earth Sci., 52(11), 980–989 (doi: 10.1139/cjes-2015-
Greenland Ice Sheet. Cryosphere, 9(5), 1831–1844 (doi: 0087)
10.5194/tc-9-1831-2015) Van Wychen W and 6 others (2016) Characterizing interannual vari-
Oerlemans J (2005) Extracting a climate signal from 169 glacier records. ability of glacier dynamics and dynamic discharge (1999−2015)
Science, 308(5722), 675–677 (doi: 10.1126/science.1107046) for the ice masses of Ellesmere and Axel Heiberg Islands,
Parizek BR and Alley RB (2004) Implications of increased Greenland Nunavut, Canada. J. Geophys. Res.: Earth Surf., 121(1), 1–25
surface melt under global-warming scenarios: ice-sheet simula- (doi: 10.1002/2015JF003708)
tions. Quat. Sci. Rev., 23(9–10), 1013–1027 (doi: 10.1016/j. Vincent C, Soruco A, Six D and Meur ELE (2009) Glacier thickening
quascirev.2003.12.024) and decay analysis from 50 years of glaciological observations per-
Pfeffer W and 76 others (2014) The Randolph Glacier Inventory: a formed on Glacier d’Argentière, Mont Blanc area, France. Ann.
globally complete inventory of glaciers. J. Glaciol., 60(221), Glaciol., 50(50), 73–79 (doi: 10.3189/172756409 787769500)
537–552 (doi: 10.3189/2014JoG13J176) Vincent LA and 7 others (2015) Observed trends in Canada’s climate
Schaffer N (2017) Dynamics and mass balance of Penny Ice Cap, and influence of Low-Frequency variability modes. J. Clim., 28,
Baffin Island, Nunavut, in a changing climate. (PhD thesis, 4545–4560 (doi: 10.1175/JCLI-D-14-00697.1)
University of Ottawa, Ottawa, Canada) Waechter A, Copland L and Herdes E (2015) Modern glacier veloci-
Schoof C (2010) Ice-sheet acceleration driven by melt supply vari- ties across the icefield ranges, St elias mountains, and variability
ability. Nature, 468, 803–806 (doi: 10.1038/nature09618) at selected glaciers from 1959 to 2012. J. Glaciol., 61(228), 624–
Shi L and 8 others (2010) Multichannel coherent radar depth 634 (doi: 10.3189/2015JoG14J147)
sounder for NASA operation ice bridge. In International Ward WH (1955) Studies in glacier physics on the Penny Ice Cap,
Geoscience and Remote Sensing Symposium (IGARSS), 1729– Baffin Island, 1953 part IV: the flow of highway glacier. J.
1732 (doi: 10.1109/IGARSS.2010.5649518) Glaciol., 2(18), 592–600
Short NH and Gray AL (2004) Potential for RADARSAT-2 interferom- Weber JR and Cooper RV (1993) Monitoring of elevation changes of
etry: glacier monitoring using speckle tracking. Can. J. Remote the Penny Ice Cap, Baffin Island. Geological Survey of Canada,
Sens., 30(3), 504–509 (doi: 10.5589/m03-071) Geophysics Division, Ottawa
Short NH and Gray AL (2005) Glacier dynamics in the Canadian Williamson S, Sharp M, Dowdeswell J and Benham T (2008) Iceberg
High Arctic from RADARSAT-1 speckle tracking. Can. J. calving rates from northern Ellesmere Island ice caps, Canadian
Remote Sens., 31(3), 225–239 Arctic, 1999–2003. J. Glaciol., 54(186), 391–400 (doi: 10.
Sole A and 6 others (2013) Winter motion mediates dynamic 3189/002214308785837048)
response of the Greenland Ice Sheet to warmer summers. Wilson R, Mernild SH, Malmros JK, Bravo C and Carrion D (2016)
Geophys. Res. Lett., 40(15), 3940–3944 (doi: 10.1002/grl.50764) Surface velocity fluctuations for Glaciar Universidad, central
Storey JC and Choate MJ (2004) Landsat-5 bumper-Mode geometric Chile, between 1967 and 2015. J. Glaciol., 62(235), 847–860
correction. IEEE Trans. Geosci. Remote Sens., 42(12), 2695–2703 (doi: 10.1017/jog.2016.73)
(doi: 10.1109/TGRS.2004.836390) Zdanowicz C and 6 others (2012) Summer melt rates on Penny Ice
Sundal AV and 5 others (2011) Melt-induced speed-up of Greenland Cap, Baffin Island: past and recent trends and implications for
ice sheet offset by efficient subglacial drainage. Nature, 469, regional climate. J. Geophys. Res., 117(F02006), 1–21 (doi:
521–524 (doi: 10.1038/nature09740) 10.1029/2011JF002248)
Tedstone AJ and 6 others (2013) Greenland ice sheet motion insensi- Zwally HJ and 5 others (2002) Surface melt-induced acceleration of
tive to exceptional meltwater forcing. Proc. Natl. Acad. Sci. Greenland ice-sheet flow. Science, 297(5579), 218–222 (doi:
U.S.A., 110(49), 19719–19724 (doi: 10.1073/pnas.1315843110) 10.1126/science.1072708)
MS received 31 August 2016 and accepted in revised form 27 June 2017; first published online 26 July 2017
Downloaded from https://www.cambridge.org/core. 05 Feb 2022 at 04:57:28, subject to the Cambridge Core terms of use.You can also read