Hydrological Summary for the United Kingdom - NERC Open Research Archive
←
→
Page content transcription
If your browser does not render page correctly, please read the page content below
Hydrological Summary
   for the United Kingdom
General
Overall December was typical, with a period of calm weather bookended by unsettled conditions, although unseasonably
warm temperatures (16.5°C was recorded on the 31st at Bala, Gwynedd) featured in the last week. Rainfall for the
UK was near-average, although this masked drier conditions in western Scotland and parts of northern and southern
England. Correspondingly, river flows were generally in the normal range although with some above normal flows in
Northern Ireland, central England, and East Anglia. Small soil moisture deficits remained in parts of eastern England,
and around the Thames estuary. However, recharge occurred at most groundwater index sites, except for a few in
the Chalk of southern England. By month-end most boreholes had levels within the normal range, with a few above
normal. Reservoir stocks rose at most impoundments in December and following a relatively average December, the
water resources situation remains healthy as winter progresses and latest outlooks suggest rainfall and river flows are

                                                                                                                       December 2021
likely to be normal over the coming months.

Rainfall
November’s unsettled weather continued into December          outflows for December were decidedly average, with
and dominated the first week, culminating in storm ‘Barra’.   monthly mean flows generally in the normal range.
Pressure fell rapidly on the 7th and frontal rain and high    However, notably high flows were recorded on the
winds approached from the west and on the 8th, 52mm was       Coquet, Weaver and Mersey (the latter registering its
recorded at Llysdinam (Powys). Efforts to reconnect the       third highest December monthly flows in a series since
remaining properties, which had lost power during storm       1976). Further south, isolated below-normal flows were
‘Arwen’ 11 days earlier, were hampered. Travel disruption,    recorded on the Coln and Tone – both registered two-thirds
fallen trees, further losses of power and coastal flooding    or less of their respective averages for December. Flow
were reported in Scotland, Northern Ireland and East Anglia   accumulations for November-December show a similar
but despite the unsettled conditions in the UK, this was a    picture, albeit with below normal flows in more catchments
much more extreme storm for Ireland, with Met Éireann         in southern England (e.g. Dart, Exe) but also in isolated
issuing a rare red warning for wind. Mid‑month brought        areas of central and northern England (e.g. Soar, Tees).
anti-cyclonic conditions, with dry weather and persistent     River flows for 2021 (January-December) were generally
cloud. From the 20th onwards, low pressure systems            above normal across England, notably so on the Coquet,
returned bringing frontal rainfall, wintry or heavy at        Weaver and Itchen, and exceptionally so on the Stringside
times. On the 26th, roads in Cumbria and North Yorkshire      which recorded 163% of average and its second highest
were shut due to snow, and in Consett (County Durham)         January-December flows after 2001 (in a series from 1965).
1,600 homes and businesses lost power. As well as heavy       Conversely in Northern Ireland, 2021 mean flows were
rain – 90mm was recorded at Capel Curig (Conwy) on            normal or below normal.
the 30th – the end of December featured unseasonable
mildness, with widespread overnight temperatures above        Groundwater and soil moisture
13°C. The UK as a whole received near-average December        Soil moisture responses in December were mixed, but
rainfall, although less than 70% of average was registered    there were some sharp increases at month-end in response
in north‑west Scotland (with less than 50% in the far         to rainfall in the last week e.g. at Redhill. Soils were
north) and north-west and southern England. In contrast,      normal to notably dry, with exceptionally low soil moisture
parts of Wales, central and north-east England registered     recorded at Hollin Hill, North Wyke and Harwood Forest.
more than 130% of average. Over the last two months           Groundwater levels generally rose in the Chalk, rising from
(November-December), rainfall for the UK was below            mid-month at West Woodyates Manor and Ashton Farm,
average (81%), with regions in southern England recording     but continued to recede at Westdean No.3 and in the slow
around half the average (e.g. Southern, Thames); it was       responding Chipstead, Stonor Park and Therfield Rectory.
the seventh driest November-December on record for            At month-end, levels were in the normal range, except
Wessex (in a series from 1910). Rainfall for 2021 overall     at Washpit Farm which remained above normal. Levels
(January-December) was just below average (96%) with          rose in the Jurassic limestones and remained in the normal
areas of western Scotland and Northern Ireland recording      range, and in the Magnesian limestones levels rose at
less than 90% of average.                                     Aycliffe and stabilised at Brick House Farm. Levels at
                                                              Alstonfield in the Carboniferous Limestone rose becoming
River flows                                                   notably high. In the Permo-Triassic sandstones, levels rose
Flows continued to increase and peaked above average          at Weir Farm (remaining notably high) and Bussels No.7a
during the first week of December in most catchments          (dropping into the normal range) but fell at Nuttalls Farm
in England and Northern Ireland, and the third highest        (remaining average for December). Levels fell overall
December peak flow was recorded on the Coquet on              at Lime Kiln Way (Upper Greensand) and rose at
the 4th (in a series from 1966). Following the passage of     Royalty Observatory (Fell Sandstone) with both notably
storm ‘Barra’ on the 8th, recessions commenced reaching       high for the time of year.
a minimum at most sites around mid-month. As the
weather became more unsettled closer to month‑end
responses occurred across the country with flows in many Note that due to issues with data access, no data are available
catchments ending the month above average. England for Scotland and Wales.
Rainfall . . . Rainfall . . .
Rainfall accumulations and return period estimates
Percentages are from the 1981-2010 average.
Dec
Region Rainfall Nov21 – Dec21 Oct21 – Dec21 Jul21 – Dec21 Jan21 – Dec21
2021
RP RP RP RP
United mm 115 190 353 569 1075
Kingdom % 98 81 2-5 98 2-5 93 2-5 96 2-5
England mm 89 128 252 436 853
% 103 74 5-10 96 2-5 94 2-5 101 2-5
Scotland mm 137 274 493 748 1350
% 87 86 2-5 101 2-5 91 2-5 89 2-5
Wales mm 184 253 462 734 1453
% 115 80 2-5 96 2-5 93 2-5 103 2-5
Northern mm 137 206 332 568 1048
Ireland % 120 91 2-5 96 2-5 92 2-5 92 2-5
England & mm 102 145 281 477 935
Wales % 106 75 2-5 96 2-5 94 2-5 102 2-5
North West mm 141 227 445 711 1319
% 107 88 2-5 113 2-5 104 2-5 108 2-5
Northumbria mm 93 161 283 456 900
% 108 92 2-5 108 2-5 96 2-5 103 2-5
Severn-Trent mm 91 122 221 395 781
% 118 81 2-5 96 2-5 94 2-5 100 2-5
Yorkshire mm 78 132 234 432 877
% 90 78 2-5 94 2-5 96 2-5 105 2-5
Anglian mm 65 93 164 292 603
% 121 82 2-5 93 2-5 86 2-5 97 2-5
Thames mm 66 82 193 362 721
% 95 57 8-12 87 2-5 93 2-5 101 2-5
Southern mm 84 98 239 412 799
% 96 55 8-12 87 2-5 93 2-5 100 2-5
Wessex mm 85 104 253 441 839
% 87 53 10-15 86 2-5 91 2-5 95 2-5
South West mm 139 192 390 646 1233
% 97 68 5-10 93 2-5 96 2-5 101 2-5
Welsh mm 172 237 442 707 1401
% 112 78 2-5 95 2-5 93 2-5 103 2-5
Highland mm 147 356 590 860 1514
% 76 92 2-5 101 2-5 89 2-5 84 2-5
North East mm 93 179 326 581 1017
% 101 89 2-5 102 2-5 104 2-5 100 2-5
Tay mm 123 203 383 654 1248
% 92 74 2-5 90 2-5 91 2-5 93 2-5
Forth mm 110 174 364 601 1129
% 92 73 2-5 98 2-5 92 2-5 94 2-5
Tweed mm 103 169 358 551 1067
% 99 82 2-5 113 5-10 98 2-5 104 2-5
Solway mm 155 248 536 779 1425
% 97 78 2-5 110 5-10 94 2-5 96 2-5
Clyde mm 171 307 570 830 1535
% 90 81 2-5 97 2-5 83 2-5 85 2-5
% = percentage of 1981-2010 average RP = Return period
Important note: Figures in the above table may be quoted provided their source is acknowledged (see page 12). Where appropriate, specific mention
must be made of the uncertainties associated with the return period estimates. The RP estimates are based on data provided by the Met Office and reflect
climatic variability since 1910; they also assume a stable climate. The quoted RPs relate to the specific timespans only; for the same timespans, but
beginning in any month the RPs would be substantially shorter. The timespans featured do not purport to represent the critical periods for any particular
water resource management zone. For hydrological or water resources assessments of drought severity, river flows and/or groundwater levels normally
provide a better guide than return periods based on regional rainfall totals. Note that precipitation totals in winter months may be underestimated due to
snowfall undercatch. All monthly rainfall totals since January 2018 are provisional.
2Rainfall . . . Rainfall . . .
December 2021 rainfall November 2021 - December 2021 rainfall
as % of 1981-2010 average as % of 1981-2010 average
170 170
150 150
130 130
% of average
% of average
110 110
90 90
70 70
50 50
30 30
December mean river flows for the Mersey
40
The Hydrological Outlook provides an insight into future
30 hydrological conditions across the UK. Specifically it
Flow (m3s-1)
describes likely trajectories for river flows and groundwater
levels on a monthly basis, with particular focus on the next
20 three months.
The complete version of the Hydrological Outlook UK can
10 be found at: www.hydoutuk.net/latest-outlook/
Period: from January 2022
0 Issued: 11.01.2022
1980s 1990s 2000s 2010s using data to the end of December 2021
Yearly mean river flows for the Stringside
1 River flows in January, and the three month period to
March, are likely to be in the normal range throughout the
UK, with some possible exceptions. Groundwater levels
are likely to be normal to above normal during January,
and this will continue to be the case in most areas over the
Flow (m3s-1)
period to the end of March, although with some fall in level
0.5 in the Chalk of north London perhaps to below normal.
* For a grass cover
0
1970s 1980s 1990s 2000s 2010s
3River flow . . . River flow . . .
January 2021 -
December 2021
130 Coquet
87
Mourne Eden
Bush
95 110 97 Tyne
104 Tees
Derwent
106
95
Annacloy Leven 112
Lune 103 123
Ribble 113 Derwent
Aire 114
Mersey
Don 116
125 132 Lud
Derwent
149 110
127 Wensum
113
Weaver 119 Witham 152
Trent
Dove
Soar 87 Stringside 163
107 Severn 115
Waveney
118 Avon
Coln 128
119 Colne
Thames
116 126
Avon Great
Brue 126 128
105 Blackwater Stour
Taw
95 Medway
105 99 124 Itchen 106
100 Tone 104
Warleggan Ouse
Stour
106 110 117 Exe
Kenwyn
114 Dart
Tamar
© UKCEH (2022) © Crown copyright.
170 Coquet
126
Mourne Eden
Bush
121 85 104 Tyne
December 2021
67 Tees
Derwent
79
124
Leven 86
Annacloy Key
Lune 102 111
% of long−term average
Derwent 25
Ribble 119
Mersey
Aire 102 (record high/low when circled)
Don 113
164
Derwent 97 Lud Exceptionally high flow
117
173
98 Wensum Notably high flow
119
Weaver 147 Witham 145
Dove
Trent Above normal
Soar 64 Stringside 161
122 Severn 83 Normal range
Waveney
84 Great
113 Avon Ouse Below normal
Coln 139
58
Thames
107 Lee Colne Notably low flow
Avon
89 75
Great Exceptionally low flow
Brue 105 116
72 Blackwater Stour
Taw
99 66
83
102 Itchen 93
Medway Based on ranking of the monthly flow*
91 Tone 67
Warleggan Ouse
87 Exe Stour
96 82
Kenwyn
78 Dart
Tamar
© UKCEH (2022). © Crown copyright.
River flows
*Comparisons based on percentage flows alone can be misleading. A given percentage flow can represent extreme drought
conditions in permeable catchments where flow patterns are relatively stable but be well within the normal range in
impermeable catchments where the natural variation in flows is much greater. Note: the averaging period on which these
percentages are based is 1981-2010. Percentages may be omitted where flows are under review.
Note that due to issues with data access, no data are available for Scotland and Wales.
4River flow . . . River flow . . .
River flow hydrographs
*The river flow hydrographs show the daily mean flows (measured in m3s-1) together with the maximum and minimum daily
flows prior to January 2020 (shown by the shaded areas). Daily flows falling outside the maximum/minimum range are
indicated where the bold trace enters the shaded areas. The dashed line represents the period-of-record average daily flow.
5River flow . . . River flow . . .
6Groundwater . . . Groundwater
Groundwater levels (measured in metres above ordnance datum) normally rise and fall with the seasons, reaching a
peak in the spring following replenishment through the winter (when evaporation losses are low and soil moist). They
decline through the summer and early autumn. This seasonal variation is much reduced when the aquifer is confined
below overlying impermeable strata. The monthly mean and the highest and lowest levels recorded for each month are
calculated with data from the start of the record to the end of 2017. Note that most groundwater levels are not measured
continuously and, for some index wells, the greater frequency of contemporary measurements may, in itself, contribute
to an increased range of variation.
7Groundwater . . . Groundwater
Alstonfield
8Groundwater . . . Groundwater
Key
Monthly rank/Period of record
1/25
(record high/low when circled)
Exceptionally high levels
Notably high levels
Above normal
Normal range
Below normal
Notably low levels
Exceptionally low levels
Aquifer
Chalk
Feddan Junction
Jurassic limestone
Permo Triassic sandstones
Magnesian limestone
Devonian/Carboniferous
Easter Lathrisk
limestone/sandstone
Royalty
28/32
Observatory
Newbridge Annan
Killyglen 22/37 Skirwith
Aycliffe
27/44
Wetwang
34/51
Brick
Dalton
House 36/42 54/133
Holme
Farm
24/43 Aylesby
Alstonfield
New Red Washpit
Llanfair 42/48 Lion
Weir Farm Farm
D.C.
29/58
34/39 55/70
Nuttalls Frying Pan
30/48 30/51
Farm Redlands Lodge
Hall Dial
22/54
25/58 Farm
Ampney
Greenfield Garage Crucis 75/134
Pant y Therfield
Lladron 42/64
Stonor Rectory
26/61
30/90
Park
Rockley
West 55/80 Chipstead Little
19/53 Tilshead 29/50
Woodyates Bucket
Manor 22/77 19/45
Houndean Farm
64/127 94/186
Bussels 48/53
34/51 23/80 Westdean No.3
No.7a 17/47 Chilgrove
Lime
Ashton Compton House
Kiln
Farm House
Way
© BGS NERC 2022
Groundwater levels - December 2021
The calculation of ranking has been modified from that used in summaries published prior to October 2012. It is now
based on a comparison between the most recent level and levels for the same date during previous years of record. Where
appropriate, levels for earlier years may have been interpolated. The rankings are designed as a qualitative indicator, and
ranks at extreme levels, and when levels are changing rapidly, need to be interpreted with caution.
Note that due to issues with data access, no data are available for Scotland and Wales.
9Reservoirs . . . Reservoirs . . .
Guide to the variation in overall Comparison between overall
reservoir stocks for England and reservoir stocks for England and
Wales* Wales in recent years*
*Note: Due to data access issues, the England and Wales stocks for December do not include the Northern Command Zone group or
Vyrnwy
Percentage live capacity of selected reservoirs at end of month
Capacity 2021 2021 2021 Dec Min Year* 2020 Diff
Area Reservoir (Ml) Oct Nov Dec Anom. Dec of min Dec 21-20
Northumbrian Teesdale • 87936 69 75 83 -8 41 1995 94 -12
Kielder (199175) 81 85 87 -4 70 1989 89 -2
Severn-Trent Clywedog 49936 88 88 89 4 54 1995 89 0
Derwent Valley • 46692 51 63 99 9 10 1995 100 -1
Yorkshire Washburn • 23373 73 76 88 1 23 1995 98 -10
Bradford Supply • 40942 66 68 87 -4 22 1995 100 -13
Anglian Grafham (55490) 94 94 90 6 57 1997 87 3
Rutland (116580) 80 76 77 -6 60 1990 87 -10
Thames London • 202828 82 82 85 -2 60 1990 86 -1
Farmoor • 13822 90 93 91 1 71 1990 78 13
Southern Bewl 31000 74 72 76 4 34 2005 74 2
Ardingly 4685 96 100 100 15 30 2011 87 13
Wessex Clatworthy 5662 78 85 91 0 54 2003 100 -9
Bristol • (38666) 67 72 75 -5 40 1990 100 -25
South West Colliford 28540 64 65 72 -7 46 1995 80 -8
Roadford 34500 87 89 96 18 20 1989 90 7
Wimbleball 21320 74 76 86 3 46 1995 100 -14
Stithians 4967 56 62 71 -10 33 2001 100 -29
Welsh Celyn & Brenig • 131155 80 85 98 5 54 1995 95 3
Brianne 62140 100 97 99 1 76 1995 98 1
Big Five • 69762 78 80 90 0 67 1995 94 -4
Elan Valley • 99106 80 81 100 3 56 1995 100 0
Scotland(E) Edinburgh/Mid-Lothian • 97223 85 88 89 -2 60 1998 98 -9
East Lothian • 9317 100 100 100 4 48 1989 100 0
Scotland(W) Loch Katrine • 110326 71 92 96 4 75 2007 100 -4
Daer 22494 100 100 100 2 83 1995 98 2
Loch Thom 10721 75 83 100 3 80 2007 92 8
Northern Total+ • 56800 75 74 89 -1 61 2001 100 -11
Ireland Silent Valley • 20634 68 65 89 3 39 2001 99 -10
( ) figures in parentheses relate to gross storage • denotes reservoir groups *last occurrence
+
excludes Lough Neagh
Details of the individual reservoirs in each of the groupings listed above are available on request. The percentages given in the Average and Minimum
storage columns relate to the 1988-2012 period except for West of Scotland and Northern Ireland where data commence in the mid-1990s. In some
gravity-fed reservoirs (e.g. Clywedog) stocks are kept below capacity during the winter to provide scope for flood attenuation purposes. Monthly figures
may be artificially low due to routine maintenance or turbidity effects in feeder rivers. © UKCEH (2022).
10Soil Moisture . . . Soil Moisture
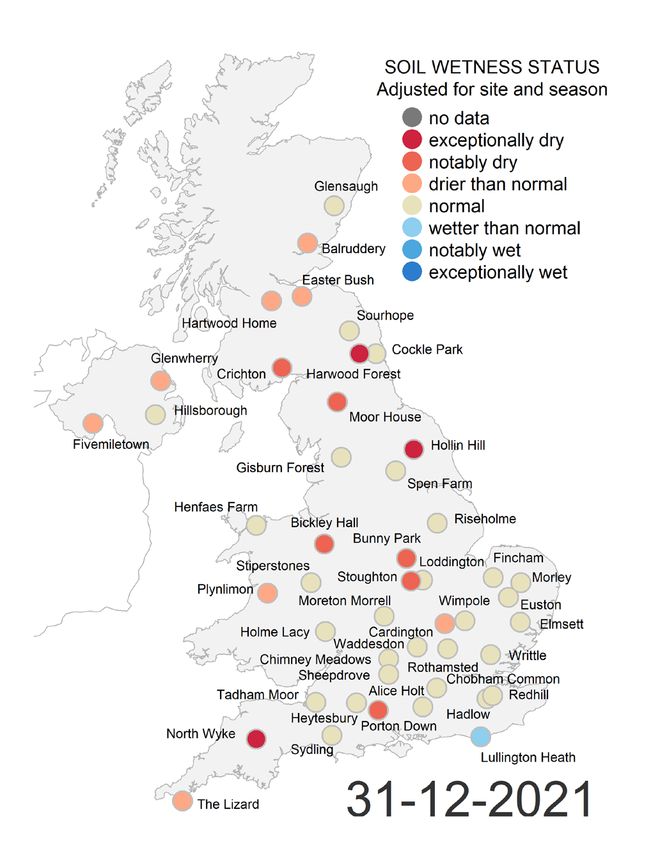
December 2021
In December soil moisture is expected to be close to, or
above, field capacity. At sites that have had recent rainfall
soil moisture was in fact above field capacity, whereas
at sites that have had little recent rainfall, and a spell of
uncharacteristically warm weather at the end of the month,
soil moisture was slightly below field capacity. The map
above shows this, and also that there was no clear regional
pattern to soil wetness.
These conditions were in some cases drier, or perhaps more
correctly not as wet, as normal since in some winters heavy
rainfall will cause soils to become saturated. Crichton and
North Wyke are examples of where soils were drier than
expected for the time of year.
Elsewhere, soils hovered around normal soil wetness
with short-term increases to above normal conditions in
response to rainfall events, as seen at Redhill and Spen
Farm.
Some sites have seen soil moisture track in the normal
range for several months (e.g. Morley).
Soil moisture data
These data are from UKCEH’s COSMOS-UK network. The time series graphs show volumetric water content as a
percentage in black together with the maximum and minimum daily values for the period-of-record of the sites. The
dashed line represents the period-of-record mean VWC. For more information visit cosmos.ceh.ac.uk.
11NHMP
The National Hydrological Monitoring Programme Water; supplementary rain gauges are operated by the Met
(NHMP) was started in 1988 and is undertaken jointly by Office. The Met Office NCIC monthly rainfall series extend
the UK Centre for Ecology & Hydrology (UKCEH) and back to 1910 and form the official source of UK areal rainfall
the British Geological Survey (BGS). The NHMP aims to statistics which have been adopted by the NHMP. The
provide an authoritative voice on hydrological conditions gridding technique used is described in Perry MC and Hollis
throughout the UK, to place them in a historical context and, DM (2005) available at https://doi.org/10.1002/joc.1161
over time, identify and interpret any emerging hydrological
trends. Hydrological analysis and interpretation within the Long-term averages are based on the period 1981-2010 and
Programme is based on the data holdings of the National are derived from the monthly areal series.
River Flow Archive (NRFA; maintained by UKCEH) and
National Groundwater Level Archive (NGLA; maintained The regional figures for the current month in the hydrological
by BGS), including rainfall, river flows, borehole levels, summaries are based on a limited rain gauge network so
and reservoir stocks. these (and the associated return periods) should be regarded
as a guide only.
The Hydrological Summary is supported by the
Natural Environment Research Council award number The monthly rainfall figures are provided by the Met Office
NE/R016429/1 as part of the UK-SCAPE programme NCIC and are Crown Copyright and may not be passed on
delivering National Capability. to, or published by, any unauthorised person or organisation.
For further details on rainfall or MORECS data, please
Data Sources contact the Met Office:
Tel: 0870 900 0100
The NHMP depends on the active cooperation of many data
Email: enquiries@metoffice.gov.uk
suppliers. This cooperation is gratefully acknowledged.
River flow and groundwater level data are provided by
the Environment Agency (EA), Natural Resources Wales -
Cyfoeth Naturiol Cymru (NRW), the Scottish Environment Enquiries
Protection Agency (SEPA) and, for Northern Ireland, the
Department for Infrastructure - Rivers and the Northern Enquiries should be directed to the NHMP:
Ireland Environment Agency. In all cases the data are
subject to revision following validation (high flow and Tel: 01491 692599
low flow data in particular may be subject to significant Email: nhmp@ceh.ac.uk
revision).
A full catalogue of past Hydrological Summaries can be
Details of reservoir stocks are provided by the Water accessed and downloaded at:
Service Companies, the EA, Scottish Water and Northern
Ireland Water. http://nrfa.ceh.ac.uk/monthly-hydrological-summary-uk
The Hydrological Summary and other NHMP outputs Some of the features displayed on the maps contained in
may also refer to and/or map soil moisture data for the this report are based on the following data with permission
UK. These data are provided by the Meteorological Office of the controller of HMSO.
Rainfall and Evaporation Calculation System (MORECS).
MORECS provides estimates of monthly soil moisture i. Ordnance Survey data. © Crown copyright and/or
deficit in the form of averages over 40 x 40 km grid squares database right 2005. Licence no. 100017897.
over Great Britain and Northern Ireland. The monthly time ii. Land and Property Services data. © Crown copyright
series of data extends back to 1961. and database right, S&LA 145.
iii. Met Office rainfall data. © Crown copyright.
Rainfall data are provided by the Met Office. To allow
better spatial differentiation the rainfall data for Britain All rights reserved. Unauthorised reproduction infringes
are presented for the regional divisions of the precursor crown copyright and may lead to prosecution or civil
organisations of the EA, NRW and SEPA. The areal proceedings.
rainfall figures have been produced by the Met Office
National Climate Information Centre (NCIC), and are Text and maps in this document are © UKCEH (2022)
based on 5km resolution gridded data from rain gauges. unless otherwise stated and may not be reproduced without
The majority of the full rain gauge network across the UK permission.
is operated by the EA, NRW, SEPA and Northern Ireland
01/2022
12You can also read