HURRICANE REPORT 2021 - CONTRIBUTORS - CORELOGIC
←
→
Page content transcription
If your browser does not render page correctly, please read the page content below
2021
Hurricane Report
    Contributors
    Tom Larsen, Dr. Thomas Jeffery, Rhea Turakhia, Denise Moore, Molly Boesel,
    Elizabeth Greeves, Maiclaire Bolton Smith and Jose Acosta

©2021 CoreLogic, Inc. All Rights Reserved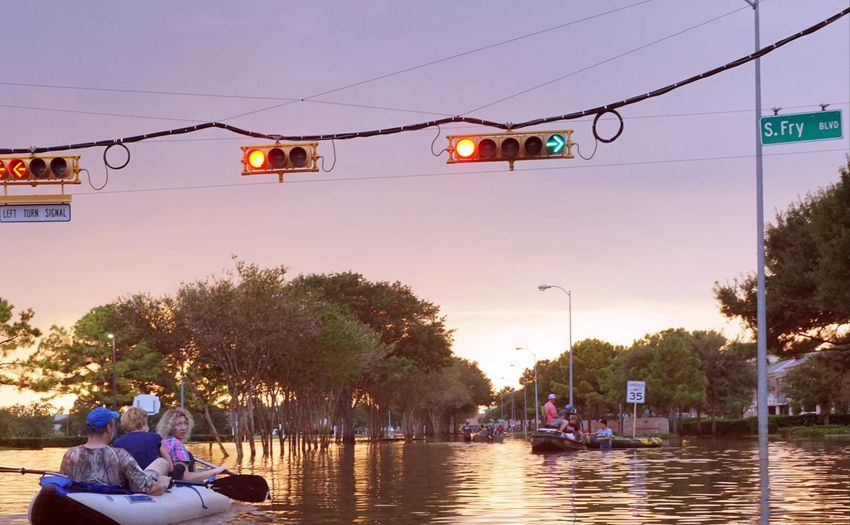
Table of Contents

        04      Introduction

        05      The Human Impact of Hurricanes

        07      Hurricanes and Climate Change

        09      National Analysis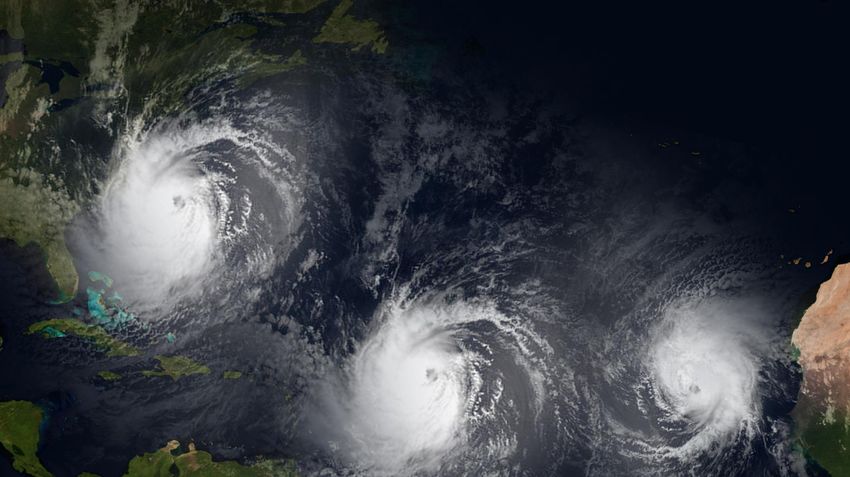
Table of Contents

        11      Metro Analysis

        16      The CoreLogic Mission: Loss Prevention

        17      Methodology
Introduction   As the 2021 Atlantic hurricane season rolls in, the National Oceanic and
                   Atmospheric Administration (NOAA) has projected a total of 13-20
                                                                                              The Southwest Louisiana community was devastated. Homes were
                                                                                              reduced to slabs. Roofs were missing. And the heat that set in shortly
                   named storms, 6-10 hurricanes and 3-5 major hurricanes, defined as         after the storm dissipated meant many homes, rife with water damage,
                   Category 3 and higher. In 2020, the United States was the ultimate         grew mold. This crisis highlighted an important distinction: while
                   destination for a record high of 30 named storms over the course of the    hurricanes are devastating for any community, the effects of disasters
                   hurricane season, which battered the Gulf and Atlantic Coasts. Three of    can be exponentially worse for lower-income areas. In understanding
                   these storms hit the Louisiana coast back-to-back and hurricanes Laura     hurricane risk exposure, both today and in the future, financial
                   and Delta made landfall just 15 miles apart in less than six weeks.        devastation for insurers, homeowners and communities can be
                                                                                              prevented.

4
The Human Impact of                                                                       WHAT HAPPENS TO THE REAL ESTATE ECONOMY AFTER A HURRICANE HITS?

    Hurricanes
                                                                                              Mortgage Delinquency Rates

                                                                                                                           6.2% mortgage delinquency rate in August 2017 to 10.9%
                                                                                              Harvey in Houston, TX
    The most economically disadvantaged, or those who earn less than half of what their                                    mortgage delinquency rate by October, an increase of
                                                                                              (August 25, 2017)
    neighbors do, often struggle to afford a home in the first place. Home ownership is a                                  4.7 percentage points.
    principal form of saving and building wealth, and thus a key to economic mobility.
    When lower income communities are hit with disaster, it can be even more challenging                                   3.3% overall (30+ day) mortgage delinquency rate in
    to recover.                                                                               Florence in Wilmington, NC   August 2018 to 6.2% overall delinquency rate in October
                                                                                              (September 14, 2018)         2018, an increase of 3.0 percentage points after Florence
    Many lower-income communities may not have the ability to afford insurance, or know                                    made landfall.
    their house is at risk of hurricane damage. When homes are destroyed, many uninsured
    homeowners are left with few options. Damaged homes, often unsuitable for                                              3.9% overall (30+ day) mortgage delinquency rate in
                                                                                              Michael in Panama City, FL
    habitation, mean that people are displaced, living in motel rooms and elsewhere and                                    September 2018 to 11.3% overall delinquency rate in
                                                                                              (October 10, 2018)
                                                                                                                           November 2018, an increase of 7.3 percentage points.
    spending money on new, added expenses. Their place of work may be damaged,
    locking them out of earning income.
                                                                                              Housing Inventory
    In Lake Charles, which was hit by both Hurricane Laura and Hurricane Delta, the
    average cost to replace a roof was $7,684. Based on the area’s median household
    income, assuming no financial assistance, no insurance, no savings and a 40-hour work     Harvey in Houston, TX        -23% change in housing inventory 5 months following
                                                                                              (August 25, 2017)            the disaster.
    week, it would take over two months of labor to accumulate the necessary money to
    replace the roof — assuming they have no other expenses such as childcare, rent,
    groceries and gas.                                                                        Florence in Wilmington, NC   -26% change in housing inventory 4 months following
                                                                                              (September 14, 2018)         the disaster.
    For those who are homeowners, the result of a financial catastrophe results in
    mortgage delinquency rates increasing significantly as people, crippled by expenses
    and lost wages, fail to make monthly mortgage payments. After Hurricane Laura made        Michael in Panama City, FL   -13% change in housing inventory 2 months following
    landfall in Lake Charles, the already-high delinquency rate shot up from 9.8% in August   (October 10, 2018)           the disaster.
5   2020 to 16.1% in September 2020, an increase of 6.3 percentage points.
As climate change continues to reshape the way storms behave, the risk in
    these hurricane-prone areas will continue to increase. Based on data from
    NOAA National Centers for Environmental Information, over the past four
    decades we've seen a 70-90% increase every decade in total inflation-adjusted
    losses from weather events in the United States — and this trend isn’t slowing
    down. Many of the increases are driven by population migrations from
    expensive metropolitan areas to high-risk, more affordable coastal areas. These
    areas are typically low-lying, hurricane prone and especially subject to the
    climate-related factors at play including, sea level rise, extreme rainfall events
    and possible increases in hurricane intensity.

    The resilience of these coastal communities — high income or low — continues
    to be a focal point of prevention and preparation. The only way forward is to
    understand what really is at risk, and educate, prepare and collaborate with
    everyone who has a stake in the ongoing crisis, including insurance companies,
    lenders, government agencies and the families on the front line.

    The 2021 Hurricane Report provides insight into property risk, both nationally
    and by metro area, across single-family homes and multifamily homes from
    hurricane-driven wind and storm surge. With this knowledge in hand, we can all
    better protect the homes, families and businesses we love.

6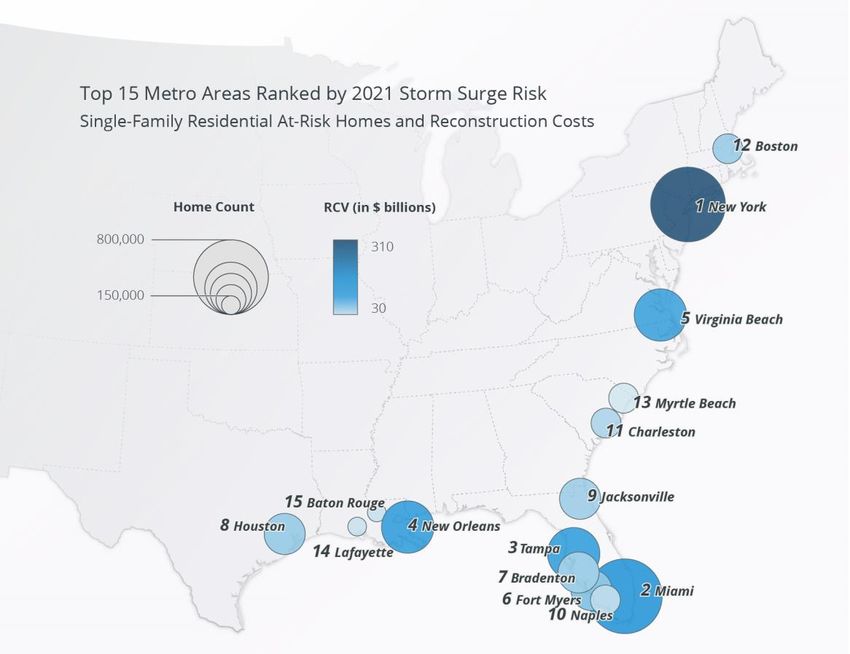
Hurricanes & Climate Change

    A tropical cyclone is a rotating low-pressure weather system. When a storm's maximum                A Closer Look
    sustained winds reach 74 mph, it is called a hurricane and they are rated on the Saffir-Simpson
                                                                                                        The Saffir-Simpson Scale
    Hurricane Wind Scale with a 1 to 5 rating, based on a hurricane's maximum sustained winds.

                                       Category                                 Category                 Category                  Category                  Category

                                       1                                        2                        3                         4                         5
                                       Winds | 74-95 mph                        Winds | 96-110 mph       Winds | 111-130 mph       Winds | 131-155 mph       Winds | > 156 mph
                                       Storm Surge | 4-5 ft.                    Storm Surge | 6-8 ft.    Storm Surge | 9-12 ft.    Storm Surge | 13-18 ft.   Storm Surge | > 18 ft.

    The National Hurricane Center has recorded 309 landfalling hurricanes in the U.S. since 1851,
    or an average of about 18 hurricanes per decade. The long-term average occurrence of
    hurricane landfalls in the U.S. is a little less than two per year. But each year varies. For
    example, there were no hurricane landfalls in the U.S. in 2015, but seven hurricanes made
7
    landfall in 1980.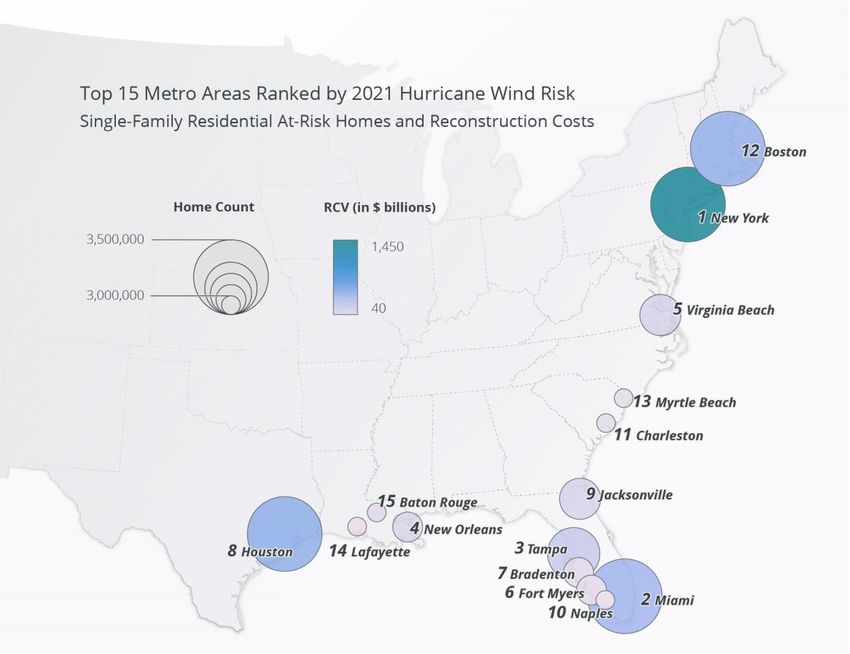
Major hurricanes (Category 3 or greater) are responsible for the majority of onshore damage      The key aspects of change in hurricane risk come from: sea-level rise, increased tropical
    and arrive at a rate of less than one per year. A look at common major hurricane property        cyclone rainfall rates, increasing tropical cyclone frequency rates and an expectation that
    damages:                                                                                         “the global proportion of tropical cyclones that reach very intense (Categories 4 and 5) levels
                                                                                                     will likely increase due to anthropogenic warming over the 21st century.” (2) Sea-level rise
                                                                                                     and tropical cyclone precipitation escalate the flood risk (coastal and inland) component of
           Elevated waves and coastal surge flood and tear apart properties on the coast.
                                                                                                     the damage from hurricanes and the intensification of hurricanes presents greater risk to

           Inland precipitation and wind forces water upstream, bringing flooding inland,            structures exposed to these winds.
           damaging interior walls, flooring and contents of homes.
                                                                                                     As hurricanes grow stronger, property losses will continue to mount and the insurance
                                                                                                     industry will see increased financial implications as wind damages are covered by standard
           Devastating winds and wind-borne debris causes significant damage to property roofs,
                                                                                                     homeowners insurance policies. Hurricane Andrew (1991) was a powerful Category 5 storm
           windows and other exterior structures.
                                                                                                     that impacted Miami, Florida. Despite very high storm surge levels, the bulk of the more
                                                                                                     than $20 billion in damages from that event were caused by devastating winds. Similarly,
                                                                                                     Hurricane Ike (2008) was a strong hurricane that impacted Houston, Texas and the damage
    The damage from extreme events like Hurricane Katrina (2005) and Hurricane Harvey (2017)
                                                                                                     was primarily caused by winds.
    can exceed $100 billion, not to mention at least 1,833 lives lost during Katrina and 68 during
    Harvey. Coastal concentrations of population and property in South Florida and Houston,          While flood insurance adoption inside the Special Flood Hazard Areas designated by FEMA is
    Texas are always a concern, but devastating hurricanes can impact the U.S. states along the      strong, it’s rarely purchased outside of those zones. This means many unsuspecting
    Gulf of Mexico and the Atlantic Ocean seaboard.                                                  homeowners could be left with little-to-no protection in recovery from intensifying
                                                                                                     hurricane seasons. Hurricanes Katrina and Harvey caused tens of billions in flood and water
    Climate change is affecting the characteristics of hurricanes in the basins that impact the      damages alone.
    U.S.

           The 2017, 4th (U.S.) National Climate Assessment notes, “neither global
                                                                                                     (1) https://nca2018.globalchange.gov/chapter/1/
           efforts to mitigate the causes of climate change nor regional efforts to
           adapt to the impacts currently approach the scales needed to avoid                        (2) https://www.gfdl.noaa.gov/global-warming-and-hurricanes/

           substantial damages to the U.S. economy, environment, and human
           health and well-being over the coming decades”.(1)

8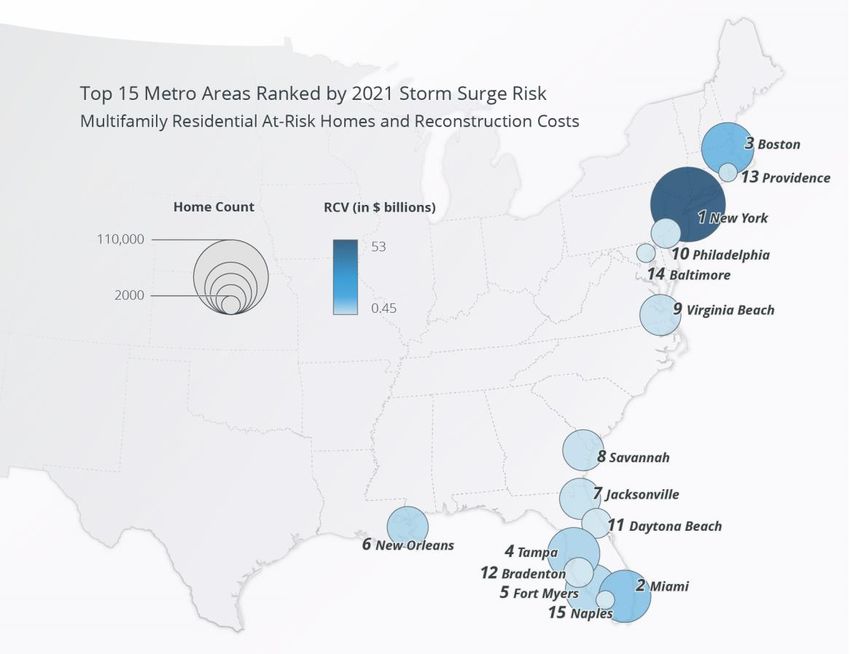
National Analysis
                                              CoreLogic evaluated the storm surge and hurricane wind risk levels for both single-
    Nearly 8M Homes at Risk of Hurricane      family (SFR) and multifamily (MFR) residences along the Gulf and Atlantic coasts for

    Storm Surge, Over 31M Homes at Moderate   the 2021 hurricane season.

    or Greater Risk of Hurricane Winds        CoreLogic identified more than 31 million single-family homes (and almost 1 million
                                              more homes in multi-unit buildings) that were at moderate or greater risk from the
                                              damaging winds of a hurricane. Almost 8 million of these homes had direct or
                                              indirect coastal exposure and subsequent risk from coastal storm surge and
                                              damage from hurricanes. For any one community, hurricane losses are severe and
                                              infrequent, and homeowners primarily rely on the availability of insurance proceeds
                                              to restore homes and support community resilience goals. Damage from hurricane
                                              winds is generally insured for most homes, but flood insurance is not uniformly
                                              purchased by homeowners. Studies by CoreLogic have shown that up to 70% of the
                                              damages from flood to homes is uninsured.

                                              The tables below represent the number of homes at varying levels of surge risk
                                              based on hurricane categories and the number of homes at varying levels of
                                              hurricane wind risk based on wind risk levels. It is an analysis of which homes could
                                              be affected by varying category storms that could occur this year or in coming years.
                                              The reconstruction cost value (RCV) figures are based on an assumption of total
                                              (100%) destruction of the structure, or the cost to completely rebuild the existing
                                              structure assuming total destruction. The RCV combines materials, equipment and
                                              labor, but does not include the value of the land or lot.

9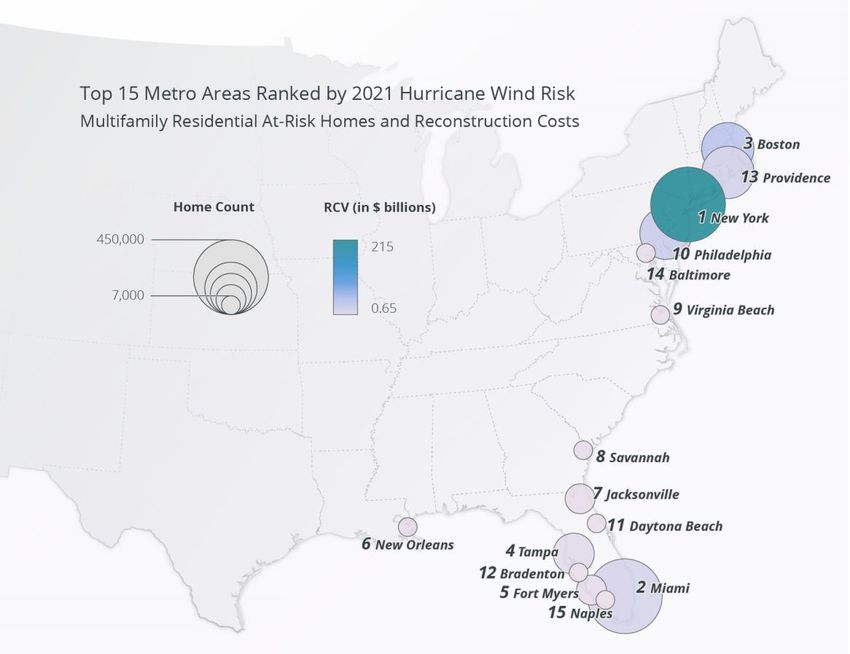
2021 STORM SURGE RISK NUMBERS FOR THE GULF AND ATLANTIC COASTS                                                2021 WIND RISK NUMBERS FOR THE GULF AND ATLANTIC COASTS

       Storm Surge Risk      Total Homes            Total Estimated        Total Homes           Total Estimated                                                                                                 Total
                                                                                                                                             Total Homes            Total                 Total Homes
       Level (Storm          (SFR) Potentially      RCV (U.S. Dollars      (MFR) Potentially     RCV (U.S. Dollars     Hurricane                                                                                 Estimated RCV
                                                                                                                                             (SFR)                  Estimated RCV         (MFR)
       Category)             Affected               in Billions)           Affected              in Billions)          Wind Risk                                                                                 (MFR) (U.S.
                                                                                                                                             Potentially            (U.S. Dollars in      Potentially
                                                                                                                       Level                                                                                     Dollars in
                                                                                                                                             Affected               Billions)             Affected
                                                                                                                                                                                                                 Billions)

        Category 1             1,309,160             $327.55                41,662                 $16.56

                                                                                                                       Extreme               6,197,146              $1,323.43             120,815                $33.60

        Category 2             2,754,989             $701.93                94,101                 $39.14

                                                                                                                       Very High or
                                                                                                                                             14,365,874             $3,219.63             226,310                $67.47
                                                                                                                       Greater
        Category 3             4,420,104             $1,104.02              150,212                $61.34

                                                                                                                       High or
                                                                                                                                             21,725,272             $5,406.02             619,567                $253.82
        Category 4             6,462,072             $1,611.27              221,920                $92.54              Greater

                                                                                                                       Moderate or
        Category 5             7,487,405             $1,829.84              246,136                $98.57                                    31,288,878             $8,081.11             953,257                $413.47
                                                                                                                       Greater

     Data is cumulative (e.g. Category 3 will also include Categories 1 and 2. All Category 5 potential homes        Data is cumulative (i.e. High or Greater will also include Very High or Greater and Extreme. Moderate or
     affected will also be susceptible to Category 1, so Category 5 encompasses all).                                Greater encompasses all).

     It should be noted that many multifamily residences tend to be multiple stories and upper stories are less
     affected by storm surge flooding. In addition to conventional homes, the single-family structures include
     mobile homes, duplexes, manufactured homes and cabins. The multifamily homes are apartments,
     condominiums and multi-unit dwellings.

10
Metro Analysis
The review of the risk counts by metro area tells the story of the varying risk profiles of the communities
where we live. Our review highlights over 3 million homes in the New York City metro area at risk of
damage from hurricane winds, and the almost 800 thousand homes (about quarter of the total) at risk of
storm surge flooding. In the Tampa Bay, Florida metro area, 1.1 million homes are at risk from hurricane
winds but almost half of them are also exposed to storm surge flooding. Increasing sea levels influenced
by climate change will bring a greater frequency and severity of storm surge flooding to exposed
communities. And those communities with a large number of homes at risk to surge will also be more
sensitive to the effects of climate change. Granular data and analytics can help us identify those homes
most at risk, enabling us the opportunity to fortify those homes.
SFR and MFR properties in the top 15 metropolitan areas account for 68.3% of the surge risk RCV
total in the U.S. in 2021.
Population densities in these metro areas affect risk assessment. A lower category hurricane in a densely-
populated metro area is likely to do much more damage than a higher category storm in a less-densely-
populated area. And even within a metro area, some homes will be at less risk due to changes in elevation
and barriers to the inland flow of water.
112021 STORM SURGE AND HURRICANE WIND RISK NUMBERS FOR SINGLE-FAMILY RESIDENTIAL FOR TOP 15 METRO AREAS
Rank Metropolitan Area Total (SFR) Homes at Risk of Total Estimated RCV for Storm Total (SFR) Homes at Risk of Total Estimated RCV for Hurricane Wind
Storm Surge Surge (U.S. Dollars in Billions) Hurricane Wind (U.S. Dollars in Billions)
1 New York City 781,823 $304.50 3,378,397 $1,430.10
2 Miami 738,994 $149.26 1,997,608 $406.28
3 Tampa, FL 544,433 $100.80 1,102,691 $218.14
4 New Orleans 396,870 $100.59 424,460 $107.52
5 Virginia Beach, VA 395,653 $94.95 578,622 $140.62
6 Fort Myers, FL 321,940 $67.02 348,965 $72.23
7 Bradenton, FL 284,828 $57.46 373,133 $79.19
8 Houston 261,103 $56.89 1,987,408 $494.62
9 Jacksonville, FL 220,301 $52.71 548,161 $123.33
10 Naples, FL 197,265 $44.46 201,314 $45.08
11 Charleston, SC 184,563 $46.82 275,321 $65.22
12 Boston 159,245 $53.98 1,289,430 $477.06
13 Myrtle Beach, SC 156,161 $30.43 247,907 $49.65
14 Lafayette, LA 146,254 $33.41 179,528 $40.05
15 Baton Rouge, LA 136,951 $34.27 299,849 $71.08
122021 STORM SURGE AND HURRICANE WIND RISK NUMBERS FOR SINGLE-FAMILY RESIDENTIAL FOR TOP 15 METRO AREAS 13
2021 STORM SURGE AND HURRICANE WIND RISK NUMBERS FOR MULTIFAMILY RESIDENTIAL FOR TOP 15 METRO AREAS

     Rank    Metropolitan Area      Total (MFR) Homes at Risk of   Total Estimated RCV for Storm      Total (MFR) Homes at Risk of   Total Estimated RCV for Hurricane Wind
                                    Storm Surge                    Surge (U.S. Dollars in Billions)   Hurricane Wind                 (U.S. Dollars in Billions)

     1       New York City          108,607                        $52.04                             448,051                        $213.78

     2       Miami                  28,747                         $7.04                              61,458                         $16.28

     3       Boston                 14,548                         $9.14                              58,943                         $37.73

     4       Tampa, FL              14,220                         $3.86                              26,239                         $6.85

     5       Fort Myers, FL         13,417                         $3.29                              14,248                         $3.49

     6       New Orleans            6,518                          $3.38                              6,518                          $3.38

     7       Jacksonville, FL       4,495                          $1.48                              8,643                          $2.75

     8       Savannah, GA           4,479                          $1.63                              4,511                          $1.64

     9       Virginia Beach, VA     4,244                          $1.42                              5,015                          $1.67

     10      Philadelphia           3,397                          $1.26                              53,927                         $25.02

     11      Daytona Beach, FL      3,289                          $0.85                              5,159                          $1.26

     12      Bradenton, FL          3,279                          $0.88                              3,739                          $1.00

     13      Providence, RI         2,544                          $1.48                              32,960                         $19.13

     14      Baltimore              2,221                          $0.45                              4,672                          $1.12

     15      Naples, FL             2,206                          $0.63                              2,350                          $0.66

14
2021 STORM SURGE AND HURRICANE WIND RISK NUMBERS FOR SINGLE-FAMILY RESIDENTIAL FOR TOP 15 METRO AREAS 15
The CoreLogic Mission:
     Loss Prevention

     While we can’t control the occurrence of natural disasters like hurricanes, we can prepare for
     them. Understanding the risk to help accelerate recovery is the key to resilience.

     For the entire housing ecosystem, the focus of concern is shifting from loss adjudication to loss
     prevention and avoidance. While climate change and increased customer expectations create
     an unpredictability in how insurers, lenders and the housing finance ecosystem can offer their
     products, those not being proactive in changing processes and technology can easily fall
     behind. However, by leveraging granular data, they can not only see through the lens of risk
     management and loss prevention, but also help customers improve their own experience.

     World-class software, data, science and AI are enabling insurers, lenders, and the housing
     finance ecosystem to define and transform their markets and successfully address the
     challenges of our changing climate and population demographics. To help mitigate the effects
     of hurricanes and other natural disasters, it is important to support community resilience goals
     and understand the risk faced by those impacted.

     As hurricanes wreak havoc on communities across the coast, it’s more important than ever to
     protect the homes, families and businesses we love.

16
Methodology The analysis in the 2021 Hurricane Report encompasses single-family residential structures
less than four stories, including mobile homes, duplexes, manufactured homes and cabins
(among other non-traditional home types). It also encompasses multifamily structures, which
include apartments, condominiums and multi unit dwellings.
It is important to note that the inclusion of high-rise residential units such as those listed
above may skew both the numbers associated with storm surge risk. This is because lower
level units are most likely to be affected, whereas the units above the second floor will rarely,
if ever, experience storm surge flood damage.
Year-over-year changes between the number of homes at risk and the RCV can be the result of
several variables, including new home construction, improved public records, enhanced
modeling techniques, fluctuation in labor, equipment and material costs and even a potential
rise in sea level. For that reason, direct year-over-year comparisons should be warily
considered. To estimate the value of property exposure of single-family residences, CoreLogic
uses its RCV methodology, which estimates the cost to rebuild the home in the event of a total
loss and is not to be confused with property market values or new construction cost
estimation. Reconstruction cost estimates more accurately reflect the actual cost of damage
or destruction of residential buildings that would occur from hurricane-driven storm surge
and wind, since they include the cost of materials, equipment and labor needed to rebuild.
These estimates also factor in geographical pricing differences (although actual land values
are not included in the estimates). The values in this report are based on 100% percent (or
“total”), destruction of the residential structure. Depending on the amount of hurricane-
driven storm surge and wind from a given storm, there may be less than 100% damage to the
residence, which would result in a lower realized RCV.
17To evaluate storm surge and hurricane wind risk at the local level, CoreLogic uses the
designation of CBSAs, which are often referred to as metropolitan areas (>50,000 people), or
micropolitan areas (You can also read