Human Superior Temporal Gyrus Organization of Spectrotemporal Modulation Tuning Derived from Speech Stimuli
←
→
Page content transcription
If your browser does not render page correctly, please read the page content below
2014 • The Journal of Neuroscience, February 10, 2016 • 36(6):2014 –2026

Systems/Circuits

Human Superior Temporal Gyrus Organization of
Spectrotemporal Modulation Tuning Derived from Speech
Stimuli
Patrick W. Hullett,1,2,3 X Liberty S. Hamilton,2,4 Nima Mesgarani,2,4 X Christoph E. Schreiner,1,2,3
and Edward F. Chang1,2,4
1University of California Berkeley and San Francisco Joint Graduate Group in Bioengineering, 2Center for Integrative Neuroscience, 3Department of
Otolaryngology—Head and Neck Surgery, and 4Department of Neurological Surgery, School of Medicine, University of California, San Francisco, San
Francisco, California 94158

The human superior temporal gyrus (STG) is critical for speech perception, yet the organization of spectrotemporal processing of speech
within the STG is not well understood. Here, to characterize the spatial organization of spectrotemporal processing of speech across
human STG, we use high-density cortical surface field potential recordings while participants listened to natural continuous speech.
While synthetic broad-band stimuli did not yield sustained activation of the STG, spectrotemporal receptive fields could be reconstructed
from vigorous responses to speech stimuli. We find that the human STG displays a robust anterior–posterior spatial distribution of
spectrotemporal tuning in which the posterior STG is tuned for temporally fast varying speech sounds that have relatively constant energy
across the frequency axis (low spectral modulation) while the anterior STG is tuned for temporally slow varying speech sounds that have
a high degree of spectral variation across the frequency axis (high spectral modulation). This work illustrates organization of spectro-
temporal processing in the human STG, and illuminates processing of ethologically relevant speech signals in a region of the brain
specialized for speech perception.
Key words: functional organization; human STG; human superior temporal gyrus; modulation tuning; modulotopic; spectrotemporal
processing

      Significance Statement
      Considerable evidence has implicated the human superior temporal gyrus (STG) in speech processing. However, the gross orga-
      nization of spectrotemporal processing of speech within the STG is not well characterized. Here we use natural speech stimuli and
      advanced receptive field characterization methods to show that spectrotemporal features within speech are well organized along
      the posterior-to-anterior axis of the human STG. These findings demonstrate robust functional organization based on spectro-
      temporal modulation content, and illustrate that much of the encoded information in the STG represents the physical acoustic
      properties of speech stimuli.

Introduction                                                                                                              ral gyrus (STG) in speech processing and perception. However,
A remarkable array of imaging, electrophysiological, and func-                                                            organization of basic spectrotemporal processing during speech
tional lesion studies have implicated the human superior tempo-                                                           perception is not well understood (Boatman et al., 1997; Binder et
                                                                                                                          al., 2000; Boatman, 2004; Hickok and Poeppel, 2007; Raus-
                                                                                                                          checker and Scott, 2009). While tonotopy is a prominent orga-
                                                                                                                          nizing principle in the ascending auditory pathway and has been
Received May 2, 2015; revised Nov. 27, 2015; accepted Jan. 5, 2016.                                                       investigated in STG (Talavage et al., 2004; Striem-Amit et al.,
    Author contributions: P.W.H., L.S.H., N.M., C.E.S., and E.F.C. designed research; P.W.H., L.S.H., N.M., C.E.S., and
                                                                                                                          2011; Moerel et al., 2012; Nourski et al., 2014), additional char-
E.F.C. performed research; P.W.H. and L.S.H. analyzed data; P.W.H., L.S.H., N.M., C.E.S., and E.F.C. wrote the paper.
    This work was supported by National Institutes of Health Grants DP2-OD00862 (to E.F.C.), R01-DC012379 (to             acterization of spectrotemporal processing in the context of
E.F.C.), R01-DC02260 (to C.E.S.), and F32-DC014192 (to L.S.H.), and the McKnight Foundation (to E.F.C.). E.F.C. is a      speech processing is less well defined. Here, using speech stimuli
New York Stem Cell Foundation—Robertson Investigator. This research was also supported by The New York Stem               to assess broad organizational principles during natural speech
Cell Foundation. The authors declare no competing financial interests. We thank Craig Atencio, Brian Malone, Bryan
Seybold, and Erik Edwards for their insightful comments on the manuscript.
    Correspondence should be addressed to Edward Chang, University of California, San Francisco, 675 Nelson Rising           DOI:10.1523/JNEUROSCI.1779-15.2016
Lane, San Francisco, CA 94158. E-mail: changed@neurosurg.ucsf.edu.                                                        Copyright © 2016 the authors 0270-6474/16/362014-13$15.00/0
Hullett et al. • Organized Speech Modulation Tuning in Human STG                                      J. Neurosci., February 10, 2016 • 36(6):2014 –2026 • 2015

perception, we examine fundamental spectrotemporal response             Materials and Methods
parameters across the STG.                                              Participants and neural recordings. Subdural ECoG arrays (interelectrode
    A major goal of sensory neuroscience is to understand how           distance, 4 mm) were placed unilaterally in eight patient volunteers
sensory systems encode natural stimuli and, in particular, how          [three right hemisphere (one female/two male), five left hemisphere
spectrotemporal processing is organized in STG during speech            (three female/two male)] undergoing a neurosurgical procedure for the
processing. Traditionally sensory encoding has been studied with        treatment of medication refractory epilepsy. Seven of eight participants
                                                                        were native English speakers; all were fluent in English. All participants
simple parameterized stimuli. However, recently, there has been         had normal hearing. None had communication deficits. All experimental
increasing use of natural stimuli to study sensory encoding             protocols were approved by the University of California, San Francisco
(Theunissen et al., 2000; David et al., 2004; Sharpee et al., 2006;     Institutional Review Board and Committee on Human Research. Loca-
Talebi and Baker, 2012). Part of the motivation for this is increas-    tion of array placement was determined by clinical criteria alone. Partic-
ing evidence that sensory processing is adapted to statistics of        ipants were asked to passively listen to 15–25 min of natural speech while
behaviorally relevant stimuli. Data suggest receptive fields and        ECoG signals were recorded simultaneously. Some participants also pas-
response properties of neurons are matched to the statistics of         sively listened to dynamic moving ripple (DMR) or temporally orthog-
                                                                        onal ripple combination (TORC) stimuli (see below). Signals were
natural inputs to maximize efficiency of information transmis-
                                                                        amplified and sampled at 3052 Hz. After rejection of electrodes with
sion (Dong and Atick, 1995; Rieke et al., 1995; Dan et al., 1996;       excessive noise or artifacts, signals were referenced to a common average
Olshausen and Field, 1996; Hsu et al., 2004). In higher-order           and the high-gamma band (70 –150 Hz) was extracted as the analytic
areas, systems become more selective for natural stimuli and less       amplitude of the Hilbert transform (Crone et al., 2001; Chang et al.,
responsive to synthetic or noise stimuli (Theunissen et al., 2000;      2011). Signals were subsequently downsampled to 100 Hz. The resulting
Wilkinson et al., 2000; Felsen et al., 2005; Talebi and Baker, 2012).   signal for each electrode was z-scored based on the mean and SD of
In areas that respond broadly to both synthetic and natural stim-       activity during the entire block.
uli, natural inputs can push neurons into different operating
                                                                        Stimuli
ranges and activate nonlinearities that evoke response properties       Speech stimuli. Speech stimuli were delivered binaurally through free-
not present with synthetic stimuli alone (David et al., 2004; Talebi    field speakers at ⬃70 dB average sound pressure level. The frequency
and Baker, 2012). Finally, neurons adapt on a moment-by-                power spectrum of stimuli spanned 0 – 8000 Hz. The stimulus set con-
moment basis to match their response properties to statistics of        sisted of prerecorded (2– 4 s) sentences from the phonetically transcribed
the input stimulus, thus making descriptions of sensory encoding        Texas Instruments/Massachusetts Institute of Technology (TIMIT)
inherently specific to the statistics and class of stimuli used for     speech corpus with 1 s silent intervals between each sentence presenta-
                                                                        tion (Garofolo et al., 1993). Each participant was presented 484 – 499
characterization (Smirnakis et al., 1997; Brenner et al., 2000;
                                                                        sentences. The speech corpus included 286 male and 116 female speakers,
Fairhall et al., 2001; Sharpee et al., 2006). Thus, in situations       with 1–3 sentences spoken per speaker, and unique lexical content for
where the question of interest is to understand encoding of nat-        each sentence. Spectrogram representations of speech stimuli were gen-
ural stimuli, it is advantageous to use natural inputs, such as         erated using a cochlear model of auditory processing (Yang et al., 1992).
speech, to characterize the system.                                        Synthetic stimuli. DMR stimuli were presented to four subjects (EC63,
    Given the relevance of STG in speech processing, we are             GP30, GP31, and GP33) at 70 dB average sound pressure level. Of these,
interested in characterizing spectrotemporal processing in the          only GP31 was included in the functional organization analysis. The
context of natural speech. However, characterization of spec-           other three participants had less predictive or noncontiguously spaced
                                                                        MID-based STRFs along STG and thus were less useful for characterizing
trotemporal processing based on speech stimuli is difficult due         organization of spectrotemporal processing (but still of sufficient data
to the statistically biased and highly correlated structure of          quality to assess responsiveness). The DMR was composed of a bank of
natural signals. Recently, a number of techniques have been             sinusoidal carriers whose amplitude is modulated over time with a spec-
developed to address this bias (Theunissen et al., 2001; Panin-         trotemporal ripple envelope (Depireux et al., 2001; Escabi and Schreiner,
ski, 2004; Sharpee et al., 2004; David et al., 2007). Here we           2002). The amplitude distribution of the envelope was Gaussian and had
use maximally informative dimension (MID) analysis, an                  a maximum modulation depth of 40 dB. The DMR is broadband (500 –
information-based method designed to lift the requirement of            20,000 Hz) and consisted of ⬃50 sinusoidal carriers per octave with
                                                                        randomized phase. The spectral and temporal modulation frequency
statistically tractable stimuli and allow the use of more com-
                                                                        parameters defined the characteristics of the ripple modulation envelope
plex, but ethologically relevant, natural stimuli for receptive         at any given point in time. The spectral modulation parameter defines
field characterization (Sharpee et al., 2004; Atencio et al.,           the number of spectral peaks per octave. The temporal modulation pa-
2008).                                                                  rameter defines the speed and direction of the peak’s change. Spectral
    By using electrocorticography (ECoG) to record speech-              and temporal modulation parameters were varied randomly and inde-
driven activity, we compute spectrotemporal receptive fields            pendently during the stimulus. The spectral modulation parameter var-
(STRFs) using MID analysis and assess the organization of spec-         ied between 0 and 4 cycles/octave (maximum rate of change, 1 Hz) and
                                                                        the temporal modulation rate parameter varied between ⫺35 and ⫹35
trotemporal processing in human STG during natural speech
                                                                        Hz (rate of change, ⱕ3 Hz). TORC stimuli were presented to two subjects
processing. While synthetic broad-band stimuli did not yield            (EC2 and EC28) at 70 dB average sound pressure level. TORC stimuli are
strong activation of the STG, STRFs could be reconstructed from         generated by modulating broadband white noise (frequency content,
vigorous responses to speech stimuli. We find that the human            250 – 8000 Hz) with a combination of 12 temporally orthogonal ripples
STG displays a robust anterior–posterior spatial distribution of        (Klein et al., 2000). The spectral modulation of ripples ranged between 0
spectrotemporal tuning characterized by tuning for high tempo-          and 1.4 cycles/octave and the temporal modulation of ripples ranged
ral and low spectral modulation speech features posteriorly and         between 4 and 48 Hz.
high spectral and low temporal modulation speech features an-
                                                                        Analysis
teriorly. This work further defines organization of spectrotempo-       STRFs. STRFs were computed with two different methods designed spe-
ral processing of speech in human STG, and illuminates                  cifically for use with naturalistic stimuli—MID analysis and normalized
processing of ethologically relevant speech signals in a region of      reverse correlation (Theunissen et al., 2001; Sharpee et al., 2004). To
the brain specialized for speech perception.                            compute STRFs using MID analysis, a gradient ascent procedure was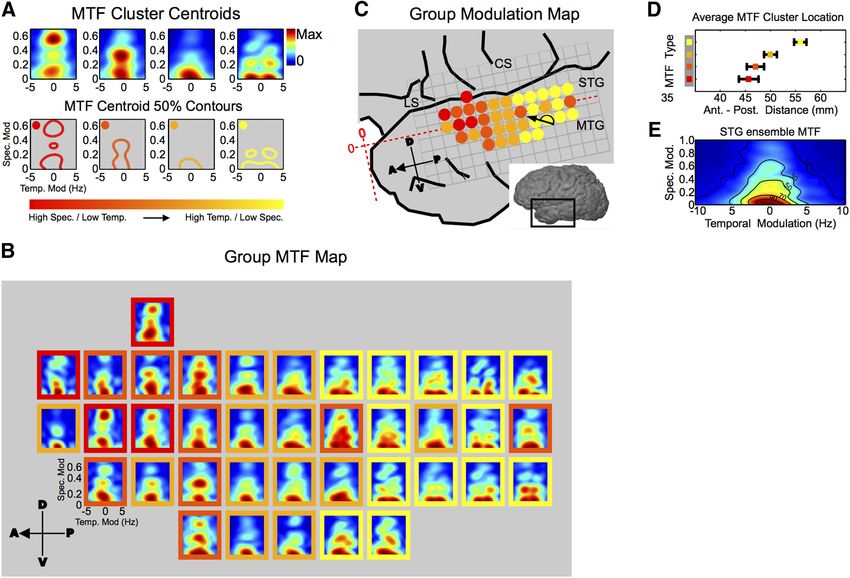
2016 • J. Neurosci., February 10, 2016 • 36(6):2014 –2026 Hullett et al. • Organized Speech Modulation Tuning in Human STG
used to search for the receptive field that maximizes the Kullback–Leibler surface of the STG. To compute the gradient of such maps, a two-
divergence between the raw distribution of STRF-stimulus projection dimensional plane was fit to the data using linear (planar) regression. The
values and the distribution of STRF-stimulus projection values weighted direction of steepest angle of the plane is taken to be the gradient of the
by the magnitude of the response. STRF estimates based on normalized topographic map (Baumann et al., 2011). The gradient direction is spec-
reverse correlation (normalization based on the stimulus autocorrelation ified as an angle counterclockwise from the x-axis of the coordinate
matrix) were computed using ridge regression with open source code system that runs in the anterior–posterior direction along the long axis of
available at http://strfpak.berkeley.edu/. Regularization was controlled STG. For spectrotemporal modulation maps, which represent a map of
by fitting a tolerance hyperparameter via cross-validation (David et al., two parameters, spectral and temporal modulation values were normal-
2007). STRFs were computed with both methods on the same estimation ized by their group maxima so each set of data has a range of 0 –1.
set (90% of the total data) and cross-validated on the same test set, which Gradients were calculated for the spectral modulation map and temporal
was withheld from the estimation process (10% of the data). modulation map independently and then averaged to determine the gra-
Modulation tuning. To characterize modulation tuning-based organi- dient for the joint spectrotemporal modulation map.
zation, the modulation transfer function (MTF) for each site was com-
puted by taking the magnitude of the two-dimensional Fourier Results
transform (ℑ2 兵 䡠 其) of each STRF according to the following equation: STRF maps
Given the role of STG in speech processing, we are interested in
MTF 共 t , s 兲 ⫽ 兩ℑ 2 兵 STRF 共 t, f 兲其 兩 characterizing functional organization in STG based on re-
sponses to natural speech stimuli. After ECoG array placement,
Where (t, f ) are time and frequency and (t, s) are temporal and spec-
participants were asked to passively listen to 15–25 min of natural
tral modulation, respectively. The best spectrotemporal modulation
(bSTM) is defined as the peak of the MTF (see Fig. 3A). The sign of the speech, which consisted of prerecorded (2– 4 s) sentences from
best temporal modulation determines the drift direction of spectral con- the phonetically transcribed TIMIT speech corpus (Garofolo et
tent within each ripple (increasing or decreasing; see Fig. 3B). Similar to al., 1993). After data collection, an STRF was computed off-line
previous work, we are interested in the magnitude of temporal modula- from the local field potential signal at each cortical site to generate
tion and therefore take the absolute value of best temporal modulations an STG STRF map in each subject (Fig. 1A). STRFs were com-
(Langers et al., 2003; Santoro et al., 2014). The ensemble MTF was com- puted using the high-gamma (70 –150 Hz) band of ECoG record-
puted by normalizing each MTF to have a sum of 1, then computing the ings (Crone et al., 2001), which correlates with spiking activity
average MTF across all sites and all participants. (Ray and Maunsell, 2011) and spike-based tuning properties in
Spatial analysis. Permutation tests were used to assess whether STRF- the midlaminar auditory cortex (Steinschneider et al., 2008). To
derived parameters, such as bSTM, MTF cluster type, or best frequency
compute STRFs, two different methods designed for use with
(BF), were locally organized. Each test determined whether the average
level of similarity between a site and its neighbors would be expected if natural signals were used: MID analysis (Sharpee et al., 2004) and
the true underlying spatial organization were random. For each site, we normalized reverse correlation (Theunissen et al., 2001). Using
compute difference between a site and its neighbors (anterior, posterior, these two methods, we computed MID and normalized reverse
dorsal, and ventral), take the absolute value, and then compute the aver- correlation-based STRFs using responses to speech stimuli and
age. This value is computed for each site and then averaged across the evaluated their performance through cross-validation. While
whole map to compute the mean neighborhood similarity index. The MID-based STRFs were generally similar to normalized reverse
map is then randomly permuted 10,000 times and the map neighbor- correlation-based STRFs, MID-based STRFs produced higher
hood similarity index recomputed on each permutation to generate a prediction values and were therefore used in the remainder of the
distribution of randomized map neighborhood similarity indices. The analysis (Fig. 1C; p ⬍ 0.001, Wilcoxon signed-rank test, mean
true neighborhood similarity index is compared with the randomized
percentage increase in prediction: 19.0 ⫾ 1.9% SEM).
map neighborhood similarity index distribution to assess the level of
significance. To determine significance values for each spectrotemporal For purposes of studying organization of spectrotemporal
modulation map (two parameters at each site: one for best spectral mod- processing, it is necessary to restrict analysis to STRFs that char-
ulation, one for best temporal modulation), the above procedure was acterize the underlying spectrotemporal processing. Similar to
repeated with a two-parameter neighborhood similarity metric. The previous work, only sites that predict ⱖ5% of the variance in the
two-parameter neighborhood similarity metric was generated by nor- response were included in the analysis (Fig. 1 D, E; Kim and
malizing best temporal modulation values and best spectral modulation Doupe, 2011). This set of STRFs showed relatively high predic-
values by their respective maxima so both sets of data had a range of 0 –1. tion performance (mean r ⫽ 0.48 ⫾ 0.12 SD; Fig. 1D), compara-
For each parameter at each site, we compute difference between a site and ble to STRF prediction values from lower-order areas (Calabrese
its neighbors (anterior, posterior, dorsal, and ventral), take the absolute et al., 2011; Kim and Doupe, 2011). These highly predictive
value, and then compute the average. This value for each parameter was
STRFs are based on the acoustic properties of speech alone and
then added together to generate the two-parameter similarity metric.
This metric was averaged across sites to generate the two-parameter neigh- the model does not take into account other aspects of speech,
borhood similarity index for the entire map. While there are many metrics such as semantic meaning. This indicates that the physical acous-
that could potentially be used to quantify organization, we choose to use tic properties of speech are a major component of the encoded
neighborhood similarity because of its generality in that previously described information in STG and the computed speech-based STRFs pro-
forms of organization (linear gradients, nonlinear gradients, clusters, or vide a good characterization of the underlying spectrotemporal
modules) have neighborhood similarity as a common feature. processing of speech. Similar to STRFs found in lower-order au-
Group analysis was achieved by combining data across subjects in a ditory areas, STRFs within STG showed clear contiguous excit-
common coordinate system defined by anatomical landmarks. The atory and inhibitory regions and structure characteristic of
x-axis was defined as a line that runs parallel to the long axis of STG along “temporal” and “spectral” STRFs (Fig. 2; Nagel and Doupe, 2008;
its dorsal–ventral midpoint. The y-axis was defined as a line orthogonal
Atencio et al., 2008). Temporal STRF aspects exhibit short excit-
to the x-axis with the origin aligned with the anterior temporal pole (see
Fig. 6D, red). After coordinates of ECoG sites were defined, data were atory regions followed by short inhibitory regions (Fig. 2, ●).
binned at 4 mm resolution consistent with the interelectrode distance of These types of STRFs are characteristic of sites tuned for rapid
the ECoG arrays (4 mm interelectrode distance). Tonotopic and spectro- temporal modulations in sound energy that occur at the onset or
temporal modulation maps represent topographic distributions of BF offset of sound and within many consonants. Spectral STRF as-
and preferred spectrotemporal modulation across the two-dimensional pects are characterized by temporally long excitatory regions
Hullett et al. • Organized Speech Modulation Tuning in Human STG J. Neurosci., February 10, 2016 • 36(6):2014 –2026 • 2017
flanked by inhibition on one or both sides
(Fig. 2, 䡲). These types of STRFs are char-
acteristic of sites tuned to sound energy
that fluctuates across frequency, but is rel-
atively constant over time, such as the for-
mant structure prevalent in vowel sounds.
These data show that STG STRFs have char-
acteristics similar to STRFs found in lower-
order auditory areas and are predictive of
responses to speech stimuli, demonstrating
their ability to characterize spectrotemporal
processing of speech in STG.
Organization of spectrotemporal
processing of speech in human STG
Given that the STRF characterizes spec-
trotemporal processing at each ECoG site,
the STRF map characterizes how process-
ing varies across STG. However, as Figure
2 shows, the spectrotemporal structure
within each STRF is relatively complex,
making it difficult to empirically visualize
or quantify organizational aspects from
the raw STRF maps. One alternative rep-
resentation of the STRF that contains
identical spectrotemporal information
(minus phase), but which exhibits visually
less complex structure, is the MTF (Fig.
3). The MTF characterizes spectrotempo-
ral modulation tuning of each STRF with
a structure that is often more localized in
modulation space than the correspond-
ing STRF structure within the time–fre-
quency domain (Fig. 3A, compare STRF,
MTF). Additionally, STRF features that
are shifted in frequency or time, but have
the same overall spectrotemporal struc-
ture, have the same MTF representation
because phase information is discarded.
Using this alternative, but less complex
and equivalent representation of the
STRF, we examined the distribution of
MTFs within the STG. A map of MTFs for
one participant (EC6) is shown in Figure
4. The “temporal” and “spectral” STRFs
shown in Figure 2 have corresponding
temporal and spectral MTFs in Figure 4.
Temporal transfer functions (●) are char-
acterized by tuning shifted away from the
vertical midline toward high temporal
modulations. Spectral transfer functions
(䡲) are characterized by tuning shifted
away from the base of the MTF toward
Figure 1. Experimental approach and the STRF. A, Experimental approach. An STRF was computed off-line for each ECoG high spectral modulations. In this repre-
electrode site (top, center) to generate a corresponding STRF map (bottom, center) . The STRF describes the spectrotemporal sentation it becomes more apparent, on
structure in the stimulus that drives activity at a particular site. On the right is a subset of measured and predicted responses for the
visual inspection, that sites in the poste-
sentence “He sized up the situation and shook his head” (spectrogram at left). B, An STRF and the predicted and measured response
for a single sentence. Predicted responses are obtained by convolving the stimulus with the STRF and are proportional to the
rior STG are tuned for high temporal
similarity between the spectrotemporal content in the stimulus and the receptive field. C, Comparison of two methods used to modulations (energy shifted away from
compute STRFs. MID-based STRFs show higher predictive performance compared with normalized reverse correlation (NRC)-based the vertical axis) and sites in the anterior
STRFs (mean percentage increase in prediction: 19.0 ⫾ 1.9% SEM, p ⬍ 0.001, Wilcoxon signed-rank test). D, MID-STRF Pearson STG are tuned for slow temporal modula-
correlation coefficient prediction values for all STG sites. E, MID-STRF predicted variance values for all sites. Sites with ⬎5% of the tions, but high spectral modulations (en-
variance predicted (red) were included in the analysis. MID, maximally informative dimension analysis; NRC, normalized reverse ergy falling along the vertical axis and
correlation analysis. shifted upward).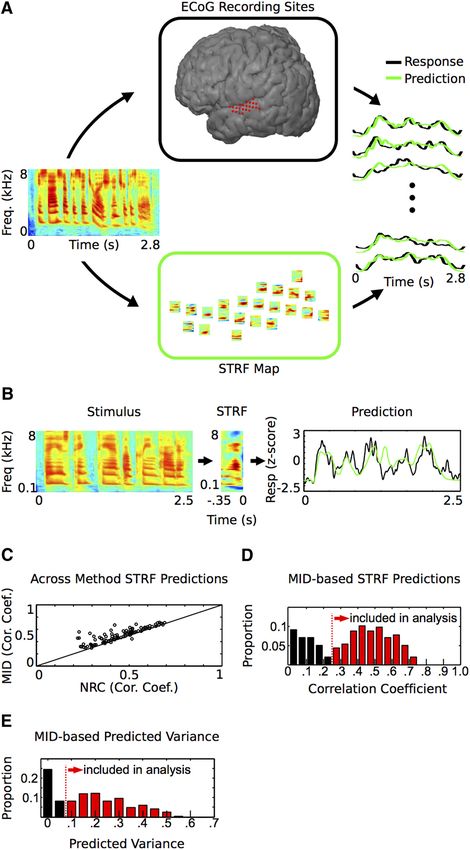
2018 • J. Neurosci., February 10, 2016 • 36(6):2014 –2026 Hullett et al. • Organized Speech Modulation Tuning in Human STG
To more thoroughly characterize this
apparent nonrandom distribution of
spectrotemporal processing, representa-
tive MTFs of STG were first identified by
k-means clustering of all MTFs from all
participants. Silhouette criterion values
were used to identify the number of data
clusters that maximize intracluster simi-
larity compared with similarity between
neighboring clusters. The centroid MTFs
from this analysis are shown in Figure 5A,
along with their 50% energy contours.
Compared with the average MTF for STG
(Fig. 5E), centroid MTFs occupy discrete
regions of modulation tuning space in an
orderly fashion from high spectral/low
temporal modulation tuning (Fig. 5A, left
MTF with red contour) to high temporal/
low spectral modulation tuning (Fig. 5A,
right MTF with yellow contour). To ex- Figure 2. Participant EC6 cortical STRF map. A, STRF map for participant EC6 (STRFs calculated with MID analysis). STG STRFs
amine the distribution of overall spectro- showed clear contiguous excitatory and inhibitory regions and structure characteristic of STRFs found in other regions. Represen-
temporal modulation tuning across STG, tative temporal STRFs (●, tuned to quick onsets or offsets), and spectral STRFs (䡲, tuned to constant sound energy that fluctuates
a group MTF map was computed and across frequency), are shown. LS, Lateral sulcus; STS, superior temporal sulcus; MTG, medial temporal gyrus; CS, central sulcus.
each MTF within the map was classified
according to its cluster identity (Fig. 5B). al., 2002; Rodríguez et al., 2010; Atencio and Schreiner, 2012),
Cluster identities from the group map are plotted in Figure 5C. and in models of auditory processing that predict receptive field
This map shows significant local organization of the MTF type structure based on efficient coding hypotheses (Carlson et al.,
( p ⬍ 1.0 ⫻ 10 ⫺5, neighborhood similarity permutation test) and 2012).
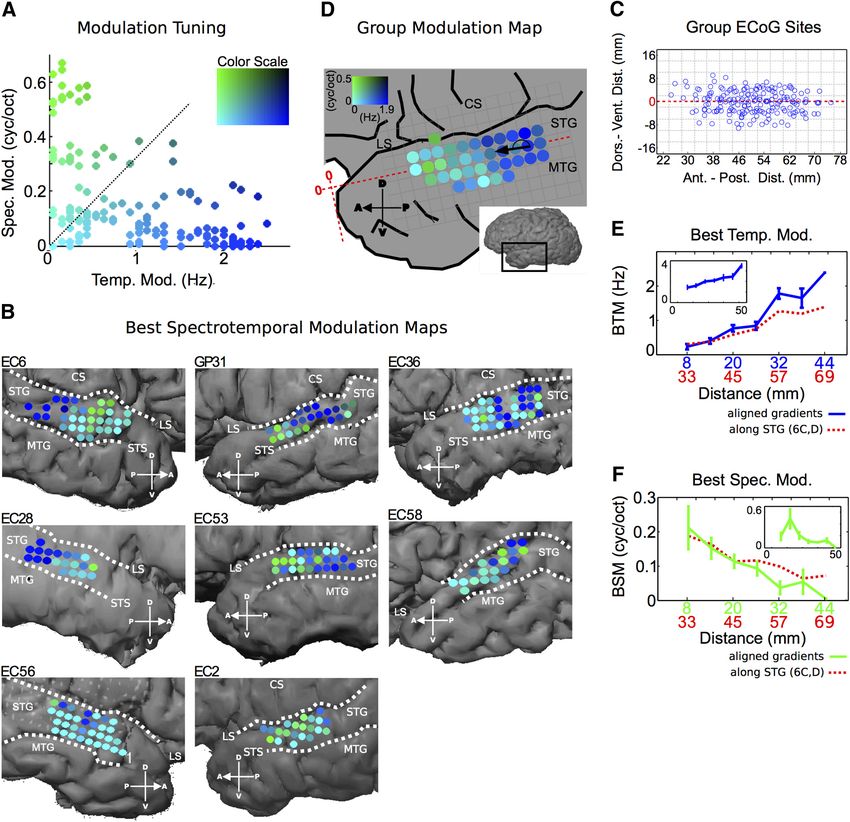
illustrates anterior-to-posterior organization of modulation tun- To examine the spatial distribution of bSTM tuning across the
ing along the STG in which high spectral modulation/low tem- human STG, we plot bSTM values at their corresponding cortical
poral modulation tuned MTFs are located anteriorly (red). By position within each subject (Fig. 6A, color scale, B). Most par-
contrast, high temporal modulation/low spectral modulation ticipants show a significant degree of nonrandom local organiza-
tuned MTFs are located posteriorly (yellow). This is further tion that is consistent across participants (EC6, p ⬍ 1.0 ⫻ 10 ⫺5;
quantified by the average location of each MTF type along the GP31, p ⫽ 5.0 ⫻ 10 ⫺4; EC36, p ⫽ 0.029; EC28, p ⫽ 4.5 ⫻ 10 ⫺5;
anterior-to-posterior extent of the STG (Fig. 5D). Overall, this EC53, p ⫽ 0.015; EC58, p ⫽ 0.10; EC56, p ⫽ 0.06; EC2, p ⫽ 0.42;
shows that the STG is tuned for temporally fast-changing speech two-parameter neighborhood similarity permutation test). Pos-
sounds that have relatively constant energy across the frequency
terior regions of the STG show primarily high temporal modula-
axis (low spectral modulation) in the posterior STG while the
tion/low spectral modulation tuning (blue), while more anterior
anterior STG is tuned for temporally slow-changing speech
regions show primarily high spectral modulation/low temporal
sound that have a high degree of spectral variation across the
modulation tuning (green). With respect to interhemispheric
frequency axis (high spectral modulation).
differences, there was no significant difference in best temporal
To further illustrate the organized distribution of spectrotem-
modulation tuning (left: mean, 0.89 ⫾ 0.8 Hz; right: mean,
poral processing along the anterior–posterior extent of the STG,
we plot the distribution of MTF peak values across the STG. The 0.72 ⫾ 0.8 Hz, p ⫽ 0.17, Wilcoxon rank-sum test) and a subtle
peak of the MTF defines the bSTM, and in this context represents difference in best spectral modulation tuning (left: mean, 0.14 ⫾
the dominant spectrotemporal modulation in the feature each 0.17 cycles/octave; right: mean, 0.08 ⫾ 0.13 cycles/octave, p ⫽
site is tuned to (as captured by the STRF). It should be noted that 0.015, Wilcoxon rank-sum test). To examine data across subjects,
examining the distribution of MTF peaks (bSTM values) derived we computed a group modulation tuning map, which is shown in
for natural speech does not imply that the STG will respond to Figure 6D. Similar to individual subject maps, the group map
individual spectrotemporal modulations. Rather, the localized shows primarily high temporal modulation/low spectral modu-
nature of modulation energy in MTFs makes the peak a good lation tuning posteriorly (blue) and high spectral modulation/
descriptor of the overall MTF tuning. The distribution of bSTMs low temporal modulation tuning anteriorly (green, p ⬍ 1.0 ⫻
can, therefore, be used to further characterize overall organiza- 10 ⫺5, neighborhood similarity permutation test). The dominant
tion of spectrotemporal modulation tuning in the STG. The dis- gradient within the group modulation map runs in the posterior-
tribution of bSTMs for all sites and from all participants is shown to-anterior direction (⫹176° counterclockwise from the 3
in Figure 6A. The relationship between best temporal modula- o’clock position; Fig. 6D) nearly parallel with the anterior–pos-
tion and best spectral modulation shows a trade-off pattern in terior axis of the STG. Again, these data represent organized spec-
which spectral modulation decreases with increasing temporal trotemporal processing along the STG, in which posterior
modulation. This relationship between spectral and temporal regions are tuned to temporally fast sounds with relatively con-
modulation tuning has been observed previously in other audi- stant energy along the spectral axis (low spectral modulation) and
tory areas, including the human primary auditory cortex (Schön- more anterior regions are tuned for temporally slower sound
wiesner and Zatorre, 2009), the cat primary auditory cortex, the with high variation in energy along the spectral axis (high spectral
cat medial geniculate body, the cat inferior colliculus (Miller et modulation). To further characterize modulation organization,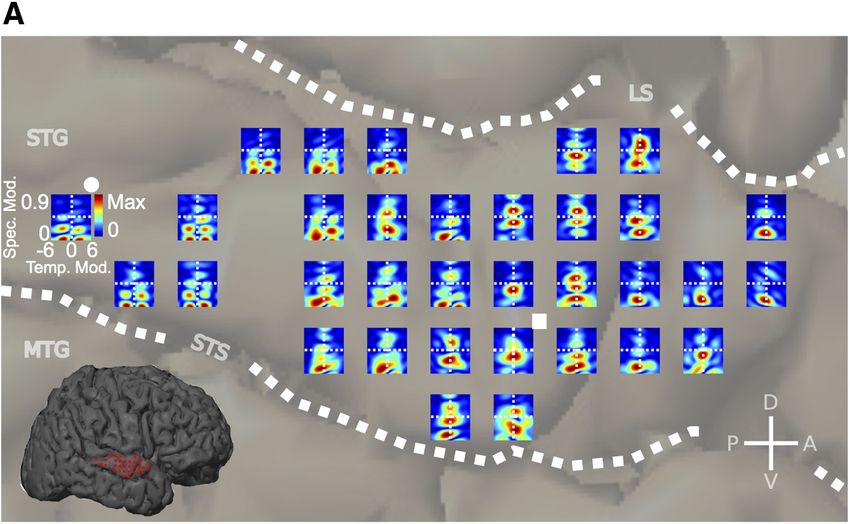
Hullett et al. • Organized Speech Modulation Tuning in Human STG                                                                          J. Neurosci., February 10, 2016 • 36(6):2014 –2026 • 2019

Figure 3. The modulation transfer function and best spectrotemporal modulation (bSTM). A, Computation of the modulation transfer function (MTF). The MTF is derived as the magnitude of the
two-dimensional Fourier transform of the STRF. It characterizes spectrotemporal modulation tuning for each site. Like the BF of a frequency tuning curve, the peak of the MTF defines the bSTM and
represents a good descriptor of the overall MTF given the localized nature of modulation tuning within each MTF. For the site with the STRF shown at the top, the MTF indicates that high spectral
modulations and low temporal modulations drive activity at that site. In contrast, the site below has a bSTM at high temporal modulations and low spectral modulations, indicating that the site is
driven by changes in temporal and not spectral energy. B, Ordered array of spectrotemporal modulations as a function of their temporal and spectral modulation parameters. Spectrotemporal
modulations represent the envelope “frequency” components of the spectrogram. Any spectrogram can be reconstructed exactly by a weighted sum of spectrotemporal modulations since they form
a complete orthonormal basis of functions.

                                                                                                                                   posterior–anterior aspect of the STG. A
                                                                                                                                   similar but less robust distribution of
                                                                                                                                   modulation tuning was also seen for
                                                                                                                                   STRFs based on normalized reverse corre-
                                                                                                                                   lation (Fig. 6 E, F, insets). Further analysis
                                                                                                                                   showed no compelling additional organi-
                                                                                                                                   zation within the maps based on inclusion
                                                                                                                                   of the temporal modulation sign (positive
                                                                                                                                   vs negative), no organized distribution of
                                                                                                                                   prediction performance that paralleled
                                                                                                                                   the distribution of spectrotemporal mod-
                                                                                                                                   ulation tuning, and no difference in pre-
                                                                                                                                   diction performance between “spectral”
                                                                                                                                   and “temporal” STRFs (r value mean,
                                                                                                                                   0.50 ⫾ 0.13 vs 0.48 ⫾ 0.11, respectively;
                                                                                                                                   p ⫽ 0.23, Wilcoxon rank-sum test; “spec-
                                                                                                                                   tral” and “temporal” STRFs defined as
                                                                                                                                   having bSTM values above or below the
                                                                                                                                   diagonal in Fig. 5A, respectively). Collec-
Figure 4. Participant EC6 cortical modulation tuning map. A, Modulation tuning map for participant EC6. Each MTF is derived tively, these data reveal spatially organized
from the corresponding STRF. Representative temporal (●) and spectral (䡲) MTFs are shown. Although MTFs and STRFs contain spectrotemporal processing of speech in
equivalent information about spectrotemporal processing (except for phase information, which is discarded in MTFs), the overall human STG in which tuning varies from
structure of MTFs is less complex than that of STRFs. As shown, sites in the posterior STG are tuned for high temporal modulations high temporal/low spectral modulation
(energy shifted away from the vertical midline) and sites in the anterior STG are tuned for slow temporal modulations and high
                                                                                                                                   tuning in the posterior STG to high spec-
spectral modulations (energy falling along the vertical midline and shifted upward). LS, Lateral sulcus; STS, superior temporal
sulcus; MTG, medial temporal gyrus; CS, central sulcus.
                                                                                                                                   tral/low temporal modulation tuning in
                                                                                                                                   the middle STG. This organization is rem-
                                                                                                                                   iniscent of the posterior-to-anterior dis-
average best temporal modulation and best spectral modulation
                                                                                                       tribution of temporal modulation tuning found at the lateral
tuning are plotted as a function of distance along the anterior–
posterior extent of the STG (Fig. 6 E, F, red). Additionally, mod-                                     aspect of the superior temporal plane in macaques as may have
ulation tuning was plotted as a function of map distance after                                         been predicted for directly adjacent areas (Baumann et al., 2015).
individual maps have been aligned by their individual gradients                                             To determine whether organization of spectrotemporal mod-
(Fig. 6 E, F, blue and green lines). This shows a transition from                                      ulation tuning within the STG is present during processing of
high temporal modulation to high spectral modulation along the                                         more traditional stimuli used to characterize modulation tuning,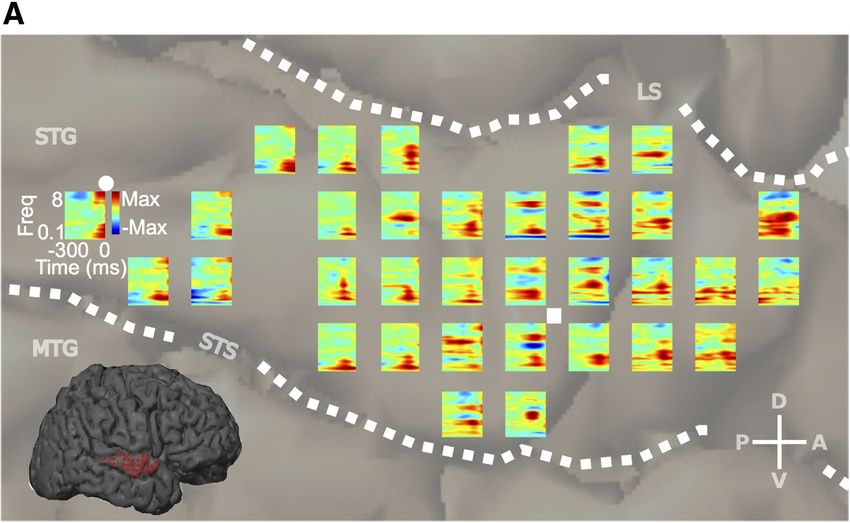
2020 • J. Neurosci., February 10, 2016 • 36(6):2014 –2026                                                                            Hullett et al. • Organized Speech Modulation Tuning in Human STG

Figure 5. Organization of MTFs in STG. A, K-means cluster centroids generated from all MTFs across all participants. Their respective 50% contours are shown below. The overall tuning within an
individual MTF centroid is fairly well localized. The collection of MTF centroid types span modulation space from high spectral/low temporal regions (red, left) to high temporal/low spectral regions
(yellow, right) as shown by the 50% contours. B, Group MTF map. The map represents the average MTF across participants at each STG position. Only locations with ⱖ2 MTFs contributing to the
average are included. Each MTF within the map is color-coded by its cluster membership. C, MTF cluster identity map. MTF cluster identities from B are plotted. The cluster identity map shows a
transition from high spectral/low temporal MTFs anteriorly (red) to high temporal/low spectral MTFs posteriorly (yellow) and a significant degree of local organization ( p ⬍ 1.0 ⫻ 10 ⫺5,
neighborhood similarity permutation test). D, Average MTF cluster distance along the anterior–posterior extent of STG. Distances are measured from the anterior temporal pole illustrated in C (red
horizontal axis). High spectral/low temporal MTFs are located anteriorly (red). High temporal/low spectral MTFs are located posteriorly (yellow, error bars represent SEM). E, Ensemble MTF
(population average) for STG. Contour lines represent percentage maximum. LS, lateral sulcus; STG, superior temporal gyrus; MTG, medial temporal gyrus; CS, central sulcus.

DMR stimuli (Depireux et al., 2001; Escabi and Schreiner, 2002)                                      the frequency with the largest gain at any time point within the
were presented to four subjects while recording from the STG.                                        STRF. The second metric is defined as the peak of the spectral
Consistent with previous work (Schönwiesner and Zatorre,                                            receptive field (SRF). The SRF is obtained by summing across the
2009), these synthetic stimuli did not sufficiently activate the                                     temporal dimension of the STRF. The peak of the SRF (SRF-BF)
human STG (Fig. 7). Additionally, TORC stimuli, a variant of                                         takes into account all temporal lags of the STRF and identifies the
moving ripple stimuli (Klein et al., 2006), were presented in two                                    frequency associated with the largest net gain. Both metrics of BF
participants without significant sustained activation of the STG                                     showed similar tuning across ECoG sites (Pearson correlation
(data not shown). These data are consistent with only minimal                                        coefficient, 0.693) and the average difference in BF between an
temporal lobe activation outside of the superior temporal plane                                      ECoG site and its directly adjacent neighbors (anterior, posterior,
by nonspeech stimuli as seen by Overath et al. (2015) and Schön-                                    dorsal, ventral) was not significantly different between the two
wiesner and Zatorre (2009) and implies a degree of specificity of                                    metrics, reflecting equal degrees of neighborhood similarity
the organization demonstrated here for speech in that more tra-                                      (mean difference in BF between adjacent sites: STRF-BF, 0.7 ⫾
ditional nonspeech synthetic stimuli do not drive robust activity                                    0.65 octaves SE; SRF-BF, 0.84 ⫾ 0.72 octaves SE, p ⫽ 0.065,
in the STG.                                                                                          Wilcoxon rank-sum test). Individual maps for the topography of
                                                                                                     STRF-BF values are shown in Figure 8B. For both metrics,
Topography of spectral tuning                                                                        only two of eight participants showed a significant degree of local
Last, we analyzed the spatial distribution of frequency tuning in                                    organization based on neighborhood similarity (STRF-BF p/
human STG to examine the relationship between spectral fre-                                          SRF-BF p: EC6, p ⫽ 0.12/0.23; GP31, p ⫽ 0.004/0.007; EC36, p ⫽
quency and modulation tuning in this region. To examine the                                          0.10/0.04; EC28, p ⫽ 0.02/0.75; EC53, p ⫽ 0.29/0.13; EC58, p ⫽
distribution of spectral tuning, two metrics derived from the                                        0.27/0.07; EC56, p ⫽ 0.39/0.20; EC2, p ⫽ 0.11/0.25; neighbor-
STRF were used to characterize BF. The first metric is defined as                                    hood similarity permutation test). Examination of the group
the peak excitatory value of the STRF (STRF-BF) and represents                                       map also showed a low degree of local organization based on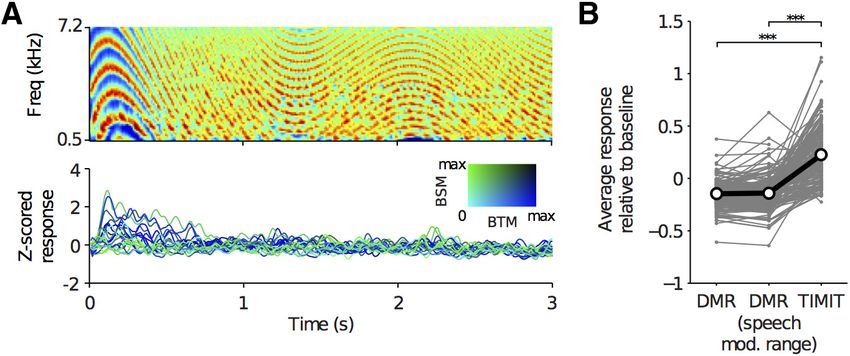
Hullett et al. • Organized Speech Modulation Tuning in Human STG                                                                  J. Neurosci., February 10, 2016 • 36(6):2014 –2026 • 2021

Figure 6. Organization of bSTM tuning in STG. A, bSTM tuning values from all participants. The distribution of bSTM values shows a particular relationship in which spectral modulation
tuning decreases as temporal modulation tuning increases. B, Individual subject bSTM maps (A, color scale). Most participants show high temporal/low spectral modulation tuning
posteriorly (blue), and high spectral/low temporal modulation tuning anteriorly (green) with significant nonrandom organization (EC6, p ⬍ 1.0 ⫻ 10 ⫺5; GP31, p ⫽ 5.0 ⫻ 10 ⫺4; EC36,
p ⫽ 0.029; EC28, p ⫽ 4.5 ⫻ 10 ⫺5; EC53, p ⫽ 0.015; EC58, p ⫽ 0.10; EC56, p ⫽ 0.06; EC2, p ⫽ 0.42; two-parameter neighborhood similarity permutation test). C, Topographic ECoG
site distribution along the anterior–posterior/dorsal–ventral extent of the STG. An example of the coordinate system used to measure distances is shown in D (red axis). Distances along
the long axis of STG are measured from the anterior temporal pole. Distances along the short axis of STG are measured from the dorsal–ventral midpoint of the STG. D, Group
spectrotemporal modulation tuning map. Only sites with data from ⱖ2 participants are included. High temporal/low spectral modulation tuned sites are located posteriorly (blue) and
high spectral/low temporal modulation tuned sites are located anteriorly (green) with significant nonrandom organization and a mean gradient of ⫹176° counterclockwise from the
long axis of the STG ( p ⬍ 1.0 ⫻ 10 ⫺5, neighborhood similarity permutation test). Data were binned at 4 ⫻ 4 mm resolution (same interelectrode distance as the ECoG array). E, Average
best temporal modulation tuning as a function of distance along the dominant spectrotemporal modulation gradient. Individual subject maps were aligned by their gradients before
averaging (blue, error bars represent SEM). Absolute distance is from the edge of data after maps have been aligned. The red function represents the raw average of temporal modulation
tuning as a function of distance along the STG from the anterior temporal pole (D, horizontal red line; no map alignment by gradient before averaging). The inset represents data from
normalized reverse correlation-based STRFs. F, Average best spectral modulation tuning as a function of distance along the dominant spectrotemporal modulation gradient. Maps were
aligned by their gradients before averaging (green, error bars represent SEM). Absolute distance is from the edge of data after maps have been aligned. The red function represents the
raw average of spectral modulation as a function of distance along the STG from the anterior temporal pole (D, horizontal red line; no map alignment by gradient before averaging). The
inset represents data from normalized reverse correlation-based STRFs. LS, Lateral sulcus; STS, superior temporal sulcus; MTG, medial temporal gyrus; CS, central sulcus.
2022 • J. Neurosci., February 10, 2016 • 36(6):2014 –2026                                                               Hullett et al. • Organized Speech Modulation Tuning in Human STG

neighborhood similarity (Fig. 8A, group:
STRF-BF, p ⫽ 0.1; SRF-BF, p ⫽ 0.06;
neighborhood similarity permutation
test). Despite the general lack of signifi-
cant tonotopic organization within indi-
vidual subjects based on neighborhood
similarity, mean BF in the group data de-
creased as a function of distance along the
STG (Fig. 8C). One aspect of spectral tun-
ing that increases the complexity of char-
acterizing spectral tuning organization is
the widespread presence of multipeaked
SRFs in the STG. Figure 8D shows an ex-
ample of a multipeaked SRF with four
                                                  Figure 7. DMR stimuli do not activate STG as robustly as speech stimuli from TIMIT. A, Spectrogram of a 3 s segment of the 5 min
peaks at the 50% maximum level (red DMR stimulus (top) and examples of corresponding Z-scored high-gamma responses from STG electrodes in one subject (GP31).
line). We quantified the degree of multi- Z-score was calculated using a silent baseline period. Electrode responses are colored according to their best spectral modulation
peaked tuning in the STG by measuring (BSM) and best temporal modulation (BTM) as derived from TIMIT stimuli. As demonstrated in the bottom panel, STG electrodes
the average number of spectral tuning showed responses to the onset of DMR stimuli, but did not elicit strong responses during the rest of the 5 min stimulus. B,
peaks as a function of percentage maxi- Comparison between the average response to the DMR stimulus and the average response to TIMIT sentences for STG electrodes
mum level (Fig. 8E). At 80% maximum, (N ⫽ 4 subjects: EC63, GP30, GP31, GP33). The response to speech was significantly higher than the response to DMR stimuli
                                                                                ⫺26                                                          ⫺25
the average number of spectral peaks was (speech vs DMR, p ⫽ 1 ⫻ 10 ; speech vs DMR (speech modulations), p ⫽ 1.6 ⫻ 10 , Wilcoxon signed rank test, 198 STG
1.4 ⫾ 0.7 with the number of peaks in-            electrodes). The average  response   was calculated  across the entire DMR   stimulus (labeled DMR) and across time points during
creasing to 2.6 ⫾ 1.1 at 50% maximum.             which  the DMR  included  modulations   within  the tuning  range for STG (labeled speech  modulations: spectral modulations, ⱕ1
We also quantified the distribution of SRF cycle/octave; the absolute value of the temporal modulations, ⱕ3 Hz). Gray lines connect the mean response for the same
                                                  electrode across stimuli; black line indicates the average. For both stimuli, Z-scored responses were recalculated using a silent
types (classified by peak number) for each baseline to allow for comparisons across stimuli.
level of percentage maximum. Figure 8F
shows the distribution of SRF types at
                                                                                          Our data reveal topographic organization of spectrotemporal
each percentage maximum level. At 90% maximum, 72% of the
                                                                                      modulation tuning in the STG derived from speech. A previous
SRFs were single peaked, 25% were double peaked, and 3% had
                                                                                      study examined modulation tuning in the human auditory cortex
three peaks. By 70% maximum, there are more multipeaked SRFs
                                                                                      using fMRI and spectrotemporal ripple stimuli (Schönwiesner and
than single-peaked SRFs (52% multipeaked versus 48% single
                                                                                      Zatorre, 2009). They observed cortical areas responsive to ripple
peaked). Last, we examined the overall distribution of BFs and
                                                                                      stimuli in primary and secondary auditory cortex within superior
found the majority of BFs are concentrated below 1000 Hz (Fig.
                                                                                      temporal plane, but did not find evidence of organized modula-
8G). This low-frequency tuning is consistent with previous work
                                                                                      tion tuning. Consistent with our study, individual spectrotempo-
characterizing tonotopic organization across the human auditory
                                                                                      ral ripple stimuli did not drive activity in the STG. Taken alone,
cortex in which the STG occupies a low-frequency reversal region
                                                                                      this may indicate organized spectrotemporal modulation pro-
between putative cochleotopic maps that span the planum tem-
                                                                                      cessing emerges in the STG. However, recent work has shown
porale, the STG, and the superior temporal sulcus (Striem-Amit
                                                                                      topographic organization of temporal modulation tuning alone
et al., 2011; Moerel et al., 2012). Collectively, these data show that
                                                                                      in the human primary auditory cortex using fMRI and amplitude
the STG has a substantial proportion of multipeaked spectral
                                                                                      modulated white noise stimuli (Herdener et al., 2013). Consis-
tuning, with low-to-moderate tonotopic organization within the
                                                                                      tent with this, Schönwiesner et al. (2009) endorse a tendency for
STG, and a high concentration of low BF frequencies consistent
                                                                                      temporal modulation tuning to increase from the medial Hes-
with its placement as a low-frequency region within larger-scale
                                                                                      chl’s gyrus (HG) to the lateral HG in a manner similar to that
cochleotopic maps (Striem-Amit et al., 2011; Moerel et al., 2012).
                                                                                      supported by data from Herdener et al. (2013). Additionally,
                                                                                      organized temporal modulation tuning has also been found in
Discussion                                                                            subcortical areas, such as the cat and the primate midbrain
In this study we used natural speech stimuli in conjunction with                      (Schreiner and Langner, 1988; Baumann et al., 2011). Organized
MID analysis and ECoG from human participants to investigate                          joint spectrotemporal modulation tuning has been characterized
the organization of spectrotemporal processing of speech in the                       in the cat inferior colliculus (Rodríguez et al., 2010) and the cat
human STG. Based on receptive field maps, we found tuning for                         auditory cortex (Atencio and Schreiner, 2012). Collectively, these
temporally fast sound with relatively constant energy across the                      studies provide evidence for organized spectrotemporal modula-
frequency axis (low spectral modulation) in the posterior STG                         tion tuning in various subcortical and cortical auditory areas and
and a transition to tuning for temporally slower sound with                           indicate that such processing may be a prevalent form of func-
higher variation in spectral energy across the frequency axis (high                   tional organization within the auditory system.
spectral modulation) in the anterior STG. Additionally, we found                          In contrast to robust activation of STG by speech stimuli,
that the STG shows BF tuning ⬍1000 Hz, which is consistent with                       our data with individual ripples (DMR stimulus) and TORCs
its placement as a low-frequency reversal region in larger-scale                      indicate that these stimuli do not robustly activate STG, which
cochleotopic maps (Striem-Amit et al., 2011; Moerel et al., 2012).                    is consistent with previous work (Schönwiesner and Zatorre,
These data expand our view of how the spectrotemporal process-                        2009). The two primary differences of speech from ripple
ing of speech in the STG is organized and demonstrate organized                       stimuli are acoustic complexity and behavioral relevance. Al-
tuning for different acoustic aspects of speech sounds along the                      though spectrotemporal modulations represent fundamental
human STG.                                                                            elements of complex sounds, such that a linear combination of
Hullett et al. • Organized Speech Modulation Tuning in Human STG J. Neurosci., February 10, 2016 • 36(6):2014 –2026 • 2023 Figure 8. Topography of spectral tuning. A, STRF-BF group map (color scale in B; only sites with data from ⱖ2 subjects are shown). The BF gradient runs in the anteroventral direction at ⫹193° counterclockwise from the 3 o’clock position. Neither group map shows significant local organization. (STRF-BF, p ⫽ 0.1; SRF-BF, p ⫽ 0.06; neighborhood similarity permutation test). B, Individual participant STRF-BF maps. Two of eight maps show significant local organization for both metrics (STRF-BF p/SRF-BF p: EC6, p ⫽ 0.12/0.23; GP31, p ⫽ 0.004/0.007; EC36, p ⫽ 0.10/0.04; EC28, p ⫽ 0.02/0.75; EC53, p ⫽ 0.29/0.13; EC58, p ⫽ 0.27/0.07; EC56, p ⫽ 0.39/0.20; EC2, p ⫽ 0.11/0.25; neighborhood similarity permutation test). C, STRF-BF as a function of distance. Absolute distance is from the edge of data after maps have been aligned by their dominant gradient (black). The red function represents the raw average of BFs as a function of distance along the STG from the anterior temporal pole (A, horizontal red line; no map alignment by gradient before averaging). D, Example SRF with the 50% maximum line (red). At 50% maximum, this SRF has four peaks. E, Average peak number as a function of percentage maximum. F, Distribution of neurons types, in terms of peak number, as a function of percentage maximum level. Color scale represents proportion of neurons. At 90% maximum, 72% of the SRFs are single peaked, 25% are double peaked, and 3% have three peaks. G, BF distribution. The concentration of BFs in the STG is ⬍1000 Hz, which is consistent with STG’s placement as a low-frequency region in larger-scale cochleotopic maps. LS, Lateral sulcus; STS, superior temporal sulcus; MTG, medial temporal gyrus; CS, central sulcus. these features can generate any segment of speech, speech is may be necessary to drive speech activation and may underlie more acoustically complex due to such features as increased selectivity seen in areas of the human auditory cortex (Overath temporal envelope variability from frequent onsets in words et al., 2015). Future work, akin to the analysis-by-synthesis or syllables, harmonic and formant structure, and formant approach by McDermott and Simoncelli (2011), may be able transitions. These additional acoustic characteristics of speech to determine which acoustic properties of sound are most
2024 • J. Neurosci., February 10, 2016 • 36(6):2014 –2026                                       Hullett et al. • Organized Speech Modulation Tuning in Human STG

important for activation of the STG. Our work shows that in            troughs in temporal tuning functions. Speech also spans the
the context of speech processing, the STG shows organized              range of temporal modulations of interest for speech process-
tuning for temporal and spectral modulation properties of              ing. Thus, an analysis using speech will not miss upper or
speech.                                                                lower ranges of tuning that may be missed using a predefined
    Acoustic properties may not be the only etiology of speech         and narrower range of temporal modulations.
selectivity in the STG. Along the auditory pathway, acoustic in-           Finally, differences in metrics used to characterize tempo-
formation is eventually transformed to semantic information,           ral tuning have led to variable characterizations of temporal
which confers behavioral relevance to the stimulus. Synthetic          tuning within the STG and other areas. Nonsynchronized
modulation stimuli lack semantic information and thus lack an          metrics of temporal tuning (mean activity as a function of
important component of speech stimuli that may be responsible          temporal modulation) and synchronized metrics of temporal
for activation of the STG. It is difficult to quantify the contribu-   tuning (vector strength and STRF-based MTFs) are in preva-
tion of acoustic versus semantic information for driving activity      lent use within the literature, but can show different tuning
in the STG in our dataset. The robust ability of STRFs to predict      properties (Eggermont, 2002; Zheng and Escabí, 2008). Con-
responses to novel speech stimuli relies on the acoustic content of    sistent with this, recent work in the STG has shown that a
sound alone. This suggests a significant component of the en-          nonsynchronized metric and a synchronized metric show low-
coded information represents acoustic rather than semantic in-         pass and bandpass tuning, respectively (Pasley et al., 2012). In
formation and is consistent with recent work in the superior           this study we characterized the synchronized component
temporal sulcus showing significant selectivity for speech based       of temporal tuning, the dominant form of temporal tuning for
on acoustic properties alone (Overath et al., 2015).                   the range of temporal modulations most important for speech
    The range of temporal tuning within the human auditory             perception (Elliott and Theunissen, 2009; Pasley et al., 2012),
cortex gives insight into the timescale of analysis being per-         and find a low-pass distribution of temporal tuning in the STG
formed. Fast temporal tuning reflects processing on the                most consistent with processing on prosodic and syllabic
phonemic timescale while slower temporal tuning reflects               timescales.
processing on syllabic or prosodic timescales. Currently there
is considerable variation in reported temporal tuning and              References
shape of the temporal MTF for both HG and the STG (HG,                 Atencio CA, Schreiner CE (2012) Spectrotemporal processing in spectral
range of average best temporal modulation: 1.5–10 Hz; STG,                tuning modules of cat primary auditory cortex. PloS One 7:e31537.
                                                                          CrossRef Medline
range of average best temporal modulation: 2– 8 Hz; Binder et
                                                                       Atencio CA, Sharpee TO, Schreiner CE (2008) Cooperative nonlinearities
al., 1994; Tanaka et al., 2000; Harms and Melcher, 2002;                  in auditory cortical neurons. Neuron 58:956 –966. CrossRef Medline
Langers et al., 2003; Liégeois-Chauvel et al., 2004; Rinne et al.,    Baumann S, Griffiths TD, Sun L, Petkov CI, Thiele A, Rees A (2011) Orthog-
2005; Schönwiesner and Zatorre, 2009; Overath et al., 2012;              onal representation of sound dimensions in the primate midbrain. Nat
Pasley et al., 2012; Wang et al., 2012; Gross et al., 2013). There        Neurosci 14:423– 425. CrossRef Medline
are a number of possible contributors to this variability.             Baumann S, Joly O, Rees A, Petkov CI, Sun L, Thiele A, Griffiths TD (2015)
                                                                          The topography of frequency and time representation in primate auditory
Within these studies, a wide range of stimuli have been used
                                                                          cortices. Elife 4. CrossRef Medline
to characterize temporal tuning, including sinusoidally                Binder JR, Rao SM, Hammeke TA, Frost JA, Bandettini PA, Hyde JS (1994)
amplitude-modulated (SAM) tones, SAM noise, moving spec-                  Effects of stimulus rate on signal response during functional magnetic
trotemporal ripples, tone pips, harmonic complexes, noise                 resonance imaging of auditory cortex. Brain Res Cogn Brain Res 2:31–38.
bursts, consonant–vowel pairs, and continuous speech. This                CrossRef Medline
variation is relevant because temporal tuning is not invariant         Binder JR, Frost JA, Hammeke TA, Bellgowan PS, Springer JA, Kaufman JN,
to stimulus type (Eggermont, 2002; Malone et al., 2007, 2013;             Possing ET (2000) Human temporal lobe activation by speech and non-
                                                                          speech sounds. Cereb Cortex 10:512–528. CrossRef Medline
Zheng and Escabí, 2008) and differences in temporal tuning in          Boatman D (2004) Cortical bases of speech perception: evidence from func-
the various studies may be partially attributable to the vast             tional lesion studies. Cognition 92:47– 65. CrossRef Medline
array of stimulus types used to characterize the system. In this       Boatman D, Hall C, Goldstein MH, Lesser R, Gordon B (1997) Neuroper-
study, we use speech stimuli to determine temporal tuning in              ceptual differences in consonant and vowel discrimination: as revealed by
the STG and thus characterize temporal processing relevant                direct cortical electrical interference. Cortex 33:83–98. CrossRef Medline
for speech processing in the STG.                                      Brenner N, Bialek W, de Ruyter van Steveninck R (2000) Adaptive rescaling
                                                                          maximizes information transmission. Neuron 26:695–702. CrossRef
    Variability in temporal tuning within the human auditory
                                                                          Medline
cortex may also be attributable to differences in the range and        Calabrese A, Schumacher JW, Schneider DM, Paninski L, Woolley SM
spacing of temporal modulation content used to characterize               (2011) A generalized linear model for estimating spectrotemporal recep-
the system (Edwards and Chang, 2013). The ideal stimulus set              tive fields from responses to natural sounds. PLoS One 6:e16104.
would extend from 0 Hz to temporal modulations well beyond                CrossRef Medline
the limits of the system and have resolution fine enough to            Carlson NL, Ming VL, Deweese MR (2012) Sparse codes for speech predict
                                                                          spectrotemporal receptive fields in the inferior colliculus. PLoS Comput
resolve peaks and troughs within the temporal MTF. However,
                                                                          Biol 8:e1002594. CrossRef Medline
variable resolution and differences in the upper and lower             Chang EF, Edwards E, Nagarajan SS, Fogelson N, Dalal SS, Canolty RT, Kirsch
limits of temporal modulations used to test temporal tuning               HE, Barbaro NM, Knight RT (2011) Cortical spatio-temporal dynamics
have led to variable interpretations of the shape of the tempo-           underlying phonological target detection in humans. J Cogn Neurosci
ral MTF (low pass vs bandpass) and average temporal tuning                23:1437–1446. CrossRef Medline
for HG and the STG (Edwards and Chang, 2013). In this study,           Crone NE, Boatman D, Gordon B, Hao L (2001) Induced electrocortico-
we used speech stimuli to define the temporal tuning relevant             graphic gamma activity during auditory perception. Brazier Award-
                                                                          winning article, 2001. Clin Neurophys 112:565–582. CrossRef Medline
for speech processing. Speech contains a continuous distribu-          Dan Y, Atick JJ, Reid RC (1996) Efficient coding of natural scenes in the
tion of temporal modulation content rather than discretely                lateral geniculate nucleus: experimental test of a computational theory.
spaced temporally modulated stimuli (ripples, amplitude-                  J Neurosci 16:3351–3362. Medline
modulated white noise, click trains) that may miss peaks and           David SV, Vinje WE, Gallant JL (2004) Natural stimulus statistics alter the
You can also read