Characterization of a Leptin Receptor Paralog and Its Response to Fasting in Rainbow Trout (Oncorhynchus mykiss) - MDPI

Page created by Jason Cross
 
CONTINUE READING
Characterization of a Leptin Receptor Paralog and Its Response to Fasting in Rainbow Trout (Oncorhynchus mykiss) - MDPI
International Journal of
               Molecular Sciences

Article
Characterization of a Leptin Receptor Paralog and Its Response
to Fasting in Rainbow Trout (Oncorhynchus mykiss)
Jamie L. Mankiewicz                   and Beth M. Cleveland *

                                           National Center for Cool and Cold Water Aquaculture, Agricultural Research Service, United States Department
                                           of Agriculture, Kearneysville, WV 25430, USA; jamie.mankiewicz@usda.gov
                                           * Correspondence: beth.cleveland@usda.gov

                                           Abstract: Leptin is a cytokine that regulates appetite and energy expenditure, where in fishes it is
                                           primarily produced in the liver and acts to mobilize carbohydrates. Most fishes have only one leptin
                                           receptor (LepR/LepRA1), however, paralogs have recently been documented in a few species. Here
                                           we reveal a second leptin receptor (LepRA2) in rainbow trout that is 77% similar to trout LepRA1.
                                           Phylogenetic analyses show a salmonid specific genome duplication event as the probable origin of
                                           the second LepR in trout. Tissues distributions showed tissue specific expression of these receptors,
                                           with lepra1 highest in the ovaries, nearly 50-fold higher than lepra2. Interestingly, lepra2 was most
                                           highly expressed in the liver while hepatic lepra1 levels were low. Feed deprivation elicited a decline
                                           in plasma leptin, an increase in hepatic lepra2 by one week and remained elevated at two weeks, while
                                           liver expression of lepra1 remained low. By contrast, muscle lepra1 mRNA increased at one and two
                                           weeks of fasting, while adipose lepra1 was concordantly lower in fasted fish. lepra2 transcript levels
                                 were not affected in muscle and fat. These data show lepra1 and lepra2 are differentially expressed
         
                                           across tissues and during feed deprivation, suggesting paralog- and tissue-specific functions for these
Citation: Mankiewicz, J.L.;                leptin receptors.
Cleveland, B.M. Characterization of a
Leptin Receptor Paralog and Its
                                           Keywords: leptin receptor; rainbow trout; duplicate; paralog; tissue distribution; fasting
Response to Fasting in Rainbow Trout
(Oncorhynchus mykiss). Int. J. Mol. Sci.
2021, 22, 7732. https://doi.org/
10.3390/ijms22147732
                                           1. Introduction
Academic Editors: Isabel Navarro                 The hormone leptin has been well characterized for its role in regulating appetite
and Daniel Garcia de la Serrana            as an anorexigen in vertebrates and it has also been implicated in many other processes
                                           including immunity, reproduction, energy homeostasis, and hydromineral balance (re-
Received: 21 June 2021                     viewed in [1–3]). Leptin is a 16 kDa class-I helical cytokine encoded by the obese (ob) gene
Accepted: 16 July 2021                     in mammals, where it acts as an adipostat and circulates in proportions relative to adipose
Published: 20 July 2021                    tissue and increases postprandially [4,5]. By contrast, in fishes and other ectotherms, leptin
                                           is primarily produced in the liver where it appears to focus on mobilizing carbohydrates
Publisher’s Note: MDPI stays neutral       instead of lipids [3]. Leptin expression is highly sensitive to glycemia in vivo (Mozambique
with regard to jurisdictional claims in    tilapia, [6]) and in vitro in hepatocytes (grass carp, [7]), further implicating the hormone
published maps and institutional affil-    in carbohydrate metabolism. There have been wide ranging responses of leptin to fasting
iations.                                   reported in fishes (reviewed in [8]) ranging from increases (rainbow trout, [9]; Mozambique
                                           tilapia, [10]), decreases (hybrid striped bass, [11]; red-bellied piranha, [12]), and no response
                                           of leptin to feed deprivation (goldfish, [13]). There are two distinct leptin proteins present
                                           in most fishes: leptin A (LepA) and leptin B (LepB), while salmonids and cyprinids have
Copyright: © 2021 by the authors.          four paralogs including two LepA’s (LepA1 and LepA2) and two LepB’s (LepB1 and LepB2)
Licensee MDPI, Basel, Switzerland.         (reviewed in [14]). However, some salmonids such as Arctic char (Salvelinus alpinus) and
This article is an open access article     rainbow trout (Oncorhynchus mykiss) appear to only have preserved the LepB1 variant [15].
distributed under the terms and            To date, most studies have focused on the dominant form, LepA, as mRNA levels can range
conditions of the Creative Commons         from 10–100 times higher than LepB [3,16].
Attribution (CC BY) license (https://
                                                 Leptin elicits its actions through a class-I cytokine receptor characterized by cys-
creativecommons.org/licenses/by/
                                           teine residues [17]. Leptin receptor (LepR) homodimerizes at the cell membrane which
4.0/).

Int. J. Mol. Sci. 2021, 22, 7732. https://doi.org/10.3390/ijms22147732                                           https://www.mdpi.com/journal/ijms
Characterization of a Leptin Receptor Paralog and Its Response to Fasting in Rainbow Trout (Oncorhynchus mykiss) - MDPI
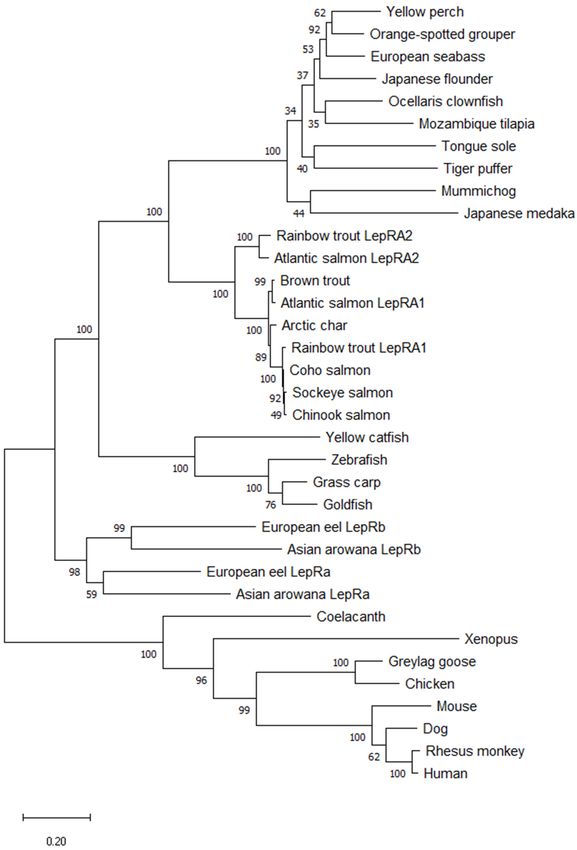
Int. J. Mol. Sci. 2021, 22, 7732                                                                                           2 of 16

                                   transduces into intracellular signaling controlled through a highly conserved JAK/STAT
                                   pathway [18–22]. There are numerous splice variants of LepR that have been identified in
                                   mammals which have been categorized as short, long, and secreted forms [17]. Versions of
                                   alternatively spliced leptin receptors have been characterized in some teleost fish includ-
                                   ing crucian carp (Carassius carassius; [23]), European sea bass (Dicentrarchus labrax; [24]),
                                   Atlantic salmon (Salmo salar; [25]), and rainbow trout (O. mykiss; [26]), where similar to
                                   mammals the long form is the full functional LepR. Furthermore, three short form LepR
                                   variants that act as binding proteins and are comprised of only the extracellular segment
                                   were identified in rainbow trout [26]. Interestingly, all of the alternatively spliced LepR
                                   variants had different tissue expression patterns and were regulated by the physiological
                                   state of the fish [26]. As with leptin, most teleost LepRs share a low level of amino acid
                                   sequence identity with that of the mammalian LepR, although there remains high conser-
                                   vation in tertiary structure and ligand binding [27]. The leptin receptor is ubiquitously
                                   expressed across tissues, however, high abundances have been reported in gonadal tissue
                                   and the brain, specifically the hypothalamus and pituitary, further linking this region to
                                   leptin control of food intake [3].
                                        About 350 million years ago, there was a 3R genome duplication event which was
                                   the cause of a whole genome duplication specific to teleost fish [28]. This event was the
                                   likely source of the leptin B paralog appearing in fishes [15,16]. Interestingly, in nearly
                                   all vertebrates there has only been a single leptin receptor identified, including for most
                                   teleost fish where many genes have second copies and produce functional proteins from
                                   duplication [28,29]. However, recently a second leptin receptor has been identified in a few
                                   species of fish: the Asian arowana (LepRa/LepRb, Scleropages formosus; reviewed in [16]),
                                   two species of eel (LepRa/LepRb, European eel, Anguilla anguilla and Japanese eel, Anguilla
                                   japonica; [29]), and Atlantic salmon (LepRA1/LepRA2, S. salar; [30]). It is unclear if the
                                   duplicated eel and arowana LepRs were present in teleost ancestors and then lost, but it
                                   appears to be from an ancient duplication event [16,29]. By contrast, more recently there
                                   was a 4R salmonid specific genome duplication event that has been dated to only 25 to
                                   100 million years ago and is likely the reason for the duplicated LepA and LepB variants
                                   in some salmonids and for the presence of a second receptor in Atlantic salmon [30,31].
                                   In rainbow trout, the functional long-form leptin receptor has been characterized (LepRL,
                                   and herein to distinguish between paralogs we use the same nomenclature as Atlantic
                                   salmon, LepRA1) [26,30,32]. With the aid of the rainbow trout genome (GenBank accession
                                   # GCA_013265735.3) and the sequence for LepRA2 from the closely related Atlantic salmon,
                                   we have also identified a second leptin receptor in O. mykiss (LepRA2).
                                        As studies on leptin in ectothermic vertebrates advance, it is apparent that leptin plays
                                   a key role in metabolism and energy balance. It is important to understand the function of
                                   leptin and its receptors, especially in fishes where feeding behaviors and energy reserves
                                   can differ considerably from mammals. Rainbow trout is a high value aquaculture species
                                   and well-established as a genetic and physiological model. Here we characterize a LepRA2
                                   paralog in rainbow trout by performing evolutionary analyses and tissue distributions of
                                   the receptors. We hypothesized that the two leptin receptors identified in rainbow trout
                                   may have divergent functions and may be differentially expressed under altered metabolic
                                   conditions where leptin may be regulated, such as a fasted or stressed state. To elucidate the
                                   roles of both leptin receptors under catabolic conditions we exposed the fish to a two-week
                                   period of feed deprivation.

                                   2. Results
                                   2.1. Phylogenetic Analyses and Sequence Alignments
                                        The BLAST analyses using the lepra1 and lepra2 nucleotide sequences from Atlantic
                                   salmon (S. salar, [30]; AB489201 and JX131307, respectively) revealed six predicted leptin
                                   receptor-like sequences in other salmonids of high similarity. The receptors show 95–99%
                                   sequence identity to S. salar lepra2 and 85–87% to the lepra1 paralog of that species; rainbow
                                   trout (O. mykiss; JX878485 and XM_021599667), Arctic char (S. alpinus; XM_024004689 and
Characterization of a Leptin Receptor Paralog and Its Response to Fasting in Rainbow Trout (Oncorhynchus mykiss) - MDPI
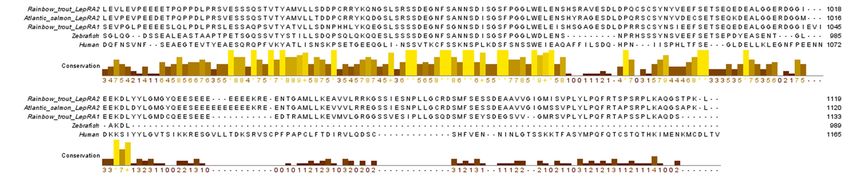
Int. J. Mol. Sci. 2021, 22, x FOR PEER REVIEW                                                                                                       3 of 16

Int. J. Mol. Sci. 2021, 22, 7732     receptor-like sequences in other salmonids of high similarity. The receptors show 95–99%
                                                                                                                          3 of 16
                                     sequence identity to S. salar lepra2 and 85–87% to the lepra1 paralog of that species; rain-
                                     bow trout (O. mykiss; JX878485 and XM_021599667), Arctic char (S. alpinus; XM_024004689
                                     and XM_023998093), coho salmon (Oncorhynchus kisutch; XM_020499516 and
                                    XM_023998093), coho salmon (Oncorhynchus kisutch; XM_020499516 and XM_020492942),
                                     XM_020492942), sockeye salmon (Oncorhynchus nerka; XM_029648230 and
                                    sockeye salmon (Oncorhynchus nerka; XM_029648230 and XM_029686846), chinook salmon
                                     XM_029686846), chinook salmon (Oncorhynchus tshawytscha; XM_024403083 and
                                    (Oncorhynchus tshawytscha; XM_024403083 and XM_024420936), and brown trout (Salmo
                                     XM_024420936), and brown trout (Salmo trutta; XM_029707951 and XM_029750518).
                                    trutta; XM_029707951 and XM_029750518). When phylogenetic analyses were performed
                                     When phylogenetic analyses were performed on the 14 salmonid leptin receptor nucleo-
                                    on the 14 salmonid leptin receptor nucleotide sequences, two distinct clades were formed,
                                     tide sequences, two distinct clades were formed, which were then identified for each lepr
                                    which were then identified for each lepr paralog (Figure 1).
                                     paralog (Figure 1).

                                     Figure1.1.Evolutionary
                                    Figure      Evolutionaryanalysis
                                                               analysis
                                                                      of of salmonid
                                                                         salmonid      leptin
                                                                                   leptin     receptor
                                                                                          receptor     nucleotide
                                                                                                   nucleotide        sequences
                                                                                                                sequences  usingusing   the Maxi-
                                                                                                                                  the Maximum
                                     mum Likelihood
                                    Likelihood   method.method.   The bootstrap
                                                            The bootstrap       values
                                                                            values       at nodes
                                                                                    at nodes  werewere  based
                                                                                                    based   on on  1000
                                                                                                                1000    replicates.This
                                                                                                                      replicates.   Thisanalysis
                                                                                                                                          analysis
                                     involved14
                                    involved    14nucleotide
                                                   nucleotidesequences.
                                                               sequences.GenBank
                                                                            GenBankaccession
                                                                                       accession#’s
                                                                                                 #’sare
                                                                                                     areininparenthesis.
                                                                                                             parenthesis.There
                                                                                                                           Therewere
                                                                                                                                  wereaatotal
                                                                                                                                           totalofof
                                     3540  positions in the final dataset. Branch lengths   were measured    in the number   of substitutions
                                    3540 positions in the final dataset. Branch lengths were measured in the number of substitutions per       per
                                     site. Evolutionary analyses were conducted in MEGA X.
                                    site. Evolutionary analyses were conducted in MEGA X.

                                           The amino
                                          The    amino acid acid sequences
                                                                    sequences for    for the
                                                                                           the duplicated
                                                                                                duplicated LepR
                                                                                                              LepR in   in Atlantic
                                                                                                                           Atlantic salmon
                                                                                                                                        salmon (S. (S. salar:
                                                                                                                                                        salar:
                                     BAI23197        and      NP_001315080),             rainbow       trout   (O.     mykiss:
                                    BAI23197 and NP_001315080), rainbow trout (O. mykiss: XP_021460283 and XP_021455342),         XP_021460283            and
                                     XP_021455342),        Asian     arowana      (S.  formosus:    XP_018609810
                                    Asian arowana (S. formosus: XP_018609810 and KPP63040), European eel (A. Anguilla: and  KPP63040),       European      eel
                                     (A. Anguilla:    CEE15397        and   CEE15398,       [29]), were   analyzed     along
                                    CEE15397 and CEE15398, [29]), were analyzed along with 27 other LepR protein sequences    with   27   other  LepR    pro-
                                     tein sequences
                                    including    5 salmonidsincluding
                                                                    (Arctic5char:salmonids        (Arctic coho
                                                                                       XP_023860456,        char:salmon:
                                                                                                                     XP_023860456,
                                                                                                                             XP_020355105,  coho sockeye
                                                                                                                                                    salmon:
                                     XP_020355105,
                                    salmon:                sockeye
                                               XP_029504090,             salmon:
                                                                     chinook          XP_029504090,
                                                                                salmon:      XP_024258849, chinook
                                                                                                               and brownsalmon:    XP_024258849,
                                                                                                                              trout:  XP_029563811),      and
                                                                                                                                                            a
                                     brown
                                    range      trout:
                                            of 15        XP_029563811),
                                                   additional                    a range
                                                                  species of fishes            of 15 AAY16198,
                                                                                          (zebrafish:   additional Japanese
                                                                                                                       species of      fishes BAH24203,
                                                                                                                                  medaka:       (zebrafish:
                                     AAY16198, Japanese
                                    Mozambique                     medaka: BAH24203,
                                                      tilapia: AGT28753,                         Mozambique
                                                                                clown anemonefish:                 tilapia: AGT28753,
                                                                                                            XP_023146279,      tiger puffer: clown    anem-
                                                                                                                                                BAG67079,
                                     onefish: XP_023146279,
                                    mummichog:                         tiger puffer: BAG67079,
                                                       JAR68227, orange-spotted                          mummichog:
                                                                                             grouper: AFU55262,            JAR68227,
                                                                                                                       European            orange-spotted
                                                                                                                                    seabass:    AIB06819,
                                     grouper:
                                    yellow       AFU55262,
                                             perch:                European
                                                       XP_028442652,        yellowseabass:     AIB06819,
                                                                                        catfish: AFO67946,   yellow
                                                                                                               grassperch:      XP_028442652, yellow
                                                                                                                        carp: AFU35431,tongue           sole:
                                     catfish: AFO67946,
                                    ARX70259,       Japanese grass
                                                                 flounder: carp:XP_019953845,
                                                                                    AFU35431,tongue          sole: XP_026120678,
                                                                                                       goldfish:     ARX70259, Japanese           flounder:
                                                                                                                                         and coelacanth:
                                     XP_019953845, and
                                    XP_006009523),        goldfish:      XP_026120678,
                                                                7 tetrapods      represented  andby coelacanth:
                                                                                                       amphibian,  XP_006009523),
                                                                                                                      mammals, andand          7 tetrapods
                                                                                                                                           birds  (clawed
                                     represented
                                    frog:             by amphibian,
                                           XP_018116241,         chicken:mammals,
                                                                              BAA94292,and          birdsgoose:
                                                                                                greylag    (clawed     frog: XP_018116241,
                                                                                                                    AEE61372,     mouse: AAC52705,  chicken:
                                    dog:  NP_001019805,
                                     BAA94292,       greylag rhesus
                                                                 goose:monkey:
                                                                            AEE61372,    NP_001027991,       and human:
                                                                                              mouse: AAC52705,           dog:AAA93015).
                                                                                                                               NP_001019805,   The phylo-
                                                                                                                                                     rhesus
                                    genetic
                                     monkey: treeNP_001027991,
                                                   generated using         these
                                                                         and  human:35 sequences
                                                                                           AAA93015). exhibits
                                                                                                           Theinitial    branching
                                                                                                                phylogenetic      treeforgenerated
                                                                                                                                           tetrapodsusing
                                                                                                                                                        and
                                    teleosts,  with    coelacanth       LepR   showing       closer  relation  to  tetrapods.
                                     these 35 sequences exhibits initial branching for tetrapods and teleosts, with coelacanth   The    teleost  node    has
                                    branching
                                     LepR showing for more     ancient
                                                          closer           fishes
                                                                    relation         (eel and arowana)
                                                                               to tetrapods.                 andnode
                                                                                                   The teleost     the rest
                                                                                                                          hasof the teleosts
                                                                                                                              branching       forsplit
                                                                                                                                                  moreinto an-
                                    different   multiple
                                     cient fishes    (eel andclades;     for cyprinids
                                                                   arowana)       and theand      catfish,
                                                                                               rest  of thefor  more highly
                                                                                                             teleosts            derived
                                                                                                                         split into          teleosts
                                                                                                                                     different          (i.e.,
                                                                                                                                                   multiple
                                    pufferfish,
                                     clades; fortilapia,
                                                   cyprinids etc.),and
                                                                     andcatfish,
                                                                           for salmonids
                                                                                    for more(Figure
                                                                                                 highly2).   Whereteleosts
                                                                                                          derived     present,(i.e.,
                                                                                                                                 the pufferfish,
                                                                                                                                      duplicated tilapia,
                                                                                                                                                     leptin
                                    receptor
                                     etc.), andparalogs     cluster together
                                                 for salmonids         (Figure 2). in Where
                                                                                       their respective    clades.
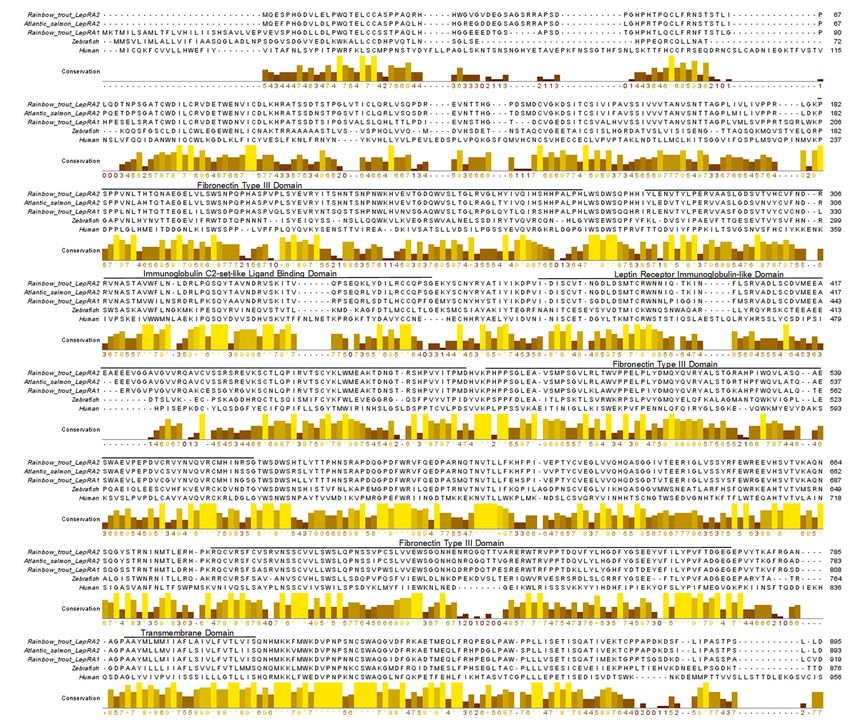
                                                                                                present, the         The amino
                                                                                                               duplicated         acid
                                                                                                                              leptin      sequence
                                                                                                                                       receptor       align-
                                                                                                                                                   paralogs
                                    ment of rainbow trout LepRA1 and LepRA2 shows high conservation between paralogs
                                    and with Atlantic salmon LepRA2 (Figure 3). Rainbow trout LepRA1 and LepRA2 paralogs
                                    share a 77.1% amino acid sequence identity, while trout LepRA2 is 92.8% similar to Atlantic
                                    salmon LepRA2. Primary sequence conservation with human LepR are low for both par-
Characterization of a Leptin Receptor Paralog and Its Response to Fasting in Rainbow Trout (Oncorhynchus mykiss) - MDPI
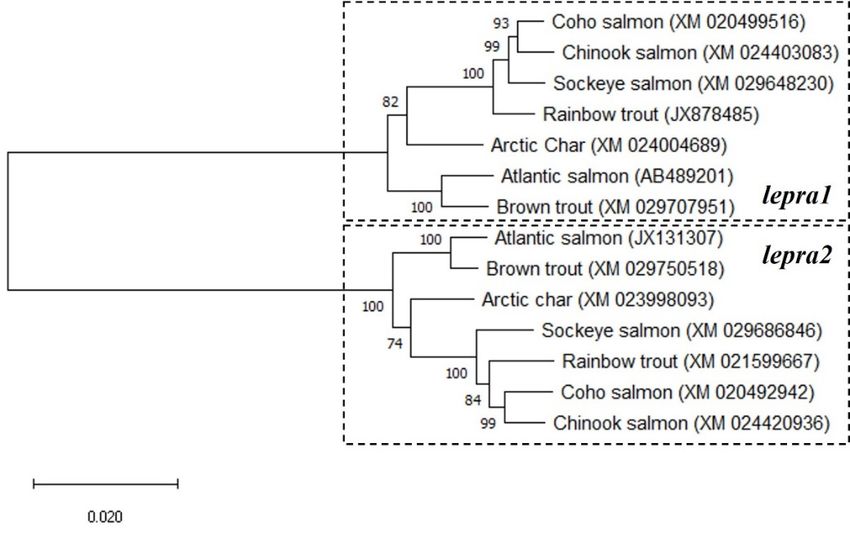
cluster together in their respective clades. The amino acid sequence alignment of rainbow
                                    trout LepRA1 and LepRA2 shows high conservation between paralogs and with Atlantic
Int. J. Mol. Sci. 2021, 22, 7732                                                                                               4 of 16
                                    salmon LepRA2 (Figure 3). Rainbow trout LepRA1 and LepRA2 paralogs share a 77.1%
                                    amino acid sequence identity, while trout LepRA2 is 92.8% similar to Atlantic salmon
                                    LepRA2. Primary sequence conservation with human LepR are low for both paralogs at
                                    30.8%atand
                                   alogs        32.2%
                                            30.8%  andfor  trout
                                                        32.2%  forLepRA1  and LepRA2,
                                                                   trout LepRA1           respectively.
                                                                                  and LepRA2,           However,
                                                                                                 respectively.      predicted
                                                                                                               However,        recep-
                                                                                                                          predicted
                                    tor domains
                                   receptor  domainsremain
                                                       remainconserved
                                                                conserved(Leptin
                                                                           (LeptinReceptor:
                                                                                    Receptor: IPR015752).    Extracellular domains
                                                                                               IPR015752). Extracellular    domains
                                    (aminoacids
                                   (amino    acids1–788)
                                                   1–788)include
                                                           include33fibronectin
                                                                      fibronectintype
                                                                                   type33domains
                                                                                           domains(IPR003961;
                                                                                                     (IPR003961;182-266,
                                                                                                                   182-266,484-566,
                                                                                                                             484-566,
                                   683-773),
                                    683-773),one
                                               oneimmunoglobulin
                                                    immunoglobulinC2-set-like
                                                                       C2-set-likeligand-binding
                                                                                    ligand-bindingdomain
                                                                                                     domain(IPR010457;
                                                                                                              (IPR010457;284-357),
                                                                                                                            284-357),
                                   and
                                    andone
                                         oneLepR
                                               LepRimmunoglobulin-like
                                                     immunoglobulin-likedomain
                                                                             domain(IPR041182;
                                                                                       (IPR041182;376-480).
                                                                                                    376-480).The
                                                                                                               Thetransmembrane
                                                                                                                    transmembrane
                                   domain
                                    domainspans
                                              spansamino
                                                     aminoacids
                                                             acids789-811,
                                                                   789-811,while
                                                                             whilethe
                                                                                    thecytoplasmic,
                                                                                         cytoplasmic,intracellular
                                                                                                       intracellulardomain
                                                                                                                     domainranges
                                                                                                                              ranges
                                   from
                                    fromamino
                                          aminoacids
                                                  acids812-1119.
                                                        812-1119.

                                    Figure2.2.Evolutionary
                                   Figure      Evolutionaryanalysis
                                                            analysisof
                                                                     ofleptin
                                                                        leptinreceptor
                                                                               receptoramino
                                                                                        aminoacid
                                                                                              acidsequences
                                                                                                   sequencesusing
                                                                                                               usingthe
                                                                                                                     theMaximum
                                                                                                                         MaximumLikeli-
                                                                                                                                     Likeli-
                                    hood method.   The  bootstrap values at nodes  were based on 1000 replicates. This analysis involved
                                   hood method. The bootstrap values at nodes were based on 1000 replicates. This analysis involved      35
                                    amino acid sequences. There were a total of 1448 positions in the final dataset. Branch lengths were
                                   35 amino acid sequences. There were a total of 1448 positions in the final dataset. Branch lengths
                                    measured in the number of substitutions per site. Evolutionary analyses were conducted in MEGA X.
                                   were measured in the number of substitutions per site. Evolutionary analyses were conducted in
                                   MEGA X.
Int.J.J.Mol.
Int.      Mol.Sci.
               Sci.2021,  22,x 7732
                    2021,22,   FOR PEER REVIEW                                                                                     5 5ofof16
                                                                                                                                           16

      Figure
       Figure 3.3. Amino
                    Aminoacid
                          acidsequence
                                sequencealignment
                                           alignmentofofleptin
                                                          leptinreceptors
                                                                 receptorsfrom
                                                                            fromrainbow
                                                                                  rainbowtrout
                                                                                            trout(Oncorhynchus
                                                                                                  (Oncorhynchusmykiss,
                                                                                                                   mykiss, LepRA1:
                                                                                                                            LepRA1:
      XP_021460283;
       XP_021460283; LepRA2: XP_021455342), Atlantic salmon (Salmo salar, LepRA2: NP_001315080), zebrafish(Danio
                      LepRA2:  XP_021455342),   Atlantic  salmon   (Salmo salar, LepRA2:  NP_001315080),     zebrafish   (Daniorerio,
                                                                                                                                rerio,
      AAY16198),
       AAY16198), and
                    and human  (Homo sapiens,
                        human (Homo   sapiens, AAA93015).
                                               AAA93015).Predicted
                                                            Predictedconserved
                                                                       conservedfunctional
                                                                                   functionaldomains
                                                                                              domainsforfor rainbow
                                                                                                          rainbow     trout
                                                                                                                   trout    LepRA2
                                                                                                                         LepRA2   are
      are labeled and indicated by black lines spanning the domain. The boxes below the sequence indicate areas of conserva-
       labeled and indicated by black lines spanning the domain. The boxes below the sequence indicate areas of conservation.
      tion. High conservation between sequences shows brighter color and higher score values, while low conservation is indi-
       High conservation between sequences shows brighter color and higher score values, while low conservation is indicated
      cated with progressively darker color and decreased values.
       with progressively darker color and decreased values.
                                     2.2. Tissue Distribution
                                      2.2. Tissue Distribution
                                           Abundance of mRNA levels of lepra1, lepra2, lepa1, and lepa2 were analyzed across a
                                     varietyAbundance    of mRNA
                                              of tissues by  quantitative  of lepra1, PCR
                                                                    levelsreal-time   lepra2, lepa1, and
                                                                                           (qPCR).       lepa2
                                                                                                      Both     were analyzed
                                                                                                           receptors         across a
                                                                                                                     were expressed
                                      variety  of tissues by  quantitative real-time   PCR  (qPCR).    Both receptors were
                                     across all tissues analyzed, however, there were some marked differences (Figure 4A). expressed
                                      across all tissues analyzed, however, there were some marked differences (Figure 4A).
Int. J. Mol. Sci. 2021, 22, 7732                                                                                                                    6 of 16
Int. J. Mol. Sci. 2021, 22, x FOR PEER REVIEW                                                                                                      6 of 16

     Figure
     Figure 4. 4. mRNA
                  mRNA tissuetissuedistribution
                                     distributionofof(A)
                                                       (A)two
                                                            two leptin
                                                              leptin   receptors,
                                                                     receptors,    lepra1
                                                                                lepra1 andand   lepra2,
                                                                                           lepra2,  andandtwo two   leptins
                                                                                                               leptins      (B) lepa1
                                                                                                                       (B) lepa1       and lepa2,
                                                                                                                                 and lepa2,        in
                                                                                                                                             in adult
     adult   female    rainbow     trout. Expression    levels  were  determined    by qPCR    amplification     in the  brain
     female rainbow trout. Expression levels were determined by qPCR amplification in the brain (BR), distal kidney (DK), fat  (BR),  distal  kidney
     (DK),
     (F), gillfat (F),heart
               (G),     gill (H),
                             (G), head
                                  heartkidney
                                         (H), head
                                                (HK), kidney  (HK), hypothalamus
                                                        hypothalamus                  (HY),
                                                                        (HY), liver (L),     liver
                                                                                         ovary   (O),(L), ovary (O),
                                                                                                       pituitary      pituitary
                                                                                                                 (P), pyloric    (P),(PC),
                                                                                                                              caeca   pyloric   caeca
                                                                                                                                           posterior
     (PC), posterior intestine (PI), red muscle (RM), spleen (SP), stomach (ST), and white muscle (WM). ND = levels not de-
     intestine (PI), red muscle (RM), spleen (SP), stomach (ST), and white muscle (WM). ND = levels not detected. Values were
     tected. Values were normalized to the total nanograms of RNA used in cDNA synthesis and are expressed as the mean ±
     normalized to the total nanograms of RNA used in cDNA synthesis and are expressed as the mean ± SEM (n = 5).
     SEM (n = 5).
                                            lepra1 was most highly expressed in the ovaries, at over 50× higher than lepra2. lepra1
                                            lepra1 was most highly expressed in the ovaries, at over 50× higher than lepra2. lepra1
                                     was expressed near 5× higher levels in the stomach and white muscle compared to lepra2.
                                     was expressed near 5× higher levels in the stomach and white muscle compared to lepra2.
                                     Interestingly, hepatic lepra1 levels were low while lepra2 was at levels over 17× higher.
                                     Interestingly, hepatic lepra1 levels were low while lepra2 was at levels over 17× higher.
                                     lepa1 mRNA expression was highest in the liver with some lower levels in the brain, fat,
                                     lepa1   mRNA expression was highest in the liver with some lower levels in the brain, fat,
                                     gills, heart, hypothalamus, ovaries, pituitary, muscle, and no detectable expression in other
                                     gills,
                                     tissuesheart,   hypothalamus,
                                                examined.             ovaries,
                                                            Likewise, lepa2 hadpituitary,
                                                                                 the highestmuscle,
                                                                                             levels inand
                                                                                                       theno   detectable
                                                                                                           liver with low expression   in
                                                                                                                          levels in most
                                     other    tissues examined.   Likewise,  lepa2 had  the highest  levels in the liver
                                     other tissues except fat and ovaries where transcript abundance was 2× and 7× higherwith low  levels
                                     in most
                                     than        other
                                             lepa1     tissues
                                                   (Figure  4B).except fat and ovaries where transcript abundance was 2× and 7×
                                     higher than lepa1 (Figure 4B).
                                     2.3. Physiological Response to Feed Deprivation
                                     2.3. Physiological
                                            There were Response    to Feedchanges
                                                           no significant  Deprivation
                                                                                    observed between fed and fasted fish after one
                                      day There
                                            of feedwere    no significant
                                                       deprivation      (Figurechanges    observedtrout
                                                                                   5). Rainbow          between
                                                                                                              thatfed    andexposed
                                                                                                                      were     fasted fish
                                                                                                                                         to after one day
                                                                                                                                            one week     of
                                     of  feed
                                      feed     deprivation
                                            deprivation      had(Figure    5). Rainbow
                                                                    significantly    lowertrout
                                                                                              bodythat    wererelative
                                                                                                      weight      exposedtotofed one  week of(Figure
                                                                                                                                    controls    feed dep-
                                                                                                                                                        5A;
                                     rivation
                                      p = 0.001;had
                                                  fed:significantly
                                                         56.31 ± 3.88lower        body 45.17
                                                                          g, fasted:     weight ± relative
                                                                                                    2.74 g), toin fed  controls
                                                                                                                   addition       (Figurehepatosomatic
                                                                                                                               to lower     5A; p = 0.001;
                                     fed:
                                      index56.31
                                             (HSI,± 3.88
                                                     Figureg, fasted:
                                                               5C; p < 45.17
                                                                          0.001;±fed:     g), in±addition
                                                                                    2.74 2.34                 to lower
                                                                                                   0.10%, fasted:            ± 0.09%), viscerosomatic
                                                                                                                       1.04hepatosomatic      index (HSI,
                                     Figure   5C; pFigure
                                      index (VSI,      < 0.001;
                                                              5D;fed:p
Int. J. Mol. Sci. 2021, 22, 7732                                                                                                                   7 of 16
 Int. J. Mol. Sci. 2021, 22, x FOR PEER REVIEW                                                                                                     7 of 16

                                     Figure 5.
                                    Figure   5. Rainbow
                                                 Rainbow trout
                                                            trout were
                                                                  were feed
                                                                       feed deprived
                                                                              deprived for
                                                                                       for 14
                                                                                           14 days
                                                                                               days and
                                                                                                    and compared
                                                                                                         compared to
                                                                                                                   to fed
                                                                                                                       fed controls.
                                                                                                                            controls. (A)
                                                                                                                                      (A) body
                                                                                                                                          body
                                     weight   (g), (B) fork length (cm),  (C) blood glucose (mg/dl),  (D) hepatosomatic   index
                                    weight (g), (B) fork length (cm), (C) blood glucose (mg/dL), (D) hepatosomatic index (HSI),  (HSI), (E) vis-
                                     erosomatic index (VSI), and (F) plasma leptin (ng/mL). Values reported as means ± SEM. # denote
                                    (E) viserosomatic index (VSI), and (F) plasma leptin (ng/mL). Values reported as means ± SEM. #
                                     significant differences from time 0 within each treatment. * denote significant differences between
                                    denote significant differences from time 0 within each treatment. * denote significant differences
                                     treatments within each time point. (n = 9–12, except weight and length n = 16–84; * p ≤ 0.02, ** p ≤
                                    between     p ≤ 0.001). within each time point. (n = 9–12, except weight and length n = 16–84; * p ≤ 0.02,
                                     0.005, ***treatments
                                    ** p ≤ 0.005, *** p ≤ 0.001).
                                     2.4. Response of Leptin and Leptin Receptor Expression to Feed Deprivation
                                    2.4. Response of Leptin and Leptin Receptor Expression to Feed Deprivation
                                           White muscle,
                                          White     muscle, liver,
                                                               liver, and
                                                                       and fat
                                                                             fat tissues
                                                                                   tissues were
                                                                                            were analyzed
                                                                                                    analyzed for  for mRNA
                                                                                                                       mRNA levelslevels of of lepra1
                                                                                                                                                lepra1 and
                                                                                                                                                        and
                                     lepra2 in  response    to  fasting  (Figure     6). No  changes     were   detected
                                    lepra2 in response to fasting (Figure 6). No changes were detected in any tissue within in  any   tissue   within   one
                                     day  of  feed  deprivation.      Muscle     lepra1   mRNA     levels    increased
                                    one day of feed deprivation. Muscle lepra1 mRNA levels increased significantly with   significantly      with   fasting
                                     at one week
                                    fasting   at one(pweek
                                                         < 0.001;
                                                                (p
Int. J. Mol. Sci. 2021, 22, 7732                                                                                                                        8 of 16
Int. J. Mol. Sci. 2021, 22, x FOR PEER REVIEW                                                                                                          8 of 16

     Figure 6. Rainbow trout were feed deprived for 14 days and compared to fed controls. mRNA                mRNA levels
                                                                                                                       levels of
                                                                                                                               of lepra1
                                                                                                                                   lepra1 in
                                                                                                                                           in (A)
                                                                                                                                               (A) liver,
                                                                                                                                                    liver,
     (B) white
     (B) white muscle,
               muscle, (C)
                        (C)fat,
                            fat,and
                                 andlevels
                                     levelsofoflepra2
                                                lepra2inin(D)
                                                           (D)liver,
                                                                liver,(E)
                                                                        (E)white
                                                                            whitemuscle,
                                                                                     muscle,(F)(F) fat,
                                                                                                 fat,   and
                                                                                                      and   lepa1
                                                                                                          lepa1 in in (G)
                                                                                                                    (G)    liver,
                                                                                                                        liver, werewere  determined
                                                                                                                                      determined       by
     by qPCR.
     qPCR.     Values
            Values werewere  normalized
                         normalized        to total
                                       to the the total   nanograms
                                                    nanograms      of RNAof RNA
                                                                              usedused    in cDNA
                                                                                     in cDNA           synthesis
                                                                                                 synthesis   and and   are expressed
                                                                                                                  are expressed          asmean
                                                                                                                                    as the   the meanfold
     fold change
     change  fromfrom  the baseline
                  the baseline        at0T±= SEM
                                 at T =      0 ± SEM
                                                   (n =(n   = 9–12,
                                                          9–12,  *p≤ * p0.04,
                                                                          ≤ 0.04,
                                                                               *** ***
                                                                                    p ≤p 0.001).
                                                                                         ≤ 0.001).   # denote
                                                                                                  # denote     significant
                                                                                                             significant     differences
                                                                                                                          differences       from
                                                                                                                                         from       time
                                                                                                                                                 time   0
     0 within each treatment. * denote significant differences between treatments within each time point.
     within each treatment. * denote significant differences between treatments within each time point.

                                      3. Discussion
                                      3. Discussion
                                           These studies have identified a duplicated leptin receptor, LepRA2, in rainbow trout
                                            These studies have identified a duplicated leptin receptor, LepRA2, in rainbow trout
                                      and investigated the physiological responses of both leptin receptor paralogs to feed dep-
                                      and investigated the physiological responses of both leptin receptor paralogs to feed
                                      rivation. In those vertebrates where a leptin receptor has been characterized, virtually all
                                      deprivation. In those vertebrates where a leptin receptor has been characterized, virtually
                                      have only a single leptin receptor, including most teleost fishes where many genes have
                                      all have only a single leptin receptor, including most teleost fishes where many genes have
                                      second copies due to genome duplication [16,28,29]. The LepRA2 paralog appears in the
                                      second copies due to genome duplication [16,28,29]. The LepRA2 paralog appears in the
                                      six other species of salmonids examined and they share a nucleotide sequence identity of
                                      six other species of salmonids examined and they share a nucleotide sequence identity of
                                      95–99% to that of Atlantic salmon LepRA2. There is greater divergence between paralogs
                                      95–99% to that of Atlantic salmon LepRA2. There is greater divergence between paralogs
                                      as rainbow trout LepRA1 and LepRA2 amino acid sequences have 77.1% similarity. The
                                      as rainbow trout LepRA1 and LepRA2 amino acid sequences have 77.1% similarity. The
                                      primary
                                      primary sequence
                                                  sequence conservation
                                                              conservation withwith human
                                                                                       human LepRLepR is is low
                                                                                                            low for   both paralogs
                                                                                                                  for both    paralogs at   at 30.8%
                                                                                                                                               30.8% and
                                                                                                                                                       and
                                      32.2%   for   trout LepRA1      and   LepRA2,      respectively,     however     the
                                      32.2% for trout LepRA1 and LepRA2, respectively, however the predicted receptor domainspredicted      receptor    do-
                                      mains   appear    to  be highly   conserved.      The  phylogenetic       analyses
                                      appear to be highly conserved. The phylogenetic analyses completed with the nucleotidecompleted       with  the  nu-
                                      cleotide
                                      sequences  sequences
                                                     show two  show    two clades
                                                                  distinct   distinctformed
                                                                                        clades forformed
                                                                                                      eachfor     eachleptin
                                                                                                              of the     of thereceptor
                                                                                                                                   leptin receptor
                                                                                                                                             paralogspa- in
                                      ralogs   in  salmonids.   Similarly,    comparisons       of  amino    acid
                                      salmonids. Similarly, comparisons of amino acid sequences of leptin receptors sequences       of leptin   receptors
                                                                                                                                                     show
                                      show
                                      that thethat   the salmonid
                                                 salmonid     LepRA2  LepRA2
                                                                          paralogs paralogs
                                                                                       group group       separately
                                                                                                separately     from all from
                                                                                                                          LepRA1 all LepRA1
                                                                                                                                        and theand LepRbthe
                                      LepRb    paralogs    of eel and   arowana,     suggesting     the  appearance      of LepRA2
                                      paralogs of eel and arowana, suggesting the appearance of LepRA2 is likely due to the 4R           is likely due   to
                                      the 4R  salmonid     specific  genome     duplication     event   [30,31].   Synteny
                                      salmonid specific genome duplication event [30,31]. Synteny analyses from another study analyses     from   another
                                      study
                                      proposedproposed
                                                    the eelthe eel LepRb
                                                            LepRb           was resultant
                                                                     was resultant      from from     the teleost
                                                                                               the teleost          3R genome
                                                                                                              3R genome              duplication
                                                                                                                              duplication      eventevent
                                                                                                                                                       and
                                      and  was subsequently
                                      was subsequently       lost inlost
                                                                     the in  the teleost
                                                                          teleost   lineagelineage     [29].itWhile
                                                                                             [29]. While        remainsit remains      to be evaluated
                                                                                                                           to be evaluated       fully, the
                                      fully, the retainment
                                      retainment     of the LepRbof the  LepRb
                                                                     paralog       paralog
                                                                                is likely     is likely
                                                                                           a similar     a similar
                                                                                                       case  for thecase
                                                                                                                      Asian  forarowana,
                                                                                                                                  the Asian     arowana,
                                                                                                                                             with  LepRa
                                      with   LepRa    and   LepRb    protein   sequences     of  the  arowana      and   the
                                      and LepRb protein sequences of the arowana and the eel grouping together respectively ineel   grouping     together
Int. J. Mol. Sci. 2021, 22, 7732                                                                                          9 of 16

                                   the phylogenetic tree in Figure 2 and are notably separate from the salmonid LepRA2 node
                                   and LepRA1 of other teleost fish.
                                          Teleost fishes are a diverse group of vertebrates and the responses of leptin and its
                                   receptors across taxa and even studies within a single species can vary [8,16]. The present
                                   study exposed rainbow trout to two weeks of feed deprivation to examine the response of
                                   leptin and the LepR paralogs. The feed deprived fish exhibited significantly lower body
                                   indices including body weight, length, blood glucose, HSI, and VSI, thus displaying the
                                   characteristic catabolic state induced from fasting. Interestingly, plasma leptin decreased
                                   with feed deprivation at one week and levels remained lower than fed fish at two weeks,
                                   albeit not significant at the latter timepoint (Figure 5F). Previous studies have shown mixed
                                   responses of leptin to fasting in rainbow trout. Fasting from one to four weeks elicited an
                                   increase of plasma leptin and the levels declined rapidly upon refeeding in O. mykiss [9,33].
                                   Plasma leptin was higher in rainbow trout fed a restricted diet of 25% of controls for eight
                                   weeks [34]. An additional study analyzing changes in plasma leptin between two lines of
                                   trout with either high or low muscle adiposity suggests that nutritional plane (i.e., size of
                                   lipid depots) affects the leptin response [35]. In that study no changes in plasma leptin
                                   were measured in the high fat line while leptin levels decreased significantly in lean fish
                                   after two and four weeks of fasting. The rainbow trout used in the present study were
                                   smaller (~50 g) and contained relatively low lipid stores. Therefore, they are more likely to
                                   resemble the lean line of rainbow trout, which may be the basis for the decreased plasma
                                   leptin we observed. Additionally, long-term fasting of 4 months did not result in any
                                   significant plasma leptin or liver lepa1 mRNA differences between fed and fasted rainbow
                                   trout [36]. We also did not detect any changes in hepatic lepa1 mRNA over the two weeks
                                   of the study. Similarly, no changes in lepa1 mRNA were recorded after four weeks of fasting
                                   in Atlantic salmon, but at seven weeks there was nearly a 20-fold increase in lepa1 levels
                                   and a corresponding increase plasma leptin [37].
                                          Responses of lepa mRNA to fasting are similarly inconsistent between studies and
                                   fish species (reviewed in [3,8]). It was suggested that environmental conditions such as
                                   temperature or photoperiod, and seasonal growth phases where energy utilization changes,
                                   may be a reason for variation observed in rainbow trout leptin responses [35]. It remains
                                   unclear why leptin can be differentially regulated with exposure to feed deprivation in
                                   rainbow trout and other fishes, but teleosts are a large and diverse group of vertebrates and
                                   it is likely that the actions of leptin are more complex than simply governing appetite [8].
                                   Recent research suggests that leptin may act as a stress hormone during such catabolic
                                   events to aid in restoration of energy homeostasis (reviewed in [3]). Levels of lepa mRNA
                                   were stimulated by glucose and epinephrine injections in tilapia and it was proposed
                                   that leptin, in concert with classic stress hormones, may act to fine tune glucose during
                                   a stress response [6]. Perhaps the magnitude and duration of the stress response elicited
                                   from feed deprivation is important in understanding the wide-ranging responses of leptin.
                                   Additionally, there appears to be an important relationship between leptin, insulin, and
                                   glucose that requires further investigation in fishes. The existence of a leptin-insulin
                                   axis has been identified in tilapia, suggesting a conserved axis from mammals for the
                                   maintenance of glycemia during different metabolic states [38]. Furthermore, LepR mutant
                                   zebrafish exhibited no feeding phenotype, increased number of β-cells and insulin mRNA,
                                   and showed the hormone is primarily linked to glucose homeostasis [39].
                                          A range of tissues were analyzed for mRNA abundance of the lepa and lepr paralogs
                                   in rainbow trout. lepa1 and lepa2 mRNA levels were highest in the liver, which is similar
                                   to previous reports in rainbow trout and other fishes [3,25,37,40,41]. While levels of
                                   lepr mRNA transcripts were detected in all tissues examined, there was tissue specific
                                   expression of the leptin receptor paralogs (Figure 4A). Interestingly, lepra1 expression
                                   was low the liver while lepra2 was expressed over 17× higher in this tissue. Likewise,
                                   Atlantic salmon also show tissue specific abundance of leptin receptor paralogs, including
                                   higher levels of lepra2 in the liver and lepra1 in the muscle, brain, and gills [30]. Both
                                   receptors exhibited substantial amounts mRNA levels in rainbow trout ovaries, however,
Int. J. Mol. Sci. 2021, 22, 7732                                                                                            10 of 16

                                   lepra1 was highest in this tissue at over 50× higher than lepra2. This could suggest that
                                   the lepra1 paralog may play a greater role in reproduction or sexual maturation, both
                                   processes to which leptin has been implicated (reviewed in [42,43]). Although we did
                                   not evaluate lepb in the current paper, studies have shown that in some fishes the lepb
                                   paralog is highly expressed in the ovaries and brain compared to lepa (zebrafish, [44];
                                   orange-spotted grouper, [45]; tongue sole, [46]). It is conceivable that for the case of
                                   rainbow trout where there are duplicated receptors, the lepb paralog along with lepra1 may
                                   function together in more of a reproductive capacity or have a more specialized function.
                                   Interestingly, Atlantic salmon show increasing lepra1 expression with maturation and both
                                   leptin receptor paralogs showed comparable levels in ovarian tissue of immature fish [30].
                                   Additionally, Angotzi et al. suggested the preferred ligand/receptor combination for the
                                   brain could be LepA1/LepRA1 and LepB1-B2/LepRA1, while LepA1/LepRA2 interaction
                                   is favored in the liver [30]. Nevertheless, this aspect of leptin biology and the association
                                   between leptin paralogs and receptors requires further investigation.
                                         While duplicated receptors have been characterized in Atlantic salmon [30] and
                                   European eel [29], the LepRA1 long form receptor along with truncated versions have been
                                   described in rainbow trout (LepRL, [26,32]), Atlantic salmon [25], European sea bass [24],
                                   and crucian carp [23]. The current study evaluated levels of duplicated leptin receptors,
                                   lepra1 and lepra2, in the liver, muscle, and fat tissues from feed deprived rainbow trout. Low
                                   levels of lepra1 were detected in the liver and did not change over the course of the study,
                                   however, lepra2 was significantly higher than controls by one week of fasting and remained
                                   elevated at two weeks. Leptin receptors previously have shown to be regulated in the
                                   liver with fasting in fish. Hepatic lepr increased within one day of feed deprivation and
                                   remained elevated for three weeks in tilapia [10] and mRNA levels of hepatic leprS3, a short
                                   alternatively spliced leptin receptor variant, increased after 2 weeks of fasting in rainbow
                                   trout [26]. Although, no changes were observed in either LepR paralog with long-term
                                   fasting of four months in eel [29]. Interestingly, rainbow trout lepra2 did not respond to
                                   fasting in both muscle and fat. This along with the low levels hepatic lepra1 suggests the
                                   catabolic actions of leptin at the liver are through the lepra2 paralog. Expression of lepra2
                                   was highest in the liver in immature female Atlantic salmon while no changes in hepatic
                                   receptors were observed between fish fed every day and fish that were on a restricted diet
                                   and only fed 3 days per week [30]. The absence of a hepatic lepra2 response may have been
                                   due to the immature state of the salmon and/or that they were not completely fasted. They
                                   did observe a significant increase in brain lepra1 and lepa1 in fish on the partial diet [30]. In
                                   the current study, brain levels of the receptors were not measured in response to metabolic
                                   state, however, we did detect both LepR paralogs in the brain, hypothalamus, and pituitary.
                                   Regulation of leptin and its receptors in this region is not surprising due to the conserved
                                   role the brain plays in controlling food intake [47].
                                         White muscle lepra1 levels were 3-fold higher after one and two weeks of fasting,
                                   while transcripts in adipose tissue concurrently were suppressed at both timepoints. This
                                   suggests that in this feed deprived state, leptin is prioritizing the mobilization of energy
                                   substrates from white muscle via lepra1 and through lepra2 at the liver. In rainbow trout and
                                   most other fishes, leptin appears to primarily mobilize carbohydrates (O. mykiss, [48]; O.
                                   mossambicus; [49], reviewed in [3]), however, there is evidence in some fishes that leptin may
                                   also regulate lipids (Carassius auratus, [50]; Pelteobagrus fulvidraco, [51]; Ctenopharyngodon
                                   idellus, [52]). Glycogenolytic effects of LepA have been observed in rainbow trout with
                                   increased plasma glucose and reduced liver glycogen [48], although there is also indication
                                   that trout adipocytes can express and secrete leptin [34]. Rainbow trout that were selected
                                   for having high muscle adiposity had lower hypothalamic leprl (lepra1) expression than
                                   lean trout [53]. Although tissue glycogen and lipids were not quantified, the current study
                                   shows that amid transcripts of both receptor paralogs, muscle, hepatic, and adipose tissues
                                   were all regulated with exposure to feed deprivation. This implicates leptin actions on all
                                   three of these key metabolic tissues during a fasted, stressed state.
Int. J. Mol. Sci. 2021, 22, 7732                                                                                          11 of 16

                                         In summary, we have identified and characterized a duplicated leptin receptor,
                                   LepRA2, in rainbow trout. Evolutionary analyses show that the appearance of the LepRA2
                                   paralog in trout and other salmonids was likely due to the 4R salmonid specific genome
                                   duplication event. The two leptin receptor paralogs identified in rainbow trout are differ-
                                   entially expressed across tissues and under catabolic conditions. During fasting leptin is
                                   likely acting to promote energy mobilization in the muscle through lepra1 and in the liver
                                   through lepra2 in rainbow trout. As we gain understanding about leptin and its receptors
                                   in fishes and other ectotherms, the pleiotropic behavior of this hormone becomes more
                                   apparent. While regulating appetite is a notable function of leptin, it is clear that through
                                   the tissue specific actions of its receptors the hormone can impact many other aspects of
                                   life history in fishes.

                                   4. Materials and Methods
                                        All procedures and research were approved and performed in accordance with the
                                   relevant guidelines and regulations by the Institutional Animal Care and Use Committee
                                   at the National Center for Cool and Cold Water Aquaculture (NCCCWA, protocol #164).
                                   Rainbow trout were maintained in either a flow-through tank or partial re-use system
                                   (temperature 12.5–13.5 ◦ C, ambient photoperiod) and provided a commercially available
                                   feed (Zeigler Finfish G, Gardners, PA, USA; 42% protein, 16% fat).

                                   4.1. Phylogenetic Analyses and Sequence Alignments
                                        The rainbow trout genome (O. mykiss, accession # GCA_013265735.3) and all pro-
                                   tein and nucleotide sequences for evolutionary analyses were retrieved from Genbank
                                   on the NCBI website ([54]; Bethesda, MD, USA). Published and predicted sequences for
                                   leptin receptors from salmonid fish were evaluated for homology. The lepra2 sequence
                                   from Atlantic salmon (accession # JX131307, [30]) was compared to all similar salmonid
                                   sequences available on the Genbank database using BLAST [54]. For phylogenetic trees,
                                   all analyses were performed with MEGA X, where nucleotide and amino acid sequences
                                   of leptin receptors were aligned with Muscle and phylogenetic trees were created with
                                   the Maximum-likelihood method with default settings and 1000 bootstrap replicates [55].
                                   An additional amino acid sequence alignment of the leptin receptors was performed
                                   using Clustal Omega (European Molecular Biology Laboratory, EMBL-EBI, Hinxton, Cam-
                                   bridgeshire, UK [56]) and analyzed with Jalview (version 2.11.1.3 [57]). The alignment
                                   conservation scores assigned by Jalview reflect the physical and chemical properties of
                                   each column in the alignment, with higher values indicating higher sequence conservation.
                                   The presence of conserved peptide signaling domains were predicted using the InterPro
                                   database and InterProScan (version 86.0; EMBL-EBI, Hinxton, Cambridgeshire, UK [58]).

                                   4.2. Tissue Distribution
                                         Adult female rainbow trout (1.7 ± 0.08 kg mean body weight, BW) that were approx-
                                   imately 21 months post-hatch were given a lethal dose (300 mg/L) of tricaine methane-
                                   sulfonate (MS-222; Pentair Aquatic Eco-Systems, Apopka, FL, USA). Brain, distal kidney,
                                   fat, gill, heart, head kidney, hypothalamus, liver, ovary, pituitary, pyloric caeca, posterior
                                   intestine, red muscle, spleen, stomach, and white muscle were excised from the fish (n = 5).
                                   Tissues (~100 mg or less) were placed in 1 mL of RNAlater (Ambion Inc., Austin, TX, USA),
                                   kept overnight at 4 ◦ C, and then stored at −20 ◦ C until extractions.

                                   4.3. Feed Deprivation Study
                                        Rainbow trout (46.2 ± 5.7 g mean BW) were stocked 14 fish per tank into six 150-
                                   L tanks and were allowed to acclimate for one week, during which feed was provided
                                   at 2% of tank biomass using automated feeders (Arvotec, Finland). Three tanks were
                                   randomly assigned as fed controls and were fed 2% biomass/day and three tanks were
                                   fasted for two weeks. Body weights and lengths of all fish were recorded at the beginning
                                   of the study and at each timepoint. Control tanks were fasted for 24 h prior to sampling.
Int. J. Mol. Sci. 2021, 22, 7732                                                                                                               12 of 16

                                       Four fish from each tank were sampled at each timepoint, except at T = 0 where two
                                       fish from each of the six tanks were sampled (n = 12/treatment/timepoint). Fish were
                                       euthanized with a lethal dose of MS-222, length (cm) and weight (g) were recorded,
                                       and blood was collected from caudal vasculature using heparinized syringes. Blood
                                       glucose measurements were immediately analyzed using a Prodigy AutoCode glucometer
                                       (Prodigy Diabetes Care, LLC, Charlotte, NC, USA). Whole liver tissue was removed and
                                       weighed to obtain the hepatosomatic index (HSI; (liver weight/total body weight) × 100).
                                       Similarly, all the viscera were removed and weighed to calculate the viserosomatic index
                                       (VSI; (viscera weight/total body weight) × 100). Liver, white muscle, and fat tissues were
                                       collected (~100 mg) and placed in 1 mL of RNAlater, kept overnight at 4 ◦ C, and then
                                       stored at −20 ◦ C until extractions. Blood samples were spun at 3000× g for 7 min to collect
                                       plasma and stored at −20 ◦ C.

                                       4.4. RNA Isolation and Quantitative Real-Time PCR
                                            Total RNA was extracted from tissues with 1 mL of Tri-Reagent (Molecular Research
                                       Center, Cincinnati, OH, USA) following the manufacturers protocol. RNA quality was
                                       assessed by presence of 18S and 28S ribosomal RNA bands using gel electrophoresis, and
                                       then quantified by absorbance OD 260:280 ratio using a Nanodrop 2000c spectrophotometer
                                       (Thermo Scientific, Waltham, MA, USA). Total RNA (≤ 1 µg) was DNase treated (Promega
                                       RQ1 RNase-Free DNase, Madison, WI, USA) and was used in a cDNA synthesis reaction via
                                       reverse transcription following the manufacturer’s instructions (Promega M-MLV Reverse
                                       Transcriptase). mRNA levels of lepra1, lepra2, lepa1, lepa2, and ef-1α (elongation factor
                                       1 alpha) were determined by qPCR using gene-specific primers (Table 1).

                                           Table 1. List of primer sets used for qPCR in rainbow trout.

 Gene                 Accession #                 Forward (50 -30 )                                      Reverse (50 -30 )
 lepra1               JX878485                    TCATTTCTATGACACTGAGTACGA                               TCAGAAGCATGTAGGCAGCA
 lepra2               XM_021599667                ACAGATGGAGAAGGAGAGCC                                   GGACAATGGCAAGGAAAGCG
 lepa1                AB354909                    GGTGATTAGGATCAAAAAGCTGGA                               GACGAGCAGTAGGTCCTGGTAGAA
 lepa2                JX123129                    TGGGAATCAAAAAGCTCCCTTCCTCTT                            GCCTCCTATAGGCTGGTCTCCTGCA
 ef-1α                AF498320                    CATTGACAAGAGAACCATTGA                                  CCTTCAGCTTGTCCAGCAC
               lepra1: Leptin Receptor A1; lepra2: Leptin Receptor A2; lepa1: Leptin A1; lepa2: Leptin A2; ef-1α: Elongation factor 1 alpha.

                                            Primer pairs were created with Primer-3 and BLAST on NCBI [59] and were designed
                                       to span into the transmembrane domain to ensure specificity to the long form receptor and
                                       not truncated forms or binding proteins. Primer pairs were compared to each other with
                                       BLAST to ensure no complementarity. lepa1 and lepa2 primers sequences were obtained
                                       from existing literature [60]. All reactions were run in triplicate and performed on a
                                       QuantStudio 5 Real-Time PCR System (Applied Biosystems, Foster City, CA, USA), with
                                       Applied Biosystems SYBR Green qPCR master mix, using 1.5 µM primers, and 2 µL of
                                       1:6 diluted cDNA in a total reaction volume of 10 µL. The cycling parameters were 95 ◦ C
                                       for 10 min followed by 40 cycles of 95 ◦ C for 30 s and 60 ◦ C for 1 min. A dissociation
                                       melt curve step at the end was performed to verify a single PCR product. The absence
                                       of genomic DNA contamination was confirmed using water (No Template Control; NTC)
                                       and DNase treated RNA with no reverse transcriptase enzyme (No-Amplification Control;
                                       NAC) as negative controls. Cycle threshold (Ct) values for samples were transformed
                                       using a standard curve of serially diluted pooled cDNA versus Ct values (R2 = 0.96–0.99).
                                       Samples were then normalized to reflect the amount of template cDNA per ng total RNA
                                       loaded into each reaction (cDNA/ng total RNA) and samples were also normalized to the
                                       expression levels of ef-1α RNA as a secondary control to validate the normalization method
                                       (data not presented). The expression of ef-1α has previously been validated as a stable
                                       reference gene in liver and white muscle our previous rainbow trout feed deprivation
                                       study [61]. The values are expressed as fold change relative to the mean of the initial
                                       baseline group as indicated in the figure legends.
Int. J. Mol. Sci. 2021, 22, 7732                                                                                                      13 of 16

                                   4.5. Plasma Leptin Measurement
                                        Plasma leptin was measured with a commercially available salmon leptin ELISA kit
                                   (Catalog # MBS935480; MyBioSource, Inc., San Diego, CA, USA). The assay was performed
                                   according to the manufacturers protocol. Plasma was diluted 1:75 or 1:200 in ultrapure
                                   water, followed by a 1:10 dilution with sample diluent. All samples and standards were
                                   run in duplicate. Optical density (OD) values were measured at 450 nm using a microplate
                                   reader (Varioskan, Thermo Scientific, Waltham, MA, USA). Readings at 570 nm and blank
                                   well ODs were subtracted from all wells to correct for background absorbance. Pooled
                                   plasma samples were run on each plate for interassay normalization. Adjusted OD values
                                   were analyzed using non-linear regression and GraphPad Prism 8 (GraphPad, La Jolla,
                                   CA, USA) and were interpolated from a sigmoidal curve generated from standards on
                                   each plate.

                                   4.6. Statistical Analyses
                                        The data were analyzed by two-way ANOVA (treatment x time) and were analyzed for
                                   significance at each time point with Fisher’s Least Significant Difference (LSD) test and also
                                   differences over time from control groups within treatments with Dunnett’s post-hoc. All
                                   analyses were performed using GraphPad Prism 8. The level set for statistical significance
                                   for all analyses was p < 0.05 and data are shown as mean values ± SEM.

                                   Author Contributions: Conceptualization, J.L.M. and B.M.C.; methodology, J.L.M. and B.M.C.;
                                   formal analysis, J.L.M.; investigation, J.L.M.; resources, B.M.C.; writing—original draft preparation,
                                   J.L.M.; writing—review and editing, J.L.M. and B.M.C.; supervision, B.M.C. Both authors have read
                                   and agreed to the published version of the manuscript.
                                   Funding: This research was funded by USDA/ARS project number 8082-31320-003-00D.
                                   Institutional Review Board Statement: The study was conducted according to the guidelines of
                                   the Declaration of Helsinki, and approved by the Institutional Animal Care and Use Committee
                                   at the National Center for Cool and Cold Water Aquaculture (NCCCWA protocol #164; approved
                                   16 October 2019) and performed according to guidelines published by the American Veterinary
                                   Medical Association.
                                   Informed Consent Statement: Not applicable.
                                   Data Availability Statement: Data from this study will be provided upon request.
                                   Acknowledgments: We wish to thank Josh Kretzer, Joseph Beach, and Vanessa Panaway for the
                                   critical care of the fish used in these studies. We also would like to extend thanks to Lisa Radler for
                                   sampling and laboratory assistance. Mention of trade names is solely to convey accuracy and does
                                   not represent endorsement by the USDA. The USDA is an equal opportunity employer and provider.
                                   Conflicts of Interest: The authors declare no conflict of interest.

References
1.    Ahima, R.S.; Flier, J.S. Leptin. Annu. Rev. Physiol. 2000, 62, 413–437. [CrossRef] [PubMed]
2.    Londraville, R.L.; Macotela, Y.; Duff, R.J.; Easterling, M.R.; Liu, Q.; Crespi, E.J. Comparative endocrinology of leptin: Assessing
      function in a phylogenetic context. Gen. Comp. Endocrinol. 2014, 203, 146–157. [CrossRef]
3.    Deck, C.A.; Honeycutt, J.L.; Cheung, E.; Reynolds, H.M.; Borski, R.J. Assessing the Functional Role of Leptin in Energy
      Homeostasis and the Stress Response in Vertebrates. Front. Endocrinol. 2017, 8, 63. [CrossRef]
4.    Zhang, Y.; Proenca, R.; Maffei, M.; Barone, M.; Leopold, L.; Friedman, J.M. Positional cloning of the mouse obese gene and its
      human homologue. Nature 1994, 372, 425–432. [CrossRef]
5.    Saladin, R.; De Vos, P.; Guerre-Millot, M.; Leturque, A.; Girard, J.; Staels, B.; Auwerx, J. Transient increase in obese gene expression
      after food intake or insulin administration. Nature 1995, 377, 527–528. [CrossRef]
6.    Mankiewicz, J.L.; Deck, C.A.; Taylor, J.D.; Douros, J.D.; Borski, R.J. Epinephrine and glucose regulation of leptin synthesis and
      secretion in a teleost fish, the tilapia (Oreochromis mossambicus). Gen. Comp. Endocrinol. 2021, 302, 113669. [CrossRef] [PubMed]
7.    Lu, R.H.; Zhou, Y.; Yuan, X.C.; Liang, X.F.; Fang, L.; Bai, X.L.; Wang, M.; Zhao, Y.H. Effects of glucose, insulin and triiodothyroxine
      on leptin and leptin receptor expression and the effects of leptin on activities of enzymes related to glucose metabolism in grass
      carp (Ctenopharyngodon idella) hepatocytes. Fish Physiol. Biochem. 2015, 41, 981–989. [CrossRef] [PubMed]
Int. J. Mol. Sci. 2021, 22, 7732                                                                                                         14 of 16

8.    Blanco, A.M.; Soengas, J.L. Leptin signalling in teleost fish with emphasis in food intake regulation. Mol. Cell Endocrinol. 2021,
      526, 111209. [CrossRef] [PubMed]
9.    Kling, P.; Rønnestad, I.; Stefansson, S.O.; Murashita, K.; Kurokawa, T.; Björnsson, B.T. A homologous salmonid leptin radioim-
      munoassay indicates elevated plasma leptin levels during fasting of rainbow trout. Gen. Comp. Endocrinol. 2009, 162, 307–312.
      [CrossRef] [PubMed]
10.   Douros, J.D.; Baltzegar, D.A.; Mankiewicz, J.; Taylor, J.; Yamaguchi, Y.; Lerner, D.T.; Seale, A.P.; Grau, E.G.; Breves, J.P.; Borski, R.J.
      Control of leptin by metabolic state and its regulatory interactions with pituitary growth hormone and hepatic growth hormone
      receptors and insulin like growth factors in the tilapia (Oreochromis mossambicus). Gen. Comp. Endocrinol. 2017, 240, 227–237.
      [CrossRef]
11.   Won, E.T.; Baltzegar, D.A.; Picha, M.E.; Borski, R.J. Cloning and characterization of leptin in a Perciform fish, the striped bass
      (Morone saxatilis): Control of feeding and regulation by nutritional state. Gen. Comp. Endocrinol. 2012, 178, 98–107. [CrossRef]
12.   Volkoff, H. Cloning, tissue distribution and effects of fasting on mRNA expression levels of leptin and ghrelin in red-bellied
      piranha (Pygocentrus nattereri). Gen. Comp. Endocrinol. 2015, 217, 20–27. [CrossRef] [PubMed]
13.   Tinoco, A.B.; Nisembaum, L.G.; Isorna, E.; Delgado, M.J.; de Pedro, N. Leptins and leptin receptor expression in the goldfish
      (Carassius auratus). Regulation by food intake and fasting/overfeeding conditions. Peptides 2012, 34, 329–335. [CrossRef]
      [PubMed]
14.   Gorissen, M.; Flik, G. Leptin in teleostean fish, towards the origins of leptin physiology. J. Chem. Neuroanat. 2014, 61, 200–206.
      [CrossRef] [PubMed]
15.   Angotzi, A.R.; Stefansson, S.O.; Nilsen, T.O.; Rathore, R.M.; Rønnestad, I. Molecular cloning and genomic characterization of
      novel leptin-like genes in salmonids provide new insight into the evolution of the leptin gene family. Gen. Comp. Endocrinol. 2013,
      187, 48–59. [CrossRef] [PubMed]
16.   Londraville, R.L.; Prokop, J.W.; Duff, R.J.; Liu, Q.; Tuttle, M. On the molecular evolution of leptin, leptin receptor, and endospanin.
      Front. Endocrinol. 2017, 8, 58. [CrossRef] [PubMed]
17.   Frühbeck, G. Intracellular signalling pathways activated by leptin. Biochem. J. 2006, 393, 7–20. [CrossRef]
18.   Tartaglia, L.A. The leptin receptor. J. Biol. Chem. 1997, 272, 6093–6096. [CrossRef]
19.   Huising, M.O.; Kruiswijk, C.P.; Flik, G. Phylogeny and evolution of class-I helical cytokines. J. Endocrinol. 2006, 189, 1–25.
      [CrossRef]
20.   Gorska, E.; Popko, K.; Stelmaszczyk-Emmel, A.; Ciepiela, O.; Kucharska, A.; Wasik, M. Leptin receptors. Eur. J. Med. Res. 2010, 15,
      1–5. [CrossRef]
21.   Denver, R.J.; Bonett, R.M.; Boorse, G.C. Evolution of leptin structure and function. Neuroendocrinology 2011, 94, 21–38. [CrossRef]
22.   Cui, M.Y.; Hu, C.K.; Pelletier, C.; Dziuba, A.; Slupski, R.H.; Li, C.; Denver, R.J. Ancient origins and evolutionary conservation
      of intracellular and neural signaling pathways engaged by the leptin receptor. Endocrinology 2014, 155, 4202–4214. [CrossRef]
      [PubMed]
23.   Cao, Y.B.; Xue, J.L.; Wu, L.Y.; Jiang, W.; Hu, P.N.; Zhu, J. The detection of 3 leptin receptor isoforms in crucian carp gill and the
      influence of fasting and hypoxia on their expression. Domest. Anim. Endocrinol. 2011, 41, 74–80. [CrossRef]
24.   Escobar, S.; Rocha, A.; Felip, A.; Carrillo, M.; Zanuy, S.; Kah, O.; Servili, A. Leptin receptor gene in the European sea bass
      (Dicentrarchus labrax): Cloning, phylogeny, tissue distribution and neuroanatomical organization. Gen. Comp. Endocrinol. 2016,
      229, 100–111. [CrossRef]
25.   Rønnestad, I.; Nilsen, T.O.; Murashita, K.; Angotzi, A.R.; Moen, A.G.G.; Stefansson, S.O.; Kling, P.; Björnsson, B.T.; Kurokawa,
      T. Leptin and leptin receptor genes in Atlantic salmon: Cloning, phylogeny, tissue distribution and expression correlated to
      long-term feeding status. Gen. Comp. Endocrinol. 2010, 168, 55–70. [CrossRef] [PubMed]
26.   Gong, N.; Einarsdottir, I.E.; Johansson, M.; Björnsson, B.T. Alternative splice variants of the rainbow trout leptin receptor encode
      multiple circulating leptin-binding proteins. Endocrinology 2013, 154, 2331–2340. [CrossRef]
27.   Prokop, J.W.; Duff, R.J.; Ball, H.C.; Copeland, D.L.; Londraville, R.L. Leptin and leptin receptor: Analysis of a structure to function
      relationship in interaction and evolution from humans to fish. Peptides 2012, 38, 326–336. [CrossRef] [PubMed]
28.   Meyer, A.; Van de Peer, Y. From 2R to 3R: Evidence for a fish-specific genome duplication (FSGD). Bioessays 2005, 27, 937–945.
      [CrossRef] [PubMed]
29.   Morini, M.; Pasquier, J.; Dirks, R.; van den Thillart, G.; Tomkiewicz, J.; Rousseau, K.; Dufour, S.; Lafont, A.G. Duplicated leptin
      receptors in two species of eel bring new insights into the evolution of the leptin system in vertebrates. PLoS ONE 2015, 10,
      e0126008. [CrossRef]
30.   Angotzi, A.R.; Stefansson, S.O.; Nilsen, T.O.; Øvrebø, J.I.; Andersson, E.; Taranger, G.L.; Rønnestad, I. Identification of a novel
      leptin receptor duplicate in Atlantic salmon: Expression analyses in different life stages and in response to feeding status. Gen.
      Comp. Endocrinol. 2016, 235, 108–119. [CrossRef]
31.   Berthelot, C.; Brunet, F.; Chalopin, D.; Juanchich, A.; Bernard, M.; Noël, B.; Bento, P.; Da Silva, C.; Labadie, K.; Alberti, A.; et al.
      The rainbow trout genome provides novel insights into evolution after whole-genome duplication in vertebrates. Nat. Commun.
      2014, 5, 1–10. [CrossRef] [PubMed]
32.   Gong, N.; Björnsson, B.T. Leptin signaling in the rainbow trout central nervous system is modulated by a truncated leptin receptor
      isoform. Endocrinology 2014, 155, 2445–2455. [CrossRef] [PubMed]
You can also read