How to Measure Woody Biomass in Your Forest - Northwest ...
←
→
Page content transcription
If your browser does not render page correctly, please read the page content below
How to Measure
Woody Biomass
 in Your Forest

              1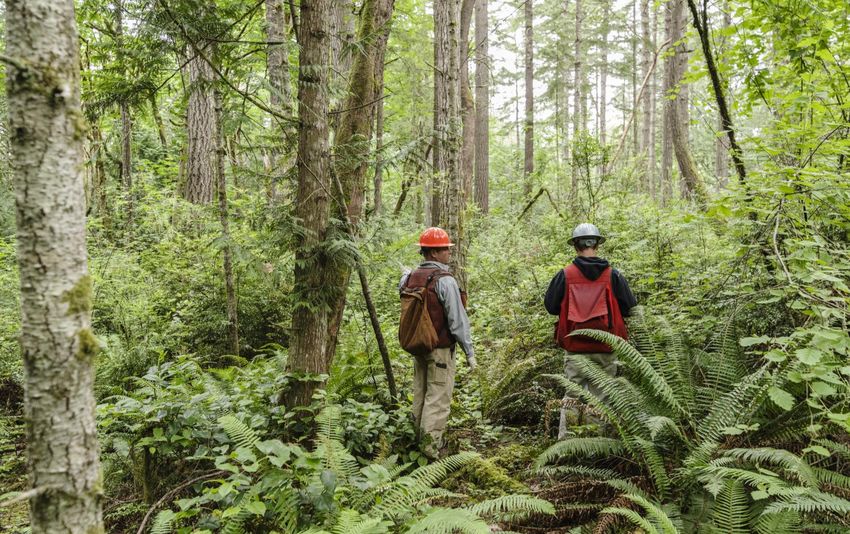
CREDITS

                                       Authors:
                                       CREDITS
                              Northwest Natural Resource Group

                                       www.nnrg.org

                                 With support from:
                               USDA Risk Management Agency
                                    www.rma.usda.gov

                                     Cover photo:
                                   Matt Freeman-Gleason
                                      mfgimages.com

                                                                 2

Photo: Matt Freeman-Gleason
CONTENTS

CREDITS ......................................................................................................................................................... 2
CONTENTS ..................................................................................................................................................... 3
  CONTENTS
ACRONYMS ................................................................................................................................................... 5
INTRODUCTION ............................................................................................................................................. 6
   Structure of This Guidebook ..................................................................................................................... 8
    Required Skills .......................................................................................................................................... 8
   Equipment List .......................................................................................................................................... 9
FOREST INVENTORY ...................................................................................................................................... 2
   Different Types of Inventories .................................................................................................................. 2
       Permanent vs. Temporary Plots............................................................................................................ 2
       Fixed Area vs. Variable Radius Plots ..................................................................................................... 2
       Inventory Frequency ............................................................................................................................. 2
    Create a Stand Map.................................................................................................................................. 3
OFFICE PREPARATION ................................................................................................................................... 3
   Determine Your Inventory Plot Strategy .................................................................................................. 4
       Determine type of plot (temporary or permanent).............................................................................. 4
       Determine plot size ............................................................................................................................... 4
       Determine the number of plots per stand ............................................................................................ 4
   Locate the plots......................................................................................................................................... 6
FIELD DATA COLLECTION .............................................................................................................................. 6
   Mark plot center ....................................................................................................................................... 6
       Temporary plots .................................................................................................................................... 6
       Permanent plots.................................................................................................................................... 7
   Record Plot data........................................................................................................................................ 8
       Plot data ................................................................................................................................................ 8
       Tree data ............................................................................................................................................... 9
OFFICE ANALYSIS ......................................................................................................................................... 11
   Get Familiar with the Calculator ............................................................................................................. 11
   Entering Data into the Calculator ........................................................................................................... 12
       Stand Tab ............................................................................................................................................ 12

                                                                                                                                                                 3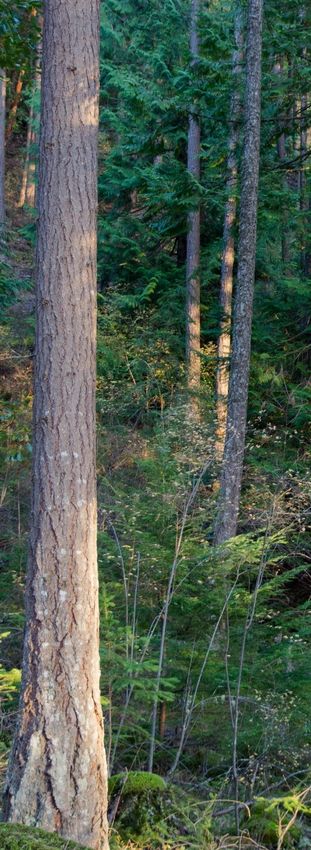
Tree Tab .............................................................................................................................................. 12
       Plot Tab ............................................................................................................................................... 13
       Merchantability Tab ............................................................................................................................ 13
   Running the Calculator............................................................................................................................ 14
   Analyzing the Data .................................................................................................................................. 14
       Plot Reports......................................................................................................................................... 14
       Stand Report ....................................................................................................................................... 16
       Species Report .................................................................................................................................... 16
       Volume Report .................................................................................................................................... 16
       Stand Table ......................................................................................................................................... 16
   Next Steps ............................................................................................................................................... 17
APPENDIX 1 – Plot Data Card ...................................................................................................................... 18
APPENDIX 2 – Glossary................................................................................................................................ 19
APPENDIX 3 - From Data Analysis to Forest Management: Common Questions ....................................... 21
   Is my forest overstocked? ....................................................................................................................... 21
       Using the Woody Biomass Calculator ................................................................................................. 22
   How can I increase species diversity in my forest?................................................................................. 23
       Using the Woody Biomass Calculator ................................................................................................. 23
   How do I determine the volume of non-merchantable timber that I have that can be converted to
   biochar, firewood or other uses?............................................................................................................ 23
   Can I use the calculator to estimate potential revenue for a harvest? .................................................. 24

                                                                                                                                                                4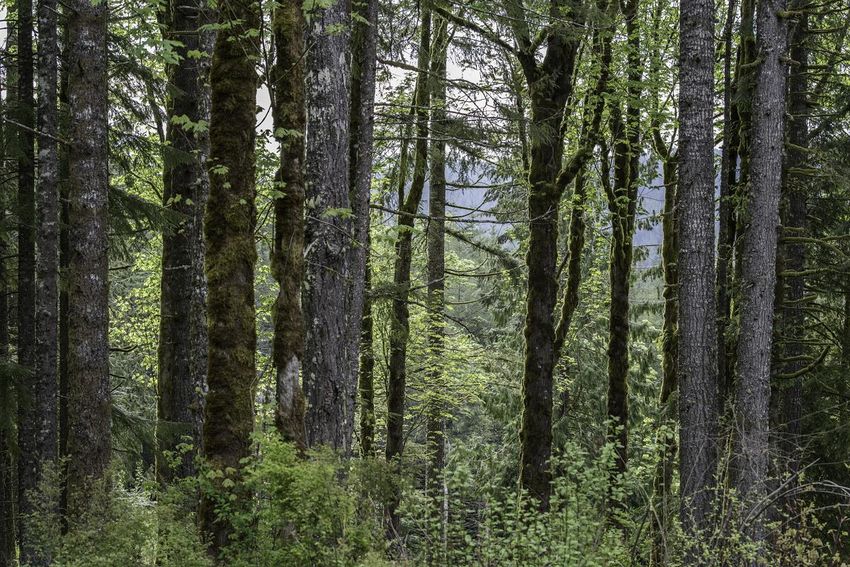
ACRONYMS

The following acronyms are used in this guidebook:
BA: Basal area is the cross-sectional area of a tree 4.5 feet above ground.
DBH: Diameter at breast height is the measurement of tree diameter 4.5 feet from the ground.
HDR: Height to diameter ratio is the ratio between a tree’s total height and its DBH.
LCR: Live crown ratio is the percent of a tree’s total height that has live, green branches.
MBF: Thousand board feet
QMD: Quadratic mean diameter is the measure of average tree diameter related to basal area.
RD: Relative density is the comparison of current density to some maximum.
SDI: Stand density index estimates the RD of uneven-aged, mixed species forests at large scales.
TPA: Trees per acre

These terms are explained in Appendix 2 - Glossary.

                                                                                               5
INTRODUCTION
The goal of this guidebook is to provide landowners with a practical inventory system for
estimating the volume of timber and woody biomass in their forest. By using these guidelines,
landowners can more easily collect information to inform their forest management decisions.
Such decisions may include whether to commercially or pre-commercially thin a forest, when to
do it, which trees to remove when thinning, and what to do with the thinned woody biomass.

Thinning involves removing a portion of the trees growing in a forest. Thinning is a
recommended practice particularly for forests where the trees are crowded together and show
signs of decline due to competition for limited resources such as sunlight, nutrients and water.
Thinning is one of the most important practices forest owners can carry out to improve the
health, productivity, and diversity of their woods.

Many forests are not currently as productive as they could be for either biodiversity or wood
products. As forests have changed ownership over the last century, management goals and
objectives have also changed. Many forests once managed for industrial timber production, for
instance, are now managed for a variety of goals including beauty and enjoyment, nature,
recreation, and income. Trees that were planted under a previous set of objectives (e.g. short-
rotation timber plantation) continue to grow under new goals (e.g. long lived diverse forest).
Today there are many acres of overstocked forests that consist of a high percentage of poor
quality trees, and often these stands are dominated by a single species and age of trees.

One of the first steps in making informed management decisions about a forest is to get a
better understanding of the stocking and composition. However, conducting a forest inventory
may sound a little daunting to most new and beginning forest owners. This guidebook, along
with NNRG’s Woody Biomass Calculator (https://www.nnrg.org/wp-
content/uploads/2019/01/Woody-Biomass-Calculator.xlsx), is a simple and practical method
for estimating the volume of timber and woody biomass in a forest. This guidebook provides
simple steps for collecting basic tree measurements and forest data, as well as instruction on

   Left: A dense stand crowded with suppressed trees. Right: A recently thinned stand. Plot data generated with NNRG’s Woody
                 Biomass Calculator would reveal more information about the biomass stored in these two stands.                6
                                                 Photos: Matt Freeman-Gleason
how to use the calculator to convert this            Please note, the guidebook and
information into estimates of timber and
                                                      calculator are only intended to
biomass volumes.
                                                    produce volume estimates to help
Common questions that forest owners ask when               you make basic forest
they think about thinning their forest include:        management decisions – the
   •   How much timber volume is in my forest?         calculator may not produce
       How much should I remove? How much            statistically accurate results and
       should I retain to meet my management         should not be used in place of a
       goals?                                       formal timber cruise or appraisal.
   •   Which trees have merchantable value?
       Which ones do not?
   •   How much wood should I leave on the ground during thinning to improve soil health
       and wildlife habitat?
   •   Will I increase fire risk if I leave too much dead wood in my forest?
   •   How much woody biomass can I remove from my forest to use for firewood, biochar,
       and other projects?

By inventorying your forest and using the Woody Biomass Calculator you will be able to answer
the following questions about your forest:

   •   How many gross tons of biomass are in my forest? How much of this volume is
       merchantable? How much is non-merchantable?
   •   How many tons of biomass are in the tree trunks vs. the limbs and bark? How much
       biomass is in dead trees (snags) vs. live trees?
   •   How many board feet of merchantable timber do I have?
   •   How many trees per acre are there in my forest? What is the average tree diameter?
       What is the diameter range of trees in my forest?
   •   How much wood volume of each tree species is there in my forest?
   •   And more

                                                                                            7
Structure of This Guidebook
This guidebook is organized into four sections:

   •   Forest inventory
   •   Office preparation
   •   Field instructions
   •   Office analysis

This sequential structure introduces concepts and techniques, helps you prepare for efficient
fieldwork, gives instruction for collecting field data, then provides guidance on how to analyze
the field data using the Woody Biomass Calculator.

                                            Photo by NNRG

Required Skills
You will need the following basic forestry skills to use this guidebook. These skills can be gained
through training workshops provided by Northwest Natural Resource Group or coached
stewardship planning classes offered by state forestry extension services.

   •   Identifying tree species
   •   Using basic forestry tools including: clinometer or laser range finder, increment borer,
       and diameter tape.
   •   Using Microsoft Excel
                                                                                                   8
Equipment List
The following items are recommended for conducting a forest inventory:

       Items for field data collection           Items for permanent plots (Optional)
   •   Plot Data Card(s) (Appendix 1)            • Hatchet or hammer
   •   Tree diameter tape                        • Numbered tree tags (check for
   •   Clinometer or laser range finder             numbers that have not been used)
   •   16” Increment borer (if aging trees)      • Aluminum nails
   •   Roll of plastic flagging                  • 4’ stake for marking center of
   •   Pencils                                      permanent plot (e.g. a firm stick or
   •   Small pocket sized notebook                  rebar with white PVC pipe)
   •   Map of your forest stand

             Other optional Items
   •   Field vest or backpack to carry field
       tools
   •   Aerial Photo or contour map of forest
   •   GPS or smartphone with GPS app
   •   Compass
   •   Binoculars
   •   First-aid kit
   •   Machete for heavy brush
   •   Snacks and water
   •   Clipboard or datum
   •   Stand map w/plots mapped out
   •   Digital camera
   •   Plant ID book

                                                           Photo by Matt Freeman-Gleason

                                                                                           9
FOREST INVENTORY

As it is impractical to measure every single tree in a forest stand, a forest inventory measures
small samples of the stand and extrapolates the results to characterize the entire stand.

The basic process involves setting up inventory plots in a random grid across your forest;
stopping at each plot to measure and record variables such as tree species, diameter, and
height; averaging these values for each variable per acre; and multiplying the average by the
number of acres in the forest to generate forest-scale totals.

Different Types of Inventories
Permanent vs. Temporary Plots
Temporary plots are the simplest inventory method and involve measuring plots once without
the need for permanent marking. This method is recommended for quick, one-time evaluations
of a forest as a whole.

Permanent plots are a more precise inventory method and involve marking plot centers and
tagging trees with numbers so that variables can be measured again within the same plot over
many years. This method is recommended for monitoring how the forest changes over time in
the exact same location.

Fixed Area vs. Variable Radius Plots
Fixed area plots are simple to work with and consist of a predetermined and unchanging
sample area on the ground. Fixed area plots are typically defined by their fraction of an acre,
such as a 1/20th acre plot (26.3’ radius), or a 1/10th acre plot (37.2’ radius), etc.

Variable radius plots are not compatible with the Woody Biomass Calculator, because the
calculator depends on using the same plot radius throughout the stand. To learn more about
how to use variable radius plots to create your forest inventory, please consult this fact sheet
from the Forest Service:
https://www.fs.fed.us/nrm/documents/fsveg/cse_user_guides/userguide_fsveg_apdx_j_var-
plot.docx

Inventory Frequency
Ideally, an entire ownership should be inventoried when a management plan is written, and re-
inventoried at approximately 10-year intervals. Other smaller inventories may be needed to
inform management decisions, such as before and after a timber harvest, before a pre-
commercial thinning, after planting, or after a major storm or other disturbance event.

                                                                                                   2
OFFICE PREPARATION
Create a Stand Map
Every forest inventory starts with a desk exercise where you will divide your forest into stands,
and map these stands to determine your basic inventory framework. A stand is an area of the
forest that is relatively uniform and can be managed as a single unit. Stands can be delineated
by age, species, forest structure, soil, management goals, or other criteria. For more
information on how to divide your forest into stands, please see pages 5 to 7 of WSU’s Basic
Forest Inventory Techniques for Family Forest Owners
(http://cru.cahe.wsu.edu/CEPublications/PNW630/PNW630.pdf).
You will need to create a map of the various forest stands on your property that you can easily
carry during field work. It may help to place your
map in a zip-lock bag to protect it, especially on
rainy days. You may already have this map if
you’ve previously developed a forest
management plan. The stand map needs to
identify the boundaries and acreage of each
discrete stand. Your property may have many
different stands, or it may all be comprised of a
single stand type (e.g. Douglas fir plantation).
A stand map can be easily created online for free
using Google Earth Pro
(https://earth.google.com/download-earth.html). Example stand map created in Google Earth
This software also allows you to calculate the size
of a stand in acres, export data to your GPS unit or smartphone for use in the field, and store
and analyze data collected in the field.
There are many free apps available for smartphones that allow you to download aerial photos
and contour maps, download property and stand boundaries from Google Earth, and then map
and record data while walking in your woods. These tools are invaluable for navigating in the
woods and recording plot locations. Two common mapping apps are Avenza Maps PDF and
Backcountry Navigator.
3Determine Your Inventory Plot Strategy
Determine type of plot (temporary or permanent)
Decide whether plots will be temporary or permanent. You may choose to put permanent plots
in a few select stands that will receive specific treatments you wish to continue monitoring, and
temporary plots in stands which you do not necessarily need or want to monitor single tree
growth.
How to Estimate TPA
Determine plot size
Each plot should contain an average of 6 - 10 1. Select an area that is representative of
dominant overstory trees. For example, if the the stand and mark a point at plot center.
2. Using the plot radius chart below,
stand is predominantly comprised of Douglas
measure out a sufficient radius to obtain a
fir greater than 6” DBH, each plot should minimum of 6– 10 dominant trees within
contain 6 - 10 dominant Douglas fir trees. If the circular plot.
there are small 1” - 3” DBH saplings in the 3. Count the total number of overstory
trees in the plot and multiply by the plot
stand, you can include them in your inventory
size to determine TPA.
if you choose, but focus primarily on the main 4. Example: 9 trees within a 10th acre plot.
cohort of overstory trees. If you know the 9 x 10 = 90 TPA.
approximate average density (trees per acre)
use the table below to select the appropriate plot size. The plot size must be the same for all
plots in a stand but can vary between stands. If you don’t know the density of the stand, you
will need to visit the stand and measure the trees per acre, then choose the appropriate plot
size (see box above).
Plot Radius Chart Determine the number of plots
per stand
Trees per Acre Recommended Plot Size Plot Radius
The number of plots you choose
800+ 1/100th acre 11.8’ to install per stand depends on
400-800 th
1/50 acre 16.7’ how accurate you need the
150-400 th
1/20 acre 26.3’ resulting data to be and how
75-150 th
1/10 acre 37.2’ much time you have. If you only
75 or less th
1/5 acre 52.7’ need a ballpark estimate, are
looking for a range, or have a very
limited amount of time, you can install fewer plots. If you want to achieve a statistically valid
sample of your forest, you will need to install more plots. Furthermore, if your forest has a
highly variable composition, you will want to install more plots. Conversely, if the species and
composition of your forest is very homogenous, you can reduce the number of plots. In all
cases, make sure that you use enough plots to adequately represent the entire stand area.
4The table below suggests the number of plots that should be installed based on the size of the plot and
the size of the stand in order to achieve a highly accurate forest inventory. For heterogeneous stands,
install more plots. For homogenous stands, install fewer.
Suggested minimum number of plots per stand
Plot size Stand Size
5-20 Ac 21-40 Ac 41-80 Ac 80+ Ac
1/100th 10 15 20 25
1/50th 10 15 20 25
1/20th 8 10 12 15
1/10th 6 8 10 15
1/5th 5 8 10 12
If you plan to choose plot locations in the field,
you’re ready to head out into the woods!
However, it is standard practice to use randomly
located plots in order avoid subjectivity when
collecting forest inventory data. If you would like
to use a randomization procedure for locating
plots, NNRG’s Forest Inventory & Monitoring
Guidelines provides detailed instructions to ensure
that no bias affects the location of plots. These
need to be mapped out in advance of fieldwork to
produce a map like the one to the right. This
resource is available here:
Example of plot locations in a 41 - 80 acre stand.
https://www.nnrg.org/wp-
content/uploads/2015/02/NCF-Inventory-Monitoring-Guidelines.pdf
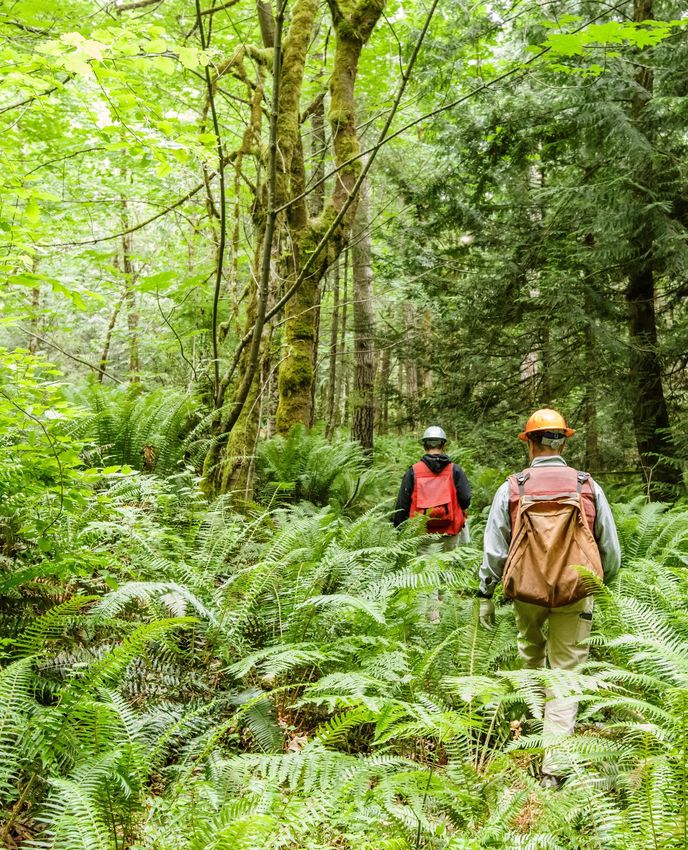
These two stands within the same forest have very different densities (TPA) and require different plot sizes.
5FIELD DATA COLLECTION
You are now ready to head into the field and conduct the inventory. Be sure you have the
following:
1. Aerial photo, GPS, and/or smartphone maps
2. Plot data cards, notebook and pencils
3. The required field equipment listed in the Equipment List
Locate the plots
The two most important factors in locating a plot is identifying an area that is representative of
the stand while avoiding personal bias in plot location. The best way to accomplish this is to
have a predetermined plot map as described above. If you have not prepared a plot location
map, here is a simplified approach to installing plots in a non-biased grid in the field:
1. Choose a location along the edge of the stand that has easy access. From the stand
edge, travel on a straight compass bearing to a location that is 100 feet from the stand
edge. This location is plot center for the first plot. This distance can be abbreviated if the
stand is small or narrow, or increased if the stand is larger.
2. Subsequent plots should then be located on a grid using straight compass bearings from
the initial plot. Determine a distance between plots that will result in your
predetermined number of total plots and will cover the entire stand. Walk this grid
pattern, stopping at the chosen distance to establish each plot.
Mark plot center
Temporary plots
Mark plot center with any
method that will reliably
maintain an easy-to-find plot
center while you collect data,
like hanging flagging from a
shrub or tree branch or
Left: Mark plot center with rebar topped with PVC and flagging noting the plot’s
scuffing the forest floor to identification number. Right: Label trees with pre-numbered tags in a permanent plot.
6expose bare soil. If you are working alone, inserting an 18” piece of re-bar in the ground at plot
center can be helpful to hold a measuring tape while measuring out distances from plot center.
You can remove the rebar and re-use it on every plot. In case you need or want to return to the
plot in the near future, hang flagging nearby so it is visible and write the plot number and date
on the flagging.
Permanent plots
Drive a two-foot piece of rebar into the ground at
plot center and place a PVC pipe over it. Hang
bright flagging from the tip of the PVC pipe, and
label the pipe with the appropriate plot
identification number. If using GPS, record the
location of the plot center. Tag each tree with a
pre-numbered tag facing plot center. The first
tree tagged should be the first tree east of due
north (from plot center); proceed in a clockwise
direction marking all remaining trees. Place tree
number tags at DBH height on the tree bole,
facing plot center. You may also choose to place a
tree number tag at the base of the tree, 10” off
the ground, so the stumps can be identified after
thinning operations.
Photo: Matt Freeman-Gleason
Photo: Matt Freeman-Gleason
7Record Plot data
Plot data
Using your plot data card (Appendix 1), enter the following Species Code
plot data (data in bold is required): Alaska Yellow Cedar YC
Aspen AS
1. Date: record the date when the data was collected, at Big leaf Maple BM
least to the nearest month and year. Bitter Cherry CH
2. Name (optional): name of data collector(s). Black Cottonwood CW
3. Stand ID: usually expressed as a number, but can be a Douglas-fir DF
name, letter, or other ID, as long as the convention is Engelman Spruce ES
unique to that stand and remains the same wherever Gary Oak GA
“Stand ID” needs to be entered. Grand fir GF
Lodgepole pine LP
4. Stand type (optional): use the two letter tree code in
Noble fir (WH) NF
the table (right) for the most dominant tree species in
Oregon Ash OA
the stand, plus a reference to the age of the stand (e.g. Pacific Crabapple PC
DF, RC - young, mid, mature). Pacific Madrone MD
5. Acres: record the stand’s total acres that you Pacific Silver fir SF
calculated in the office to the nearest tenth of an acre. Pacific Yew PY
6. Age (optional): if you don’t know the age of the stand, Paper Birch PB
this data can come from your tree data if you choose Red Alder RA
to measure age. If you do not measure tree age, Sitka Spruce SS
Western Hemlock WH
estimate the stand’s age by looking at historic
Western Larch WL
photographs on GoogleEarth. This information may
Western Red Cedar RC
also be available in past management records. Western White Pine WP
7. Plot #: a unique number to identify the plot. White fir WF
8. Plot radius: enter the plot radius to the nearest tenth Other OT
of a foot. For instance, a 1/20th acre plot will be Unknown UN
entered as “26.3”.
8Tree data
Find a north bearing from plot center. Start with the northern-most tree and move in a
clockwise direction, measuring all live trees over 3” DBH. If there’s a question about whether a
tree is in or out of the plot, measure the distance from plot center to the center of the tree
perpendicular to plot center. If the majority of its diameter is within the plot, include the tree.
Using your plot data card, enter the following data for each tree in the plot:
1. Tree ID: assign each tree a number. If you’re establishing permanent plots, tag each tree
with that number.
2. Species: use the species codes to right. If you find a species not on this list, enter “OT” for
Other on your plot card, and note the species in the “Notes” field. If you can’t identify the
tree, you can enter “UN” for Unknown. Note, OT and UN will be combined in reports
generated by the Woody Biomass Calculator.
3. DBH: measure the diameter at breast height to the tenth of an inch. For instance: 12.3”.
4. Status: enter L if the tree is alive, or D if the tree is dead.
5. Percent defect (optional): Record defect as a percent of total tree height. For example, if 30
percent of tree is defective and non-merchantable,
enter “30”. This takes practice to observe and
calculate. If you see obvious signs of rot, large
crooks, scars, or cracks on the bole, simply:
estimate the length of the bole affected by the
observed damage, divide it by the total tree height,
and multiply by 100 to produce a rough estimate.
6. Harvest (optional): If you know you will be removing
a tree during a future thinning project, you can
Measuring tree height for a forest
enter “Y” in the Harvest column. This will be inventory Photo: Matt Freeman-
important to generate metrics before and after a Gleason
harvest scenario with the calculator.
7. Height: record total tree height to the nearest foot.
8. Age (optional): You don’t need to measure the age
of every tree within a plot. If the stand composition
is uniform (e.g. even-aged plantation), you may only
need to core one or two trees. If the stand is more
complex (e.g. mixed species/age), you may need to
core several trees in each species and/or age class
to establish an age range. Although age is important
to understand in forest inventories and growth Coring a tree to determine its age
Photo: Matt Freeman Gleason
predictions and analysis, the age of a tree has no
9bearing on the amount of wood volume currently in the tree, and therefore is an optional
measurement when calculating woody biomass.
9. Live crown ratio (optional): Enter LCR as the percent of total tree height which has live,
vigorous branches.
10. Notes (optional): record any unique or notable features about the tree. Notes might include
evidence of wildlife use, type of defect (e.g. forked top, bear damage), disease or insects,
etc.
a. If there are multiple trees of the same species that have the same diameter and
height, you can record all of them in one line on your plot card and write the number
of similar trees in the “Notes” field to save time and space. This number can then be
entered in the calculator’s “Count” column, and the calculator will multiply these
trees for you and present their combined totals in the subsequent reports.
b. During thinning operations, trees that are suppressed or have a defect are more likely
to be harvested. If your inventory goals include calculating potential harvest volumes,
note which trees are suppressed or defective so you can identify this tree later when
analyzing your data under different harvest scenarios. You can also use the “Harvest”
column (#6 on this list) for this function. Keep in mind that retaining a few trees that
have signs of defect can enhance structural complexity and wildlife habitat.
10
Photo: Matt Freeman-Gleason
nnnnOFFICE ANALYSIS
Once you complete the field portion of the inventory, you are ready to use NNRG’s Woody
Biomass Calculator to synthesize your data. The calculator can be used on any computer that
runs Microsoft Excel. The calculator allows you to convert simple forest inventory data into
woody biomass volumes, expressed in both tons and board feet.
This calculator determines the volume of biomass in a tree using generalized algorithms that
express averages for each species and should not be relied on when highly accurate
measurements are required for timber cruising or appraisals.
Get Familiar with the Calculator
1. Open the calculator by double-clicking on the file. The calculator should open to the
“Instructions” tab. If it doesn’t, click once on this tab to open.
2. Save a new copy of the calculator before you begin entering data. This is highly
recommended to ensure you retain a clean copy of the original in case an edited
version becomes corrupted.
3. Familiarize yourself with the cell color-coding scheme. It is critical to the functioning of
this calculator that data only be entered or altered in the appropriate cells. If data is
added or altered in any orange cell, the calculator may not function correctly. Be sure to
only enter data in a green (required) or gray (optional) cell.
Enter data
Do not enter Required User
data Input
Autocalculated Optional User
Input
4. Next, click on the Stand, Tree, Plot, and Merchantability tabs respectively to familiarize
yourself with the data that will need to be manually entered. Only enter data into cells
colored either green or gray.
5. Next, click on the following tabs and familiarize yourself with the variety of reports that
will automatically populate with summarizing data once you’ve completed entering your
forest inventory data: Plot, Stand, Species, MBF, Biomass.
6. Finally, review the Stand Table tab. This is a simple worksheet you can use to determine
how many trees per acre there are within pre-defined DBH ranges (e.g. 5”-10”, 15”-20”,
etc.).
11Entering Data into the Calculator
With your plot data cards handy, you can now enter your forest inventory data into the
calculator.
Stand Tab
This tab records data on all the individual forest stands where inventory plots were installed.
You can transfer the information directly from your plot data card.
Required data:
1. Stand ID
2. Acres (to the nearest tenth of an acre)
3. Plot radius (to the nearest tenth of a foot)
Optional Data
1. Date
2. Name
3. Stand Type
4. Age
5. Log Length: if known, enter the preferred merchantable log length using “Short” for 16
foot long logs and “Long” for 32+ foot logs. The calculator will default to using Long if
nothing is entered in this cell.
Do not enter or change!
Number of Plots: this will populate itself automatically, after the subsequent tabs are
completed.
Tree Tab
This tab records data on each of the trees within each of the inventory plots. Each line is
assigned to a unique tree. Simply transfer the data from your plot data card to the cells in this
tab.
12Required data:
1. Stand ID
2. Plot #
3. Species
4. DBH
5. Status
6. Height
Optional Data
1. Tree ID
2. Count
3. % Defect
4. Live Crown Ratio
5. Harvest
6. Notes
Do not enter or change!
All cells to the right of Column L Photo: Matt Freeman-Gleason
Plot Tab
This tab records data on the number of stands in your forest, and the number of plots per
stand. Each line is assigned to a unique plot in your forest. If a stand has multiple plots, record
the stand number the same for each of the plots (e.g. Stand 1, plot 1; Stand 1, plot 2; Stand 2,
plot 1, etc.).
Required data:
1. Stand ID
2. Plot #
Merchantability Tab
This optional tab allows you to define the parameters of a merchantable tree based on your
own criteria or your knowledge of local markets. This allows you to segregate certain tree
species and certain diameter limits from the total volume of your forest so you can calculate
merchantable volume more precisely.
Optional Data:
1. Merchantable (Y/N): the default in this column is set to “Yes”. You can change it to “No”
if you know the species to not be merchantable.
2. Min DBH (Inches): enter the minimum DBH for what you consider to be a merchantable
tree, to the nearest inch. Minimum diameter could be 10” where markets for either
13pulp logs or chip-and-saw logs are in close proximity, or 12” where mills are further
away and hauling costs are higher.
3. Max DBH (Inches): enter the maximum DBH for merchantable logs to the nearest inch.
This is typically between 30” and 36” depending on available markets. You may also
choose to set the maximum lower if you want to retain all trees over a specified DBH
(e.g. 24”) and want to reflect this harvest strategy in your biomass calculation.
Running the Calculator
NNRG’s Woody Biomass Calculator should automatically update and calculate your data as you
enter it. Therefore, once the Stand, Tree, Plots, and Merchantability tabs have been fully
populated with data, the calculator will automatically update the various Reports tabs. If this
does not happen automatically, simply click the “SAVE” button, and the calculator will run and
update all reports.
Analyzing the Data
NNRG’s Woody Biomass Calculator analyzes a variety of forest stand and timber volume
variables, and summarizes this data in the following five reports: Plot, Stand, Species, MBF,
Biomass.
Note: Do not make changes to any cell within the Reports tabs. Doing so will cause the
calculator to malfunction.
Plot Reports
There are two plot reports: pre-harvest and post-harvest. The Pre-Harvest Report provides a
summary of the inventory data collected within an individual plot, extrapolated out to the acre.
Individual plot data are listed in the “Live Tree Metrics” fields, and the extrapolated data for
each plot is summarized in the “Biomass and Volumes” fields in the respective row for that plot.
The Post-Harvest Report provides this same data excluding trees marked for “Harvest” in the
Tree Tab. In other words, this report shows the volume of timber remaining in the woods
following a timber harvest. If no trees are identified as “Harvest” trees in the Tree Tab, the Pre-
and Post-Harvest Reports will be identical. Biomass volumes in these reports include the
defective trees, whereas timber volume (MBF) excludes the defective percent of the tree.
14The following metrics are included in each Report:
Live Tree Metrics
1. TPA: trees per acre
2. Avg. DBH: average diameter at breast height
3. QMD: quadratic mean diameter
4. BA: basal area (in feet squared at DBH per acre)
5. HDR: height to diameter ratio
6. SDI: stand density index
7. Curtis RD: Curtis relative density
Live Biomass and Volume
1. Gross Biomass Tons / Acre: total tons of biomass per acre, including both live and dead
trees, merchantable and non-merchantable.
2. Merch and Non-merch Stem, Branch and Bark Biomass Tons / Acre: tons of biomass per
acre solely within the stem (trunk), branches, or bark of the merchantable or non-
merchantable trees. Non-merchantable trees are defined within the calculator by
assigning a DBH threshold and/or identifying specific tree species in the Merchantability
Tab.
3. Total Merch Biomass Tons / Acre: total merchantable tons of biomass per acre,
including stem, branches, and bark.
4. Net Merch Volume / Acre (MBF): total volume per acre, in thousand board feet, for the
merchantable logs. This volume only includes the stem for trees within the designated
merchantibility DBH range on the Merchantability tab. This net value also subtracts
defect.
5. Non-Merch Volume / Acre (MBF): total volume per acre, in thousand board feet, for the
non-merchantable logs. The non-merch volume is a measure of the total gross volume
minus the net merchantable volume of the stems only, including defect.
Snag Biomass and Volume
1. Snags / Acre: number of snags per acre, or all the trees marked as “Dead” in the Tree
Tab.
2. Snag QMD: quadratic mean diameter of the snags
3. Snag BA: basal area of the snags
4. Snag Biomass Tons / Acre: total tons of biomass of snags including stems, branches and
bark.
5. Snag Net Merch Volume MBF: total volume of snags in thousand board feet including
stems, bark and branches.
15Stand Report
This report averages all the plots in a stand to present inventory data at the stand level. You can
only calculate this information for one stand at a time. You can choose to combine all plots
within a stand or look at each individual plot. To use the Stand Table, enter the Stand # you
want to analyze, then enter either the plot #, or enter “ALL” to combine all the plots within the
stand.
The metrics are the same as the Plot Reports. If there is only one plot per stand, the data will be
the same in the Stand Report and the Plot Report. The Pre-Harvest averages appear at the top,
scroll down for Post-Harvest averages.
This report shows the post-harvest data for retained trees and summarizes gross biomass and
net merchantable timber volume (MBF).
Species Report
This report summarizes data for each individual tree species at the stand level by averaging all
of the plots within a stand. Only trees per acre (TPA) and basal area (BA) are summarized for
each tree species. The tree species are identified using the two-letter code on page 16.
Volume Report
The Volume Report summarizes timber volume data in both thousand board feet (MBF) and
tons for only the trees defined as merchantable within the stand. The MBF tables summarize
volumes of the stems only, excluding bark and branches, whereas the Tons tables summarize
total volume, including stems, bark and branches. The report summarizes data for each
individual tree species by averaging all the plots within a stand. This report shows that volume
that is retained standing and summarizes gross biomass and net merchantable timber volume
(MBF).
Stand Table
The Stand Table shows the number of trees by species and diameter range in a stand, as well as
the tons of biomass and the volume of board feet also by species and diameter range. Although
this tool can only be used to calculate data for one stand at a time, you can analyze the data
from all of the plots within the stand, or by individual plot. The biomass and board foot volumes
presented in the charts are for the gross volume in the stand minus the trees identified for
harvest in the Tree Tab. Therefore, if you want to analyze total stand volumes, you should not
identify any trees for harvest in the Tree Tab.
16Next Steps
What now? It’s up to you! Adjust the figures in the “Harvest” columns to see how different
harvest scenarios impact the Post-Harvest Report. Use the “merchantable” and “non-
merchantable” outputs to start planning what to do with thinned biomass, from timber sales to
biochar manufacturing. Be sure to check out Appendix 3 for how you can use the Woody
Biomass Calculator to answer common questions like “Is my forest overstocked?”
Now that you know how much woody biomass is in your forest, you can use the information to
inform your management decisions, consider practices to help reach your goals, and get a sense
of reasonable outcomes for your land.
Remember, the methods presented here will not necessarily produce statistically-significant
results, and therefore should not be used for formal appraisals of timber volumes and values. If
you need a more accurate, statistically significant forest inventory please use the following
resources or contact your forester for an official timber cruise:
• NNRG's Forest Inventory & Monitoring Guidelines: http://www.nnrg.org/wp-
content/uploads/2015/02/NCF-Inventory-Monitoring-Guidelines.pdf
• WSU Forestry Extension’s: Basic Forest Inventory Techniques for Family Forest Owners:
http://cru.cahe.wsu.edu/CEPublications/PNW630/PNW630.pdf
Happy plotting!
17
Photo: Matt Freeman-GleasonAPPENDIX 1 – Plot Data Card
Date: Name:
Stand Stand Stand Stand Plot Plot Tree Spp DBH Status Defect Harvest Ht Age LCR Notes
ID Type Acres Age # radius ID (inch) L/D % Y/N (ft) %
18APPENDIX 2 – Glossary
Forest Stand
Refers to sub-portion of a forest that is homogenous in age, structure, species composition
and/or management goals. Your property may be all one stand or may have several different
stands.
Basal area
Basal area (BA) is the cross-sectional area of a tree 4.5 feet above ground. The basal area of all
trees in a given area describes the density of the forest, or the degree to which an area is
occupied by trees. Basal area is generally expressed in square feet per acre (ft 2/acre).
Diameter at breast height
Diameter at breast height (DBH) is the measurement of tree diameter 4.5’ from the ground. On
slopes, the diameter is measured from the uphill side of the tree. For more information on how
to measure DBH: https://www.climate-policy-watcher.org/carbon-stocks/aboveground-
biomass-of-trees.html
Height to diameter ratio
Height to diameter ratio (HDR) refers to the ratio between a tree’s total height and its DBH. To
determine this ratio, divide the tree’s height by the tree’s diameter (converted from inches to
feet). This ratio is used to determine how vulnerable a tree is to bending, storm breakage, or
other related defect. A general rule of thumb is that if the height to diameter ratio exceeds 80,
the tree is highly susceptible to damage.
Live crown ratio
Live crown ratio (LCR) is the percent of a tree’s total height that still retains live, green
branches. For instance, in a very dense, young Douglas-fir stand, LCRs could average less than
30% of total tree height. The live crown ratio of a tree is a tree health metric and has no bearing
on the amount of wood volume currently in the tree, and is therefore an optional measurement
for calculating woody biomass.
Quadratic mean diameter
Quadratic mean diameter (QMD) is the measure of average tree diameter related to basal area,
which is more accurate than arithmetic mean diameter.
19Relative density
Relative density (RD) or Curtis relative density is a quantification of the current density of a
forest stand (e.g., basal area or stand density index) in comparison to some maximum level.
Stand density index
Stand density index (SDI) has been proposed as a technique for estimating the RD of forests at
large scales where uneven-aged and mixed species stands are typical. SDI is a stand density
assessment tool based on the size-density relationships observed in fully stocked pure or nearly
pure stands. A stand’s maximum SDI is defined as the maximum density (trees per hectare) that
can exist for a given mean tree size (25 cm) in a self-thinning population.
Thousand board feet
A thousand board feet (MBF) is the standard unit of measure for the volume of timber either
standing in the forest or as saleable logs.
Trees per acre (TPA)
Trees per acre (TPA) is the measure of the number of individual trees, growing or dead, on an
acre of land. For calculating timber volume, this number typically only reflects tree >5.9” DBH.
20APPENDIX 3 – From Data Analysis to Forest
Management: Common Questions
If you’re not familiar with the various forest inventory metrics generated by the calculator, then
the results may seem rather abstract. It may be difficult to translate them to what you’re seeing
in your woods, let alone to make management decisions based on them. Listed below are a
series of questions you can ask yourself about the trees in your forest, with guidance for using
the Woody Biomass Calculator to help answer them.
Is my forest overstocked?
The appropriate stocking density of your forest depends on many factors, including tree
species, tree age, tree size, soil type, and management objectives. Given that every site and
landowner are unique, optimal stocking densities will vary. Seek the opinion of a professional
forester before making significant management decisions to ensure that your objectives are
aligned with the natural potential of the forest.
The following chart has been extrapolated from the Natural Resources Conservation Service
program in Washington’s Technical Note 10: Forest Stand Density Guide. This chart details the
optimal distance between trees and total trees per acre for the most common trees west of the
Cascade Mountains, based on the tree’s DBH.
Shade Tolerance Species Reforestati Young Stand Older Stand
Class on Density Density Density (>10”
(2-9” DBH) DBH) Thin To:
Thin to:
Very Shade Subalpine fir 9’ x 9’ 9’ – 11’
Tolerant Pacific silver fir or or D+3
Western red cedar 538 TPA 360-538 TPA (see below)
Shade Tolerant Western hemlock 10’ x 10’ 10’ – 12’
Sitka spruce or or D+4
Grand fir 436 TPA 302-436 TPA (see below)
Moderately Shade Douglas-fir 11’ x 11’ 11’ – 13’
Tolerant (Coastal) or or D+5
360 TPA 258-360 TPA (see below)
21Moderately Shade Ponderosa pine 12’ x 12’ 12’ – 14’
Intolerant Western white pine or or D+6
302 TPA 222-302 TPA (see below)
Shade Intolerant Red alder 13’ x 13’ 13’ – 15’
Western larch or or D+7
Lodgepole pine 258 TPA 194-258 TPA (see below)
Black Cottonwood
Using the Woody Biomass Calculator
1. In the Stands Report in the Woody Biomass Calculator, look up the TPA for a particular
stand.
2. If the stand is young (DBH 10”), then use the D+ 16’ 170
formula, where D = the average DBH in the stand, and 17’ 150
the corresponding number of inches in the chart are 18’ 130
added to determine the optimal average spacing in 19’ 120
feet. For instance, if the average diameter of a 20’ 110
Douglas-fir stand is 11”, then 11+3 = an average 21’ 100
spacing of 14’ between trees. 22’ 90
4. NOTE: When thinning a stand, it is important to not 23’ 80
adhere to a strict spacing between trees. Instead, 24’ 70
favor the most dominant and highest quality trees for
retention, and thin out other trees to achieve the average spacing over the entire stand.
The chart below shows what average distance between trees means in TPA.
5. You can further analyze stand composition by using the Stand Table and reviewing how
many trees are in each diameter class. If the age of your stand is higher (>40 years), and
the stocking density of your forest is either within or exceeds the Young Stand Density
range in the Stand Density Table above, and the majority of the trees are in the 5-10
inch diameter class – your stand is overstocked.
22How can I increase species diversity in my forest?
A forest’s species diversity correlates strongly with structural diversity, forest resilience, and
overall health. The main opportunities forest landowners have to manage species composition
are during stand establishment (i.e. what species and how many trees to plant) and during
thinning operations (i.e. what species to retain and how many of each).
Choosing which trees to harvest during any thinning operation has many variables: individual
tree vigor, crown health, tree spacing, and tree species, among other factors. You can use the
Woody Biomass Calculator to identify species that are underrepresented in the stand, and
prioritize these trees for retention. For example, you might have a stand comprised primarily of
Douglas-fir trees, with a few red alder, western hemlock or red cedar trees scattered
throughout the stand. You may choose to thin very few, or none at all, of these
underrepresented species and focus on selecting Douglas-fir for harvest.
Using the Woody Biomass Calculator
1. In the Species Report tab, look up the TPA and BA of the different species for a
particular stand. This can give you a general idea of the dominant tree species in the
stand, by number of stems.
2. In the Volume Report tab, look up the Volume per acre, by species. This will reveal the
dominant tree species by biomass volume. Both numbers are important.
a. For example, you may have a main 40-year-old Douglas fir stand that has
hundreds of western hemlock saplings in the understory. By simply looking at
the TPA in the Species Report, you may decide that western hemlock is
dominant. The Volume Report will reveal that Douglas-fir is in fact dominant
because of its volume.
3. These reports will help you determine which species are underrepresented in the stand,
and you can choose to prioritize these species for retention when selecting which trees
to harvest, or replanted with underrepresented species following harvest.
How do I determine the volume of non-merchantable timber that I
have that can be converted to biochar, firewood or other uses?
What you define as non-merchantable timber will be subjective to your forest, how you choose
to thin your stand, and available markets. Non-merchantable timber may include trees below a
certain DBH (e.g. 25%), certain species, etc. You
can define non-merchantable timber in the Woody Biomass Calculator using either of the
following methods:
23Defining non-merchantable trees in the calculator:
1. In the Tree tab, enter percent of defect in Column H for a particular tree.
2. In the Merchantability tab, identify the species that are not merchantable, as well as the
DBH threshold below and above which the tree is considered merchantable.
Using the Pre-Harvest Plot Report, the Live Biomass and Volume section summarizes the total
non-merchantable volume of biomass in stem, branches and bark of the trees. Volume of stems
can be converted to cords of firewood using conversions you find online for the tree species.
The combined volume of non-merchantable stems, branches and bark can give you a starting
point for how much green biomass you have that can be converted to biochar or other uses.
Selecting non-merchantable trees for harvest in the calculator:
1. In the Tree tab, using Column H, mark Y for any tree you intend to harvest for means
other than selling logs.
2. In the Merchantability tab, identify the species that are not merchantable, as well as the
DBH threshold below and above which the tree is considered merchantable.
Using the Stand Report, compare the various Non-merchantable estimates (Columns Q –T, & X)
in the Pre-Harvest Stand section to the same numbers in the Post-Harvest Stand Section.
Subtracting Post-Harvest Stand volumes from Pre-Harvest Stand volumes will yield the volume
of non-merchantable biomass you plan to harvest.
Can I use the calculator to estimate potential revenue for a harvest?
The Woody Carbon Calculator is not intended for formal or informal timber appraisals. It is
intended for woody biomass volume estimates to help guide management decisions. Timber
appraisals require a high degree of expertise in merchandising timber, harvest operations, and
local log markets, along with a statistically valid analysis of the timber cruise.
If you wish to develop a timber sale appraisal, reach out to your forester for more information.
24NNRG’s mission is to strengthen the ecological and economic vitality of
Northwest forests and communities by connecting landowners
with the knowledge, skills, and markets they need to steward their forests.
2701 1st Ave, Suite 240
Seattle, WA 98121
info@nnrg.org
206.971.3709
This project was made possible with generous support from the
USDA’s Risk Management Agency:
25You can also read