Housing Production Plan - TOWN OF WEST NEWBURY 2018-2022
←
→
Page content transcription
If your browser does not render page correctly, please read the page content below
TOWN OF WEST NEWBURY

Housing
Production Plan
2018-2022

PREPARED FOR:
Town of West Newbury
381 Main Street
West Newbury, MA 01985

PREPARED BY:
Merrimack Valley Planning Commission
with assistance by JM Goldson community preservation + planning
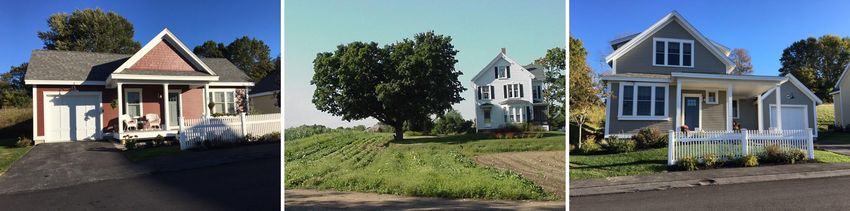
TABLE OF CONTENTS

CHAPTER 1: INTRODUCTION                                                              8
BACKGROUND AND PURPOSE                                                                8
COMMUNITY OVERVIEW AND FINDINGS                                                       9

CHAPTER 2: DEMOGRAPHIC PROFILE                                                      11
KEY FINDINGS                                                                         11
POPULATION AND HOUSEHOLD TRENDS                                                      12
HOMELESSNESS CHARACTERISTICS                                                         24
ECONOMIC CHARACTERISTICS                                                             26

CHAPTER 3: LOCAL HOUSING CONDITIONS                                                 28
KEY FINDINGS                                                                         28
HOUSING SUPPLY AND VACANCY TRENDS                                                    29
PERMITTING ACTIVITY                                                                  32
OWNER-OCCUPIED HOUSING CHARACTERISTICS                                               33
RENTER-OCCUPIED HOUSING CHARACTERISTICS                                              36
HOUSING AFFORDABILITY                                                                39

CHAPTER 4: HOUSING DEVELOPMENT CONSIDERATIONS                                       44
ENVIRONMENTAL CONSTRAINTS                                                            44
HISTORIC AND CULTURAL RESOURCES                                                      46
INFRASTRUCTURE CAPACITY                                                              46
REGULATORY BARRIERS                                                                  49

CHAPTER 5: HOUSING GOALS AND STRATEGIES                                             54
FIVE-YEAR GOALS                                                                      54
STRATEGIES                                                                           55
ACTION PLAN                                                                          62

APPENDIX A                                                                          65
HUD INCOME LIMITS FY2017                                                             65

APPENDIX B                                                                          66
DHCD AFFIRMATIVE FAIR HOUSING MARKETING GUIDELINES                                   66

                              TOWN OF WEST NEWBURY HOUSING PRODUCTION PLAN 2018-2022 • 2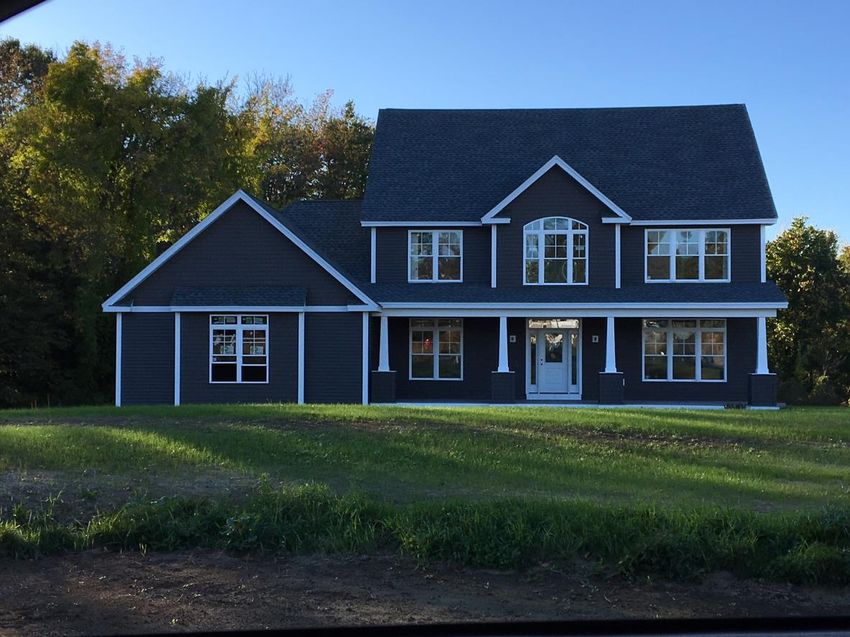
APPENDIX C                                                                             67
INTERAGENCY BEDROOM MIX POLICY                                                          67

APPENDIX D                                                                             69
COMPREHENSIVE PERMIT DENIAL AND APPEAL PROCEDURES                                       69

APPENDIX E                                                                             70
SUBSIDIZED HOUSING INVENTORY                                                            70

APPENDIX F                                                                             72
UNRELATED INDIVIDUALS BELOW FEDERAL POVERTY THRESHOLDS BY AGE, 2015                     72

APPENDIX G                                                                             73
COST BURDENED RENTERS AND OWNERS BY HOUSEHOLD TYPE                                      73

APPENDIX H                                                                             76
COURBANIZE COMMENTS FROM THE TOWN OF WEST NEWBURY                                       76

APPENDIX I                                                                             77
POTENTIAL AFFORDABLE HOUSING RANKING CRITERIA (FROM BELMONT OPEN SPACE
AND HOUSING INVENTORY PROJECT)                                                          77

LIST OF TABLES
    Change in West Newbury Household Characteristics, 2000-2015                         14
    West Newbury Racial and Ethnic Characteristics, 2000-2015                           16
    Disability by Age, 2015                                                             18
    Geographic Mobility, 2015                                                           20
    Household Types, 2015                                                               20
    Households by Tenure, 2015                                                          21
    Household Size, 2015                                                                21
    Household Income Distribution, 2015                                                 22
    Median Income, 2015                                                                 22
    Median Income by Tenure, 2015                                                       23
    Population in Households Below Federal Poverty Thresholds by Age, 2015              24
    Homelessness Count in the North Shore, 2015-2017                                    25
    Economic Sectors, 2015                                                              26
    Travel Time to Work, 2015                                                           26

                                 TOWN OF WEST NEWBURY HOUSING PRODUCTION PLAN 2018-2022 • 3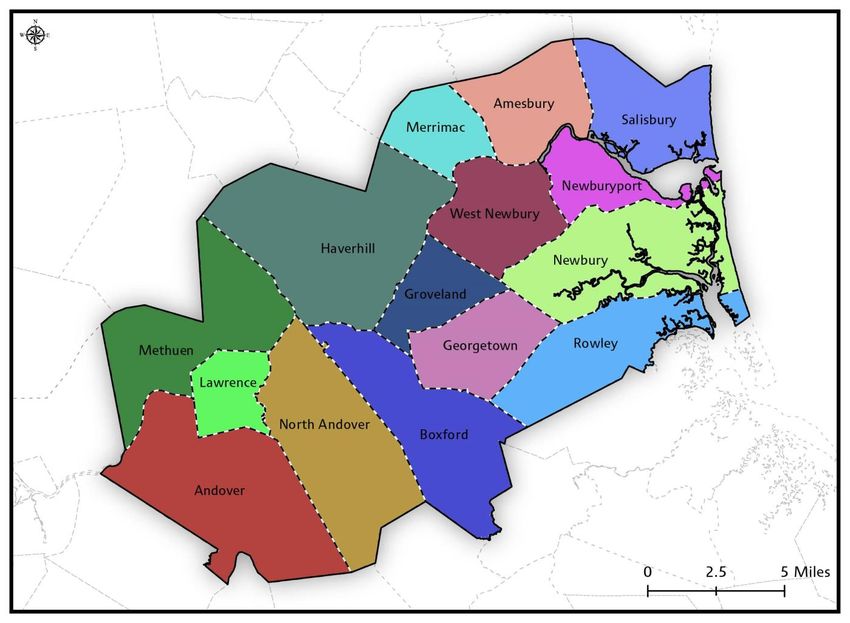
Educational Attainment, 2015                                                        27
Occupancy, Vacancy, and Tenure, 2015                                                29
West Newbury Residential Land Use by Parcel, 2017                                   30
West Newbury Units in Structure, 2017                                               30
Age of Housing, 2015                                                                31
Tax Rates and Average Tax Bills, FY2017                                             32
West Newbury Residential Building Permit Activity, 2000-2015                        32
Owner by Year Moved into Unit, 2015                                                 33
Owner by Age of Householder, 2015                                                   33
Owners by Household Income, 2016                                                    34
Owner-Occupied Units by Value, 2015                                                 35
Median Sales Price: 1997-2017                                                       35
Renter by Year Moved into Unit, 2015                                                36
Renter by Age of Householder, 2015                                                  37
Renters by Household Income, 2015                                                   37
Renter Households by Gross Rent per Month 2015                                      38
Household Income Distribution Overview, 2014                                        40
Cost Burdened Renters and Owners in West Newbury (all incomes ranges), 2014         40
Cost Burdened Renters and Owners in West Newbury by Income Range, 2014              40
Cost Burdened Renters in West Newbury by Income Range, 2014                         41
Cost Burdened Owners in West Newbury by Income Range, 2014                          41
Rent Affordable to Two-Person Households by Income Limit 2017                       43
Affordable Units by Type                                                            43
Wetland Resource Types in West Newbury                                              45
Potential Housing Development Locations and Environmental Constraints in West
Newbury                                                                             52
Chapter 40B Housing Production Schedule – 0.5% and 1% Growth*                       54
Housing Production Growth Schedule to Achieve 10%                                   55
Cost Burdened Renters and Owners                                                    73
Cost Burdened Renter Households                                                     74
Cost Burdened Owner Households                                                      75

                             TOWN OF WEST NEWBURY HOUSING PRODUCTION PLAN 2018-2022 • 4
Acronyms
ACS             US Census Bureau’s American Community Survey
AMI             Area Median Income
DHCD            MA Department of Housing and Community Development
MVPC            Merrimack Valley Planning Commission
MOE             Margins of Error

Key Definitions
The following definitions are for key terms used throughout the document and are based on information from the
U.S. Census Bureau, unless otherwise noted:

ACS – American Community Survey, conducted every year by the United States Census Bureau.
Affordable Housing – Housing that is restricted to individuals and families with qualifying incomes and asset levels
and receives some manner of assistance to bring down the cost of owning or renting the unit, usually in the form
of a government subsidy, or results from zoning relief to a housing developer in exchange for the income-
restricted unit(s). Affordable housing can be public or private. The Massachusetts Department of Housing and
Community Development (DHCD) maintains a Subsidized Housing Inventory (SHI) that lists all affordable housing
units that are reserved for households with incomes at or below 80 percent of the area median income (AMI)
under long-term legally binding agreements and are subject to affirmative marketing requirements. The SHI also
includes group homes, which are residences licensed by or operated by the Department of Mental Health or the
Department of Developmental Services for persons with disabilities or mental health issues
Comprehensive Permit – a local permit for the development of low- or moderate- income housing issued by the
Zoning Board of Appeals pursuant to M.G.L. c.40B §§20-23 and 760 CMR 56.00.
Cost Burdened – Households who pay more than 30 percent of their income for housing.
Disability – The American Community Survey defines disability as including difficulties with hearing, vision,
cognition, ambulation, self-care, and independent living. All disabilities are self-reported via the 2011-2015
American Community Survey. Disability status is determined from the answers from these six types of disability.

            ▪   Independent Living: People with independent living difficulty reported that, due to a physical, mental, or
                emotional condition, they had difficulty doing errands alone.
            ▪   Hearing: People who have a hearing disability report being deaf or as having serious difficulty hearing.
            ▪   Vision: People who have a vision disability report being blind or as having serious difficulty seeing even
                when wearing glasses.
            ▪   Self-Care: People with a self-care disability report having difficulty dressing or bathing.
            ▪   Ambulatory: People who report having ambulatory difficulty say that they have serious difficulty walking or
                climbing stairs.
            ▪   Cognitive: People who report having a cognitive disability report having serious difficulty concentrating,
                remembering, or making decisions.

Income Thresholds – The Department of Housing and Urban Development (HUD) sets income limits that determine
eligibility for assisted housing programs including the Public Housing, Section 8 project-based, Section 8 Housing
Choice Voucher, Section 202 housing for the elderly, and Section 811 housing for persons with disabilities
programs. HUD develops income limits based on Median Family Income estimates and Fair Market Rent area
definitions for each metropolitan area, parts of some metropolitan areas, and each non-metropolitan county. The
most current available income thresholds are provided in the appendices. Definitions for extremely low, very low,
and low/moderate income are provided below.

                                           TOWN OF WEST NEWBURY HOUSING PRODUCTION PLAN 2018-2022 • 5
▪    Extremely Low Income (ELI) – HUD bases the ELI income threshold on the FY2014 Consolidated
                 Appropriations Act, which defines ELI as the greater of 30/50ths (60 percent) of the Section 8 very low-
                 income limit or the poverty guideline as established by the Department of Health and Human Services
                 (HHS), provided that this amount is not greater than the Section 8 50 percent very low-income limit.
            ▪    Very Low Income (VLI) – HUD bases the VLI income threshold on 50 percent of the median family income,
                 with adjustments for unusually high or low housing-cost-to-income relationships.
            ▪    Low/Moderate Income (LMI) – HUD bases the LMI income threshold on 80 percent of the median family
                 income, with adjustments for unusually high or low housing-cost-to-income relationships.

Family – A family is a group of two people or more (one of whom is the householder) related by birth, marriage, or
adoption and residing together; all such people (including related subfamily members) are considered as
members of one family.
Household – A household includes the related family members and all the unrelated people, if any, such as lodgers,
foster children, wards, or employees who share the housing unit. A person living alone in a housing unit, or a
group of unrelated people sharing a housing unit such as partners or roomers, is also counted as a household.
The count of households excludes group quarters.
Median Age – The age which divides the population into two numerically equal groups; that is, half the people are
younger than this age and half are older.
Median Income – Median income is the amount which divides the income distribution into two equal groups, half
having incomes above the median, half having incomes below the median. The medians for households, families,
and unrelated individuals are based on all households, families, and unrelated individuals, respectively. The
medians for people are based on people 15 years old and over with income.
Millennials – The demographic cohort following Generation X. There are no precise dates when the generation
starts and ends. Researchers and commentators use birth years ranging from the early 1980s to the early 2000s.
(en.wikipedia.org/wiki/millennials.)
Housing Unit – A housing unit is a house, an apartment, a mobile home or trailer, a group of rooms, or a single
room that is occupied, or, if vacant, is intended for occupancy as separate living quarters.
Poverty – Following the Office of Management and Budget’s (OMB’s) Directive 14, the Census Bureau uses a set of
money income thresholds that vary by family size and composition to detect who is poor. If a family’s total income
is less than that family’s threshold, then that family, and every individual in it, is considered poor. The poverty
thresholds do not vary geographically, but they are updated annually for inflation with the Consumer Price Index
(CPI-U). The official poverty definition counts money income before taxes and excludes capital gains and noncash
benefits (such as public housing, Medicaid, and food stamps).
Subsidized Housing Inventory – The state’s official list for tracking a municipality’s percentage of affordable housing
under M.G.L. Chapter 40B (C.40B). This state law enables developers to request waivers to local regulations,
including the zoning bylaw, from the local Zoning Board of Appeals for affordable housing developments if less
than 10 percent of year-round housing units in the municipality is counted on the SHI. It was enacted in 1969 to
address the shortage of affordable housing statewide by reducing barriers created by local building permit
approval processes, local zoning, and other restrictions.
Tenure – Tenure identifies a basic feature of the housing inventory: whether a unit is owner occupied or renter
occupied. A unit is owner occupied if the owner or co-owner lives in the unit, even if it is mortgaged or not fully
paid for. A cooperative or condominium unit is "owner occupied" only if the owner or co-owner lives in it. All
other occupied units are classified as "renter occupied," including units rented for cash rent and those occupied
without payment of cash rent.

                                           TOWN OF WEST NEWBURY HOUSING PRODUCTION PLAN 2018-2022 • 6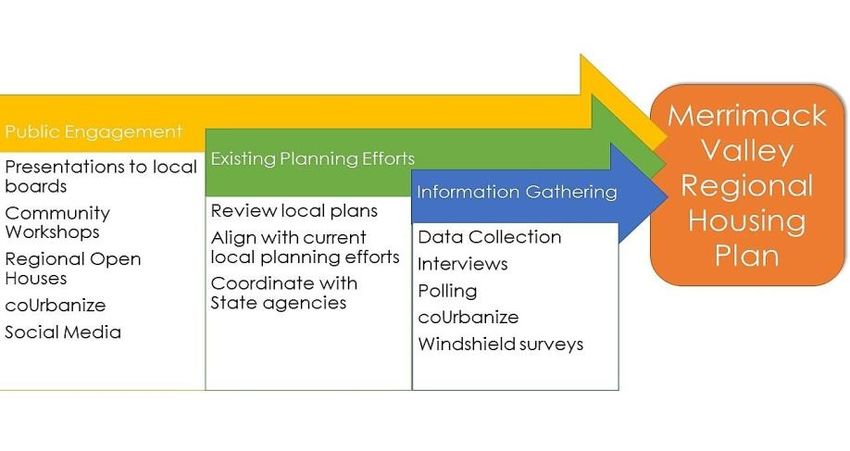
Merrimack Valley Region
West Newbury is part of the Merrimack Valley Region consisting of 15 municipalities in the northeastern portion
of Massachusetts that are connected by a common, natural thread – the Merrimack River.

Amesbury                                                    Methuen
Andover                                                     Newbury
Boxford                                                     Newburyport
Georgetown                                                  North Andover
Groveland                                                   Rowley
Haverhill                                                   Salisbury
Lawrence                                                    West Newbury
Merrimac

                                       TOWN OF WEST NEWBURY HOUSING PRODUCTION PLAN 2018-2022 • 7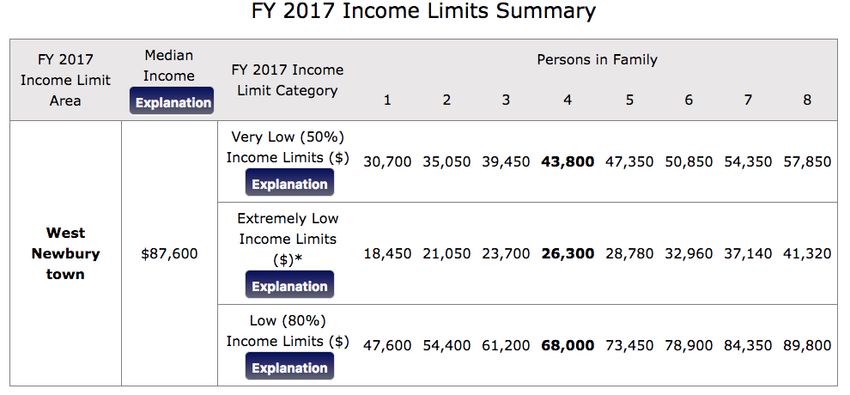
Chapter 1: Introduction
Background and Purpose
In 2017, the Merrimack Valley Planning Commission (MVPC) was awarded funds from the Commonwealth
Community Compact Cabinet and MassHousing to develop the first Regional Housing Plan for the Merrimack
Valley. The goal for the plan is to develop a strategy for meeting the housing needs of today and tomorrow’s
residents in the region. Using current data, populations projections, and state-of-the-art mapping, MVPC worked
collaboratively with each community in the region to understand their housing needs, set goals, and
craft appropriate, tailored strategies that address their specific needs over the next five years. The final deliverable
for this project is a Regional Housing Plan, with chapters that serve as housing production plans for each of the 15
communities in the Merrimack Valley, including the Town of West Newbury. MVPC worked with West Newbury
throughout 2017, to collect data, understand local housing conditions and needs, and develop strategies that will
meet the needs of residents today and in the future. The result is a comprehensive analysis, set of strategies and
user-friendly implementation plan for the Town to follow over the next five years to develop housing for all.

This Housing Production Plan is intended to be a dynamic, living guide for housing production in West Newbury.
It should be regularly consulted by the various stakeholders identified in the Housing Action Plan, and used as a
tool for planning, especially as new resources become available, legislation is passed, or funding opportunities are
created. It is recommended that the Town report regularly on progress achieved to celebrate West Newbury’s
housing accomplishments.

PLAN METHODOLOGY
MVPC created a three-tiered process to
develop the Merrimack Valley Regional
Housing Plan and the West Newbury
Housing Production Plan consisting of:
1) Public Engagement; 2) Align with
Existing Planning Efforts; and 3)
Information Gathering. Each of these
steps helped to ensure that West
Newbury’s plan is comprehensive,
inclusive, and respectful of existing
local, regional and state-wide planning
efforts.

    1) Public Engagement: MVPC worked with the Town to facilitate in-person and virtual opportunities to
       engage stakeholders in West Newbury in developing the Housing Production Plan (HPP). The in-person
       opportunities included two workshops; the first workshop was held in May 2017 to understand local
       housing needs, and the second workshop was held in November 2017 to identify potential housing
       locations and strategies to meet housing needs. Virtual opportunities consisted of social media posts and
       the use of the web-based tool coUrbanize to engage people that did not attend in-person workshops.
       The coUrbanize comments collected from West Newbury can be found in the Appendix.
    2) Align with Existing Planning Efforts: MVPC worked alongside Town Planner Leah Zambernardi and
       stakeholders to ensure that the HPP goals and strategies were consistent with existing planning efforts,

                                          TOWN OF WEST NEWBURY HOUSING PRODUCTION PLAN 2018-2022 • 8
including the existing Master Plan and Open Space and Recreation Plan. The Environmental
Considerations, Strategies and Action Plan Sections reflect that effort.
3) Information Gathering: Numerous sources were consulted to develop the HPP. The U.S. Census Bureau’s
Decennial censuses of 2000 and 2010 and the 2010-2014 and 2011-2015 American Community Surveys
(ACS) were the primary sources of data for the needs assessment. The U.S. Census counts every resident in
the United States by asking ten questions, whereas the ACS provides estimates based on a sample of the
population for more detailed information. It is important to be aware that there are margins of error
(MOE) attached to the ACS estimates, because the estimates are based on samples and not on complete
counts. The Plan also uses data from a variety of other available sources including: The Warren Group;
Massachusetts Departments of Education and Transportation; DHCD; and UMass Donahue Institute.
The housing needs assessment, which is included in the Demographic Profile and Housing Conditions sections,
contains comparison data for a variety of geographies. Many data sets offer comparisons of the town to the
region, county and the state, and some offer comparisons to other communities in the region.
Community Overview and Findings
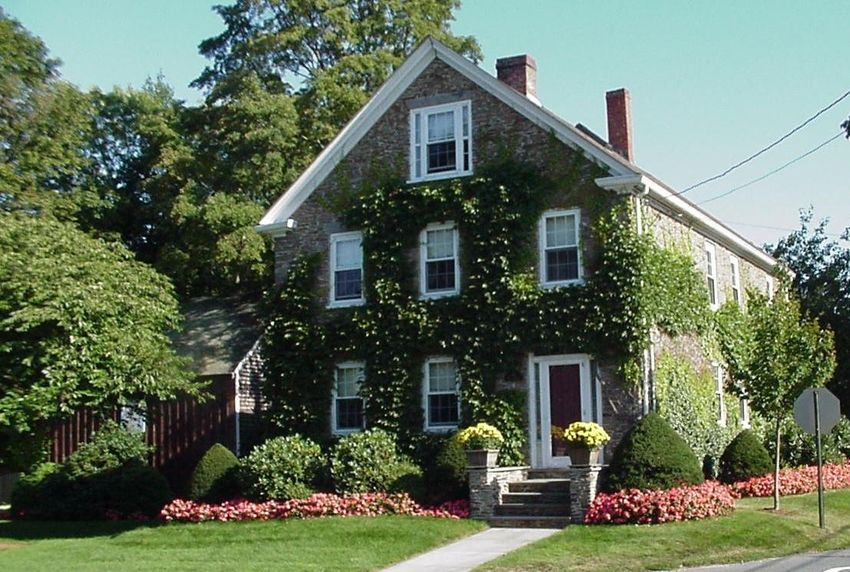
West Newbury is located approximately 35 miles north of Boston on the eastern edge of the Merrimack Valley
region. Encompassing an area of roughly 14 square miles, it is bordered on the north and west by the Merrimack
River, on the east by Newburyport, and on the south by Newbury and Groveland. West Newbury is primarily a
semi-rural residential community that once boasted many working farms. Today, as old agricultural fields are sold
to developers, the Town is becoming increasingly suburbanized. Since the early 1990s, West Newbury lost a great
deal of open space – particularly along the Merrimack River and off of Route 113 (Main Street) – to new housing
developments. In fact, the northwestern quadrant of the town was classified as “urban” as a result of the 2000 U.S.
Census, but this is due to its proximity to the more densely developed Haverhill.
The population in West Newbury is shifting. Between 2000 and 2015, West Newbury’s population and households
grew, with population increasing from 4,149 to 4,427 and households increasing 9.1 percent, which is twice as fast
as Essex County and the state. However, this growth is not projected to continue, especially for population.
Projections indicate a decline in West Newbury’s population by about 470 people from 2010 to 2035. However, if
average household size continues to decline, the effect of the population decrease on housing demand may be
minimized. For example, if housing size continues to decline at a similar rate as estimated between 2000 and 2015,
by 2035 the average household size would be about 2.88 persons per household, which would generate about
1,307 households, about 211 less than the 2015 estimated number of households.
The age composition of West Newbury’s population is also changing. The number of older adults (65+) is
anticipated to increase from 13.6 to 33.7 percent while agesWith these shifts come the need to evaluate how to accommodate changing populations and preferences. The
next section focuses on the current and projected future needs of West Newbury’s residents.
TOWN OF WEST NEWBURY HOUSING PRODUCTION PLAN 2018-2022 • 10Chapter 2: Demographic Profile
Key Findings
▪ The number of households in West Newbury grew by about 9 percent from 2000 to 2015 – a larger
percentage than population growth in the same period due to the decrease in average household size.
Projections indicate a population decline in the coming years and a potential need for decreased housing
units overall. If the average household size continues to decline, the effect of population decrease on
housing demand may be minimized.
▪ The projected decline in population may also indicate less demand for large single-family homes on large
lots. The development of more housing types may attract more families and minimize the population
decline.
▪ The composition of West Newbury households has also changed. The number of households with
children under 18 years old decreased and single-person households increased. Projections anticipate a
significantly greater percentage of older adults and even less children in the coming years. The growing
number of single-person households and older adults may indicate a greater need for more housing
options such as multi-family apartments, condominiums, and supportive housing options and less need
for single-family houses.
▪ The region is becoming more racially diverse, and yet West Newbury remains racially homogenous. A
greater diversity of housing stock in West Newbury may help to boost racial and ethnic diversity. Because
racial and ethnic minorities generally have less wealth and lower income than white, non-Hispanic/Latino
populations and multi-family and rental units can provide less expensive housing options, communities
with lower stock of these types of units often also have less racial and ethnic population diversity.
▪ West Newbury’s population has lower disability rates than the region, and while it is more common for
older adults to have disabilities in general, West Newbury has a lower proportion of its older population
reporting disabilities than in the region. However, there is still an estimated 28 percent (about 168) of
older adults age 65 years and over with disabilities. Persons with disabilities, whether physical, mental, or
emotional, can have special housing needs including accessible units and supportive services.
▪ West Newbury’s households have significantly higher median income than households in the region, with
renters having lower income than owners, as is typical. Poverty rates in West Newbury are significantly
lower than in the region.
▪ About 93 percent of West Newbury households own and only 7 percent rent their home, which is a much
higher estimated percentage of owner households than in the region overall (63 percent).
TOWN OF WEST NEWBURY HOUSING PRODUCTION PLAN 2018-2022 • 11Population and Household Trends
POPULATION AND HOUSEHOLD CHANGE
West Newbury’s estimated population per the 2015 American Community Survey (ACS) is 4,427 people – a growth
of about 6.7 percent from 2000. The population of Massachusetts (state) and Essex County (county) both
increased about 5.6 percent between 2000 and 2015. The estimated population of the region increased 8.75
percent in the same period.
The number of households in West Newbury grew about 9 percent – a larger growth
than population growth in the same period due to the decrease in average household
size from 2.98 persons per household to an estimated 2.91 persons per household.
Household Growth 2000-2015
Source: US Decennial Census 2000; American Community Survey 2011-2015
25.00%
21.4%
20.00%
15.9%
15.00% 13.2% 13.3%
11.4% 11.8%
10.6%
10.00% 9.1%
8.3%
7.1% 7.7%
5.6% 5.6%
4.3% 4.5%
5.00% 3.5%
.5%
0.00%
Average family size also decreased from 3.25 persons per household in 2000 to about 3.21 persons per household
in 2015. A trend of decreasing household size is counter to trends in the state and county, per the US Decennial
Census and the ACS estimates. As household sizes decrease, the number of households grow at a faster rate than
the population, thus adding to the demand for housing units. The number of households in the state increased
about 4.34 percent between 2000 and 2015 and about 4.54 percent in the county. Average household size
increased just under 1 percent in the county and state from 2.53 pph in the state and 2.59 pph in the county in
2000 to an estimated 2.53 pph in the state and 2.59 in the county in 2015.
TOWN OF WEST NEWBURY HOUSING PRODUCTION PLAN 2018-2022 • 12The composition of West Newbury’s households has also changed. The number of households with children under
18 years old decreased from 676 households in 2000 to about 597 in 2015 – a decrease of over 11 percent. In the
same period, single-person households increased from 165 households in 2000 to about 208 households in 2015
– an increase of over 26 percent. In the state, households with children under 18 years old decreased about 3.7
percent in the state and 3.16 in the county. Single households increased about 6.9 percent in the state and 5.7
percent in the county.
TOWN OF WEST NEWBURY HOUSING PRODUCTION PLAN 2018-2022 • 13Change in West Newbury Household Characteristics, 2000-2015
2015 % Change from
2000 2010
Estimate 2000-2015
Population 4,149 4,235 4,427 6.70%
Households 1,392 1,508 1,518 9.05%
Households with individuals under 18 years 676 578 597 -11.69%
Single Person Households 165 209 208 26.06%
Average Household Size 2.98 2.8 2.91 -2.35%
Average Family Size 3.25 3.1 3.21 -1.23%
Source: US Decennial Census 2000, 2010, 2011-2015 ACS Estimates, S1101, DP-1
All 15 communities in the Merrimack Valley region had estimated population growth
between 2000 and 2015, with an average growth rate of 8.75 percent and median
growth rate of 9.38 percent. West Newbury’s estimated population growth in this
period was 6.7 percent.
The state and county have lower estimated population growth rates than the region – both at about 5.6 percent.
Population Growth 2000-2015
Source: US Decennial Census 2000; 2011-2015 ACS ESTIMATES
16%
14.4%
14%
12% 10.6% 10.8% 10.8% 11%
10.1%
10% 9.4% 9.7%
8.8%
7.5% 7.6%
8% 6.7%
5.6% 5.6%
6%
4% 3.4%
2.7%
2% 2.2%
2%
0%
Despite the recent population growth, UMass Donahue Institute population projections indicate a decline in West
Newbury’s population by about 470 people from 2010 to 2035. However, if average household size continues to
decline, the effect of the population decrease on housing demand may be minimized. For example, if housing size
continued to decline at a similar rate as estimated between 2000 and 2015, by 2035 the average household size
would be about 2.88 persons per household, which would generate about 1,307 households, about 211 less than
the 2015 estimated number of households. However, it is important to remember that many factors affect
TOWN OF WEST NEWBURY HOUSING PRODUCTION PLAN 2018-2022 • 14population change cannot always be accurately predicted. The UMass Donahue projections are primarily based on
rates of change for the years of 2005 to 2010, which was a period of relative instability and severe recession
resulting in very little growth.1 Population change is also affected by the types of housing available in a
community. West Newbury may need to develop a wider range of housing types to attract younger families and
keep the elderly population in place.
West
West Newbury
Newbury AgePopulation Growth
Distribution Projections
Source: U.S. Decennial Census 2000 and 2010; UMASS Donahue Institute Age Sex Details, 2013;
Source: UMass Donahue Age/Sex Details 2013; U.S. Decennial Census 2000 and 2010; 2011-2015
ACS 2011-2015, S0101
ACS Estimates
100%
4600
90% 4,427
4400
80%
4,235
70% 4200 4,149
4,095
Population
60% 3,952
4000
50%
3,766
3800
40%
30% 3600
20% 3400
10% Census 2000 Census 2010 Estimate 2015 Projection 2020 Projection 2030 Projection 2035
0%
2000 Census 2010 Census 2015 Estimates 2035 Projection
Under 5 years 5 to 19 years 20 to 34 years 35 to 64 years 65 years and over
AGE
Per the UMass Donahue projections, the age composition of West Newbury’s population is anticipated to change
with a 162 percent increase in the number of older adults (age 65 year and over), a 41 percent decrease in the
number of school age children, and a 49 percent decrease in the number of adults age 20 to 34 years. The median
age in West Newbury was estimated to be 44.5 years in 2015, according to the 2011-2015 ACS, which is higher
than the county’s median age of 40.6 years and the state’s median age of 39.3 years.
RACE AND ETHNICITY
Per the 2015 ACS, West Newbury population continues to racially identify primarily as white alone, with an
estimated 98 percent. In the region, about 77 percent of the population identified as white alone in 2015, down
from 83 percent in 2000. The region is becoming more racially diverse, while West Newbury remains primarily
white.
1
UMass Donahue Institute, Long-term Population Projections for Massachusetts Regions and Municipalities, March 2015. http://pep.donahue-
institute.org/downloads/2015/new/UMDI_LongTermPopulationProjectionsReport_2015%2004%20_29.pdf, accessed 8/4/17.
TOWN OF WEST NEWBURY HOUSING PRODUCTION PLAN 2018-2022 • 15In West Newbury, per the 2015 ACS, less than 1 percent of the population identifies as Black/African American
alone, less than 1 percent American Indian/Alaska Native alone, 1 percent Asian alone, less than 1 percent some
other race alone, and less than 1 percent as two or more races. Regionally, about 3 percent of the population
identifies as Black/African American alone, less than 1 percent American Indian/Alaska Native alone, 4 percent
Asian alone, 10 percent as some other race alone, and 2 percent two or more races.
The most significant racial/ethnic difference between West Newbury’s population and the region’s is the
percentage of the population identifying ethnically as Hispanic or Latino - About 1 percent of West Newbury’s
population (of any race) per the 2015 ACS identifies as having Hispanic/Latino ethnicity, whereas 25 percent of the
region’s population identifies as having Hispanic/Latino ethnicity, with the City of Lawrence having the greatest
proportion (76 percent) of total population identifying as having Hispanic/Latino ethnicity.
West Newbury Racial and Ethnic Characteristics, 2000-2015
2000 2010 2015
number % number % est. %
Total Population 4,149 100% 4,235 100% 4,427 100%
White alone 4,086 98% 4,127 97% 4,355 98%
Black or African American
8 0.2% 6 0.1% 2 0.05%
alone
American Indian and Alaska
1 0.02% 4 0.1% 0 0%
Native alone
Asian alone 22 1% 44 1% 29 1%
Some other race alone 15 0.4% 6 0.1% 7 0.2%
Two or more races: 17 0.4% 48 1% 34 1%
Hispanic or Latino (of any race) 27 1% 66 2% 141 3%
Source: U.S. Decennial Census 2000 and 2010, Table QT-P3, 2011-2015 ACS Estimates, Tables B02001, DP05.
TOWN OF WEST NEWBURY HOUSING PRODUCTION PLAN 2018-2022 • 16West Newbury Racial Composition Merrimack Valley Region Racial
Source: 2011-2015 ACS, Table B02001 Composition
Some Two or Source: 2011-2015 ACS, Table B02001
other race more Hispanic Hispanic
Asian alone races: or Latino or Latino
alone (of any (of any
race) race)
Black or Two or
African more
American races:
alone
Some
other race
alone
Asian
alone
American White
White Indian and alone
alone Alaska
Native Black or African
alone American alone
DISABILITY
The U.S. Census Bureau, per the ACS, defines disability as including go-outside-home, employment, mental,
physical, self-care, and sensory.2 West Newbury’s estimated disability rate (8 percent of total non-institutionalized
population)3 is slightly lower than the region (11 percent), county (12 percent), and state (12 percent). The
estimated percentage of children under 18 years with a disability in West Newbury (4 percent) is lower than the
region (5 percent), county (6 percent), and state (5 percent). The estimated percentage of adults age 18 to 64
years with a disability is also lower in West Newbury (5 percent) than the estimated 9 percent of population in this
age cohort in the region, county, and state.
2
U.S. Census Bureau, American Community Survey definition of disability: https://www.census.gov/people/disability/methodology/acs.html
3
The U.S. Census Bureau defines non-institutionalized population as all people living in housing units, including non-institutional group
quarters, such as college dormitories, military barracks, group homes, missions, or shelters. Whereas, institutionalized population includes
people living in correctional facilities, nursing homes, or mental hospitals. https://www.census.gov/topics/income-
poverty/poverty/guidance/group-quarters.html
TOWN OF WEST NEWBURY HOUSING PRODUCTION PLAN 2018-2022 • 17The estimated percentage of people 65 years and over who have disabilities is 28
percent in West Newbury, whereas about 33 percent of the region, county, and state
population in this age cohort have disabilities.
Disability Type Definitions
All disabilities are self-reported via the 2011-2015 American Community Survey. Disability status is determined from the
answers from these six types of disability.
Independent Living: People with independent living difficulty reported that, due to a physical, mental, or
emotional condition, they had difficulty doing errands alone.
Hearing: People who have a hearing disability report being deaf or as having serious difficulty hearing.
Vision: People who have a vision disability report being blind or as having serious difficulty seeing even when
wearing glasses.
Self-Care: People with a self-care disability report having difficulty dressing or bathing.
Ambulatory: People who report having ambulatory difficulty say that they have serious difficulty walking or
climbing stairs.
Cognitive: People who report having a cognitive disability report having serious difficulty concentrating,
remembering, or making decisions.
Source: American Community Survey Subject Definitions
Disability by Age, 2015
Merrimack
West Newbury Valley Region Essex County Massachusetts
est. % est. % est. % est. %
Total Civilian, (Non-
4,427 100% 341,082 100% 756,354 100% 6,627,768 100%
institutionalized Population)
With disability 349 8% 38,493 11% 89,520 12% 763,526 12%
Under 18 years 1,223 100% 81,507 100% 130,327 100% 1,394,267 100%
With disability 45 4% 3694 5% 7,789 6% 63,543 5%
18-64 years 2,594 100% 215,620 100% 475,165 100% 4,286,479 100%
With disability 136 5% 20,377 9% 44,374 9% 383,623 9%
65 years and over 610 100% 44,026 100% 111,964 100% 947,022 100%
With disability 168 28% 14,406 33% 37,357 33% 316,360 33%
Source: 2011-2015 ACS Estimates, Table S1810
TOWN OF WEST NEWBURY HOUSING PRODUCTION PLAN 2018-2022 • 18Of the estimated disabilities in
West Newbury, the most WEST NEWBURY DISABILITY CHARACTERISTICS
reported was cognitive (24 BY TYPE REPORTED
percent of reported SOURCE: ACS 2011-2015, TABLE S1810. NOTE: ACS RESPONDENTS
disabilities). Ambulatory CAN INDICATE MULTIPLE DISABILITIES; THE PERCENTAGES REPORTED
disabilities were about 22 HERE ARE A PERCENTAGE OF TOTAL ESTIMATED REPORTED
percent of total estimated DISABILITIES.
reported disabilities and Hearing
Independent
independent living was about 14%
Living
18 percent. 18%
Vision
GEOGRAPHIC 6%
MOBILITY
Geographic mobility measures
the movement of people from
one location to another. A Self-Care
population’s level of 16%
geographic mobility typically
varies by economic status,
family status, and age—Older Cognitive
adults tend to move less than 24%
younger adults and owners
tend to move less than
renters. However, West Ambulatory
Newbury’s geographic 22%
mobility rate is comparable to
the region, county, and state despite having large proportion of households that own their home and an aging
population, both of which typically contribute to low geographic mobility rates.
Per the 2015 ACS, about 87 percent of West Newbury’s total population lived in the
same home the year prior to the survey, which is comparable to the region (89
percent), county (88 percent) and state (87 percent).
Of the population that had moved in the prior year, most (59 percent) moved to West Newbury from another
community in Essex County. This is comparable with the mobility characteristics of the region, county, and state.
A greater percentage of people are estimated to have moved to West Newbury from out of state than within the
state – this is higher than estimate for the region, county, and state.
TOWN OF WEST NEWBURY HOUSING PRODUCTION PLAN 2018-2022 • 19Geographic Mobility, 2015
Merrimack Valley
West Newbury Essex County Massachusetts
Region
est. % est. % est. % est. %
Total 4,378 100% 339,582 100% 755,597 100% 6,635,154 100%
Same Home 3,809 87% 301,390 89% 666,437 88% 5,779,219 87%
Same County 333 8% 24,315 7% 56,670 8% 477,731 7%
Same State 39 0.9% 5,547 7% 15,112 2% 179,149 3%
Different State 197 5% 5,646 2% 11,334 2% 139,338 2%
Abroad - 0% 2,685 0.8% 6,045 0.8% 59,716 0.9%
Source: 2011-2015 ACS Estimates, Table S0701
HOUSEHOLD TYPES
Per the 2015 ACS estimates, West Newbury has about 1,518 total households, with 84 percent family households.
About 44 percent of family households have children under age 18.
About 20 percent of family households with children are single-parent households in
West Newbury, which is lower than the region (34 percent), but higher than the
county (19 percent) and state (17 percent).
About 14 percent of households are single-person households and about 49 percent of single-person households
in West Newbury are age 65 plus. This is higher than percentages in the region (40 percent of single-person
households), county (42 percent), and state (39 percent) of seniors living alone.
Household Types, 2015
Merrimack Valley
West Newbury Essex County Massachusetts
Household Type Region
est. % est. % est. % est. %
Total Households 1,518 100% 125,967 100% 287,912 100% 2,549,721 100%
Family Households 1,281 84% 87,499 69% 192,381 67% 1,620,917 64%
With children under
age 18 570 44% 41,072 47% 85,481 44% 709,541 44%
Male householder with
children, no spouse 32 6% 2,513 6% 13,166 5% 104,560 4%
Female householder
with children, no
spouse 78 14% 11,588 28% 39,538 14% 320,479 13%
Married couple without
children under age 18 1,927 27% 36,993 29% 82,186 29% 703,162 28%
Nonfamily households 237 16% 38,545 31% 95,531 33% 928,804 36%
Total householders
living alone 208 14% 31,495 25% 78,888 27% 731,770 29%
Householders 65+
living alone 102 49% 12,441 40% 33,110 42% 288,118 39%
Source: ACS 2011-2015 Estimates, Table S1101
TOWN OF WEST NEWBURY HOUSING PRODUCTION PLAN 2018-2022 • 20Tenure
Per the 2015 ACS, about 93 percent of West Newbury’s households own and 7 percent rent their home. West
Newbury has a higher estimated percentage of owner households than the region (63 percent), county (63
percent), or state (62 percent).
Households by Tenure, 2015
Merrimack Valley
West Newbury Essex County Massachusetts
Tenure Type Region
est. % est. % est. % est. %
Own 1,410 93% 79,885 63% 181,293 63% 1,583,667 62%
Rent 108 7% 46,072 37% 106,619 37% 966,054 38%
Total 1,518 100% 125,957 100% 287,912 100% 2,549,721 100%
Source: 2011-2015 ACS Estimates, Table B25003
Household Size
West Newbury’s ACS estimates indicate more households with one or two people than
in 2000 and a decline in larger households with four-plus-people.
Per the 2015 ACS, most households in West Newbury consist of either two-person (36 percent) or four-persons
(33 percent). The percentage of one-person households has increased about 2 percentage points since 2000
whereas the number of four-plus-person households decreased about 3 percentage points in the same period.
Two-person households increased 5 percentage points.
Household Size, 2015
2000 2010 2015
Size
number % Number % est. %
1-person 165 12% 209 14% 208 14%
2-person 436 31% 558 37% 543 36%
3-person 285 20% 275 18% 270 18%
4+-person 506 36% 466 31% 496 33%
Total 1,392 100% 1,508 100% 1,517 100%
Source: 2011-2015 Estimates, Table S2501; U.S. Decennial Census 2010 and 2000, Table H013
HOUSEHOLD INCOME
Income Distribution
West Newbury's households are estimated to have significantly higher incomes than
households in the region, county, and state.
Roughly 61 percent of West Newbury’s households have income of $100,000 or more and about 20 percent have
income less than $50,000, per the 2015 ACS. About 39 percent of households in the region have income of
$100,000 or more, 39 percent in the county, and 38 percent in the state. About 33 percent of households in the
region have income less than $50,000 and 34 percent in the county and state.
TOWN OF WEST NEWBURY HOUSING PRODUCTION PLAN 2018-2022 • 21Household Income Distribution, 2015
Merrimack Valley
West Newbury Essex County Massachusetts
Income Region
est. % est. % est. % est. %
Less than $15,000 81 5% 13,534 11% 31,199 11% 286,426 11%
$15,000-$24,999 78 5% 10,751 9% 24,917 9% 217,314 9%
$25,000-$34,999 9 1% 10,273 8% 22,856 8% 196,102 8%
$35,000-$49,999 132 9% 13,344 11% 30,343 11% 266,140 10%
$50,000-$74,999 185 12% 19,317 15% 45,257 16% 402,960 16%
$75,000-$99,999 100 6% 15,456 12% 35,908 12% 317,568 12%
$100,000-$149,000 283 19% 20,172 16% 47,549 17% 429,874 17%
$150,000+ 650 43% 23,074 18% 49,883 17% 433,337 17%
Total 1,518 100% 125,921 100% 287,912 100% 2,549,721 100%
Source: 2011-2015 Estimates, Table B19001
WEST NEWBURY HOUSEHOLD INCOME DISTRIBUTION
SOURCE: 2011-2015 ACS ESTIMATES, TABLE B19001
Less than $15,000 $15,000-$24,999
5% 5%
$25,000-$34,999
1%
$35,000-$49,999
9%
$150,000+
43%
$50,000-$74,999
12%
$75,000-$99,999
6%
$100,000-$149,000
19%
Median Income
West Newbury’s estimated median household income per the 2015 ACS is $131,167, which is significantly higher
than the weighted mean of the median income for the 15 Merrimack Valley communities ($75,532), the county
($69,068), and state ($68,563).
Median Income, 2015
Merrimack Valley
West Newbury Essex County Massachusetts
Region*
Median Household Income $131,167 $75,532 $69,068 $68,563
Source: 2011-2015 ACS Estimates, Table S1901.
*Note: Regional median incomes are calculations by the Merrimack Valley Planning Commission of weighted mean of
estimated median incomes by Census block groups for the 15 towns and cities in the region as reported in the 2011-2015 ACS.
TOWN OF WEST NEWBURY HOUSING PRODUCTION PLAN 2018-2022 • 22Median Income by Tenure
Renters tend to have lower income than owners, as seen at the community, regional, county, and state level. In
West Newbury, estimated median renter income was $43,889 per the 2015 ACS and estimated median owner
income was $137,554.
Median Income by Tenure, 2015
Merrimack Valley
Tenure West Newbury Essex County Massachusetts
Region*
Owner Occupied $137,554 $104,451 $95,660 $92,207
Renter Occupied $43,889 $34,997 $35,254 $37,780
Source: 2011-2015 ACS Estimates, Table B25119.
*Note: Regional median incomes are the author’s calculation of weighted mean of estimated median income of the 15 towns
and cities in the region as reported in the 2011-2015 ACS.
Income Distribution by Age of Householder
Per the 2015 ACS, households with householders age 45 to 64 years have the highest estimated median in West
Newbury ($149,583) – this is higher than median incomes for this age cohort in the county ($86,738) and state
($84,898), and higher than the average of median incomes of this cohort for the 15 towns in the region ($92,470).
Households with householders age 25 to 44 as well as 65 years and over have higher estimated median incomes
in West Newbury when compared with the region, county, and state.
Households with senior householders (age 65 years and over) have lower median
income than younger cohorts with an estimated median income of $54,219 in West
Newbury.
MEDIA N INCO ME BY AGE O F HO U SEHO LDER , 2015
SOURCE: ACS 2015, TABLE B19049*NOTE: REGIONAL MEDIAN INCOMES ARE
THE AVERAGES OF THE 15 COMMUNITY'S MEDIAN INCOMES.
West Newbury Merrimack Valley Region*
$149,583
$139,583
$92,470
$86,738
$84,898
$78,841
$77,341
$77,048
$54,219
$42,250
$40,595
$40,573
25 TO 44 YEARS 45 TO 64 YEARS 65 YEARS AND OVER
TOWN OF WEST NEWBURY HOUSING PRODUCTION PLAN 2018-2022 • 23POVERTY
Individuals are considered poor if the
Federal Poverty Thresholds
resources they share with others in the
The federal poverty thresholds vary by household size and number of
household are not enough to meet basic
children under 18 and are updated annually. The thresholds do not
needs. vary geographically. For example, per the 2016 federal poverty
thresholds, a household of three with no children under 18 years is
below the poverty threshold if household income is at or below $18,774
West Newbury has a lower and a household of three with one child is below the poverty threshold
estimated poverty rate than the if household income is at or below $19,318.
region, county, or state, with
about 7 percent of the total Size of No related One related Two related
Family Unit children child children
population living in households
One person $12,486
below the federal poverty
Two people $16,072 $16,543
thresholds, as compared to the
Three people $18,774 $19,318 $19,337
county and the state. Four people $24,755 $25,160 $24,339
Source: 2016 Federal Poverty Thresholds
The table below includes every individual in http://www.census.gov/data/tables/time-series/demo/income-
families that have total income less than the poverty/historical-poverty-thresholds.html, accessed 8/2/17.
family’s poverty threshold. In West Newbury,
close to 55 percent of the population living in households below the federal poverty thresholds are children under
18 years.
Population in Households Below Federal Poverty Thresholds by Age, 2015
Merrimack Valley
West Newbury Essex County Massachusetts
Region
est. % est. % est. % est. %
Under 5 years 50 16% 3,953 9% 8,119 10% 61,483 8%
5-17 years 124 39% 10,373 25% 19,400 23% 147,458 20%
18-34 years 51 16% 9,157 22% 19,157 22% 218,761 29%
35-64 years 66 21% 14,023 33% 27,877 33% 233,736 31%
65 years and over 29 9% 4,735 11% 10,864 13% 87,467 12%
Total in Poverty 320 7% 42,241 13% 85,417 11% 748,905 12%
Total Population 4,425 100% 338,637 100% 747,718 100% 6,471,313 100%
Source: 2011-2015 ACS Estimates, Table B17001
In the appendix, there is a second table that breaks down the population living below the poverty thresholds by
smaller age categories than the above table.
Homelessness Characteristics
POINT IN TIME COUNTS
Per the North Shore Continuum of Care (CoC), which includes every community in the region aside from
Lawrence, the Point in Time count estimated that in 2017, there were 519 homeless individuals with children and
189 homeless individuals without children residing in the North Shore, down from about 1,336 with children and
243 without children in 2015. Most homeless individuals (96 percent) reside in emergency shelters. In 2017, there
were 47 unsheltered individuals without children, an increase from 29 unsheltered individuals without children in
2015. Point in Time counts for Lawrence determined that in 2017, there were 224 people in emergency shelters, 87
TOWN OF WEST NEWBURY HOUSING PRODUCTION PLAN 2018-2022 • 24people in permanent supportive housing, 47 people in other supportive housing, and 106 people in transitional
housing.4
Homeless shelters in the Merrimack Valley area include the Newburyport YWCA, Community Action, Inc. in
Haverhill, YWCA Haverhill, and the Emmaus Family House in Haverhill. There are several other shelters located in
Lawrence, including Casa Nueva Vida, the Lazarus House, Daybreak Shelter, and Greater Lawrence YWCA.
Homelessness Count in the North Shore, 2015-2017
2015 2016 2017
number % number % number %
Homeless with Children: 1,336 100% 978 100% 519 100%
Emergency Shelter 1,265 95% 907 93% 498 96%
Transitional Housing 67 5% 69 7% 21 4%
Unsheltered 4 0% 2 0% 0 0%
Homeless without Children: 243 100% 241 100% 189 100%
Emergency Shelter 169 70% 151 63% 117 62%
Safe Haven 6 2% 6 2% 6 3%
Transitional Housing 39 16% 25 10% 19 10%
Unsheltered 29 12% 59 24% 47 25%
Source: North Shore Continuum of Care HIC PIT
DEMOGRAPHIC CHARACTERISTICS OF HOMELESS POPULATION
In 2017, the PIT counts estimated that of the 708 homeless individuals in the North Shore, 124 (33 percent) are
chronic substance abusers, 91 (25 percent) are seriously mentally ill, 31 (8 percent) are veterans, two (.01 percent)
are persons with HIV/AIDS, 80 (22 percent) are youth, and 43 (12 percent) are domestic violence victims.
Percentages are based on total characteristics reported, not on individuals. From 2015 to 2017, the number of
homeless individuals that are youth declined from 248 to 80 in the North Shore, though the number of homeless
individuals that are substance abusers increased from 85 to 124 from 2015 to 2017.
4
Source: Lawrence Housing Inventory Count. Note: Demographic data of homeless population was not available for Lawrence.
TOWN OF WEST NEWBURY HOUSING PRODUCTION PLAN 2018-2022 • 25Economic Characteristics
Roughly 60 percent of West Newbury’s total labor force is employed in the industries of management, business,
science, and arts. About 20 percent is employed in sales or office occupations, and about 8 percent is employed in
the service industry. The remaining employed population works in the fields of natural resources, construction,
and maintenance and production, transportation, and material moving.
Economic Sectors, 2015
Merrimack Valley
West Newbury Region Essex County Massachusetts
Industry est. % est. % est. % est. %
Management, business,
1,340 60% 69,906 41% 156,504 41% 1,510,715 44%
science, and arts
Service Occupations 188 8% 29,739 17% 70,286 18% 602,742 18%
Sales and office 436 20% 38,877 23% 90,572 24% 767,408 22%
Natural Resources,
construction, and 156 7% 11,379 7% 27,135 7% 235,906 7%
maintenance
Production, transportation,
114 5% 20,609 12% 39,385 10% 299,204 9%
and material moving
Total civilian employed
population 16 years and 2,234 100% 170,510 100% 383,882 100% 3,415,975 100%
older
Source: 2011-2015 ACS Estimates, Table DP03
The 2016 estimated unemployment rate for West Newbury was 2.8 percent, which is lower than the county rate of
3.8 percent. The state was estimated to have a 3.7 percent unemployment rate in 2016.5
Per the 2015 estimates, about 47 percent of West Newbury households have less than 30-minute travel time to
work. This is lower than the estimated population in the region (57 percent), county (57 percent), and state (56
percent) that have less than 30-minute travel time to work. About 24 percent of West Newbury households
commute over an hour, which is significantly higher than in the region, county, and state.
Travel Time to Work, 2015
Merrimack Valley
West Newbury Region Essex County Massachusetts
Travel Time est. % est. % est. % est. %
Less than 15 minutes 382 20% 41,329 26% 94,276 26% 759,671 24%
15-29 minutes 519 27% 49,765 31% 110,489 31% 1,030,429 32%
30-44 minutes 317 16% 31,454 20% 68,326 19% 708,480 22%
45-59 minutes 274 14% 15,895 10% 34,430 10% 324,504 10%
More than 60 minutes 462 24% 20,539 13% 48,720 14% 371,904 12%
Total 1,954 100% 158,982 100% 356,241 100% 3,194,998 100%
Source: 2011-2015 ACS Estimates, Table B08303
5
Source: The Executive Office of Labor and Workforce Development, 2016
TOWN OF WEST NEWBURY HOUSING PRODUCTION PLAN 2018-2022 • 26EDUCATIONAL ATTAINMENT
Per the 2015 ACS, about 98 percent of West Newbury’s population age 25 years and over are high school
graduates or have higher education – this is higher than the county (89 percent) and state (89.8). About 34
percent of the population have a Bachelor’s degree and not a graduate or professional degree – this is higher than
the region (22 percent), county (22 percent) and state (23 percent). About 24 percent of West Newbury’s
population has a graduate or professional degree – this is higher than the region (16 percent), county (15
percent), and state (18 percent).
Educational Attainment, 2015
Merrimack Valley
West Newbury Region Essex County Massachusetts
est. % est. % est. % est. %
Population 25 years and
2,926 100% 230,513 100% 523,024 100% 4,610,510 100%
over
Less than 9th grade 8 0% 14,836 6% 28,930 6% 220,055 5%
9th to 12th grade, no
68 2% 13,017 6% 27,055 5% 251,050 5%
diploma
High school graduate 434 15% 58,210 25% 136,786 26% 1,169,375 25%
Some college 518 18% 38,913 17% 90,700 17% 745,794 16%
Associate's degree 214 7% 19,212 8% 43,250 8% 357,133 8%
Bachelor's degree 998 34% 50,116 22% 116,780 22% 1,049,150 23%
Graduate or professional
688 24% 36,211 16% 79,523 15% 817,953 18%
degree
Percent high school 2,867 98% 202,851 88% 465,491 89% 4,149,459 90%
graduate or higher
Percent bachelor's degree
1,697 58% 85,290 37% 198,749 38% 1,890,309 41%
or higher
Source: 2011-2015 ACS Estimates, Table S1501
TOWN OF WEST NEWBURY HOUSING PRODUCTION PLAN 2018-2022 • 27Chapter 3: Local Housing Conditions
Key Findings
▪ West Newbury has about 1,607 housing units, with about 94 percent occupied year-round and a small
amount (22 units) of seasonal units. West Newbury’s vacancy rates are estimated to be low and indicate a
housing demand that exceeds supply. However, if projections indicating a declining population manifest
in coming years, this may rectify the apparent supply/demand imbalance.
▪ The desire for large homes on large lots appears to be declining and is projected to continue. A lack of
housing alternatives in West Newbury may impact population in the coming years.
▪ Roughly 93 percent of West Newbury’s occupied housing units were owner occupied and only 7 percent
renter occupied, which is a significantly lower proportion of renter housing than in the region.
▪ Housing units tend to be newer in West Newbury. Only about 58 percent of West Newbury’s housing
units were built prior to 1979. However, homes of this age may contain lead paint, which can pose health
hazards, and may need abatement and other health and safety improvements.
▪ West Newbury has a high average single-family tax bill of $7,710 compared with other communities in the
region, with only Andover and Boxford having higher average single-family tax bills.
▪ West Newbury’s residential building permit activity indicates construction of primarily of single-family
units between 2000 and 2015.
▪ West Newbury has a lower percentage of younger homeowners than in the region, which is likely tied to
housing cost and availability of starter homes.
▪ For-sale housing prices are more expensive than most communities in the region with a 2016 median
sales price for all residential sales of $545,000. West Newbury has an affordability gap of $57,000—a
household making the median household income could not afford the median sales price for a single-
family home of $565,000.
▪ West Newbury renters tend to have higher incomes than renters in the region and tend to pay more for
rent than in the region.
▪ About one in four of West Newbury’s households have incomes at or below 80 percent of the Area
Median Income (AMI). And, about 75 percent or 285 of low-income households in West Newbury are
estimated to spend more than 30 percent of their gross income for housing costs.
▪ Housing cost burdened households in West Newbury are most likely to be composed of small families.
Second most likely household type to cost burdened are large families.
▪ Only 2.5 percent or 39 units of West Newbury’s total year-round housing units are included on the state’s
Subsidized Housing Inventory. This analysis indicates that West Newbury needs more rental housing at all
price points including affordable at a variety of income ranges and market-rate rental housing, more
affordable starter homes for first-time homebuyers for low/moderate income and middle-income
households including rental and ownership units; as well as more accessible housing and housing with
supportive services.
▪ Despite the low vacancy rates, the potential decline of population and households in the coming years
indicates that West Newbury’s housing needs may be best addressed through allowing for redevelopment
and/or conversion of single-family homes to alternative housing types such as congregate living with
supportive services, small-scale multi-family units, and cottage-style or other models for smaller,
affordable starter homes.
TOWN OF WEST NEWBURY HOUSING PRODUCTION PLAN 2018-2022 • 28Housing Supply and Vacancy Trends
OCCUPANCY AND TENURE
The 2015 ACS estimated 1,607 housing units in West Vacancy Rates
Newbury, with 1,518 year-round occupied units (94 Vacancies are an essential measure of the state of
percent) and an estimated 89 vacant units (6 percent the housing market. Vacant units represent the
of total housing units), with 22 of these (25 percent)
supply of homes that exceeds demand, which is
for seasonal, recreational, or occasional use. The
related to economic trends. Vacancy rates are
estimated rental vacancy rate in West Newbury was
5.3 percent and ownership vacancy rate was 0.9 measured as a percent of total housing units. A
percent. These vacancy rates indicate a need for more low vacancy rate can result in pressure on
housing units, both rental and ownership. The county housing prices. A 1.5% vacancy rate for
and state had lower vacancy rates for rental and ownership and 7% for rental units are considered
comparable rates for ownership housing. natural vacancy rates in a healthy market.
Source: Metropolitan Area Planning Council, Basic Housing
An estimated 93 percent of West Newbury’s total Needs Assessment, Sept 2014 – in consultation with Barry
occupied housing units were owner occupied while 7 Bluestone, Dukakis Center at Northeastern University.
percent were renter occupied per the 2015 ACS
estimates. In comparison, the region, county, and state had a greater percentage of renter-occupied units (37, 37,
and 38 percent, respectively).
Occupancy, Vacancy, and Tenure, 2015
Merrimack Valley
West Newbury Region Essex County Massachusetts
est. % est. % est. % est. %
Total Housing Units 1,607 100% 134,083 100% 307,894 100% 2,827,820 100%
Occupied 1,518 94% 125,957 94% 287,912 94% 2,549,721 90%
Owner Occupied 1,410 93% 79,885 63% 181,293 63% 1,583,667 62%
Renter Occupied 108 7% 46,072 37% 106,619 37% 966,054 38%
Vacant 89 6% 8,126 6% 19,982 6% 278,099 10%
Vacant Seasonal,
Recreational, or
Occasional Use 22 25% 1,831 23% 5,096 26% 123,040 44%
Rental vacancy rate (x) 5.3 (x) (x) (x) 3.4% (x) 4.2%
Ownership vacancy
rate (x) 0.9 (x) (x) (x) 0.9% (x) 1.2%
Source: 2011-2015 ACS Estimates, Table DP04
TOWN OF WEST NEWBURY HOUSING PRODUCTION PLAN 2018-2022 • 29You can also read