Housing Appendix C: Montgomery Planning
←
→
Page content transcription
If your browser does not render page correctly, please read the page content below

Appendix C:
Housing
MCPB
                                                                                                          Item No. 3
                                                                                                          Date: 3/4/21

Silver Spring Downtown & Adjacent Communities Plan – Missing Middle Housing Market Study
  Lisa Govoni, Housing Policy Coordinator, Countywide Planning & Policy, Lisa.Govoni@montgomeryplanning.org, 301.650.5624
  Todd Fawley-King, Real Estate Specialist, R&SP, Todd.FawleyKing@montgomeryplanning.org, 301-495-4545
  Leslye Howerton, Master Plan Supervisor, DownCounty Planning, Leslye.Howerton@montgomeryplanning.org , 301-495-4566
  Elza Hisel-McCoy, Chief, DownCounty, Elza.Hisel-McCoy@montgomeryplanning.org, 301.495.2115
                                                                                            Completed: 2/25/2021

 Description

 The Market Study on Missing Middle Housing builds upon the 2018 Missing Middle Study and is a
 precursor to the visioning phase of the Silver Spring Downtown and Adjacent Communities Plan. The
 Market Study is comprised of analyses of zoning, entitlement, affordability and market feasibility of
 different Missing Middle typologies, as well as interviews with industry professionals to help understand
 the barriers and opportunities to building Missing Middle housing in Montgomery County. This Market
 Study aims to provide necessary background knowledge and to serve as the starting point for the
 visioning phase of the Silver Spring Downtown and Adjacent Communities Plan and consideration of
 adding new housing types and forms to the adjacent communities.

 Background

 In March 2020, the Planning Board directed Planning staff on the Silver Spring Downtown and Adjacent
 Communities Plan to expand the plan boundary to include portions of the adjacent single-family R-60
 zoned neighborhoods within a ½ mile of the Silver Spring Metro station and the future Purple Line
 station at the Silver Spring Library. This was done to study the viability of introducing more diverse
 housing options through various multiunit typologies.

 The Market Study on Missing Middle Housing is being done in support of the Silver Spring Downtown
 and Adjacent Communities Plan, with the intent of examining the market for new housing types and
 forms that could potentially be introduced into the adjacent communities.

 Housing Stock Analysis

 The Housing Stock analysis provides an introduction and assessment of the current state of the housing
 in Montgomery County, and the neighborhoods within and surrounding the Silver Spring Downtown and
 Adjacent Plan area.

 Findings from the Housing Stock Analysis include: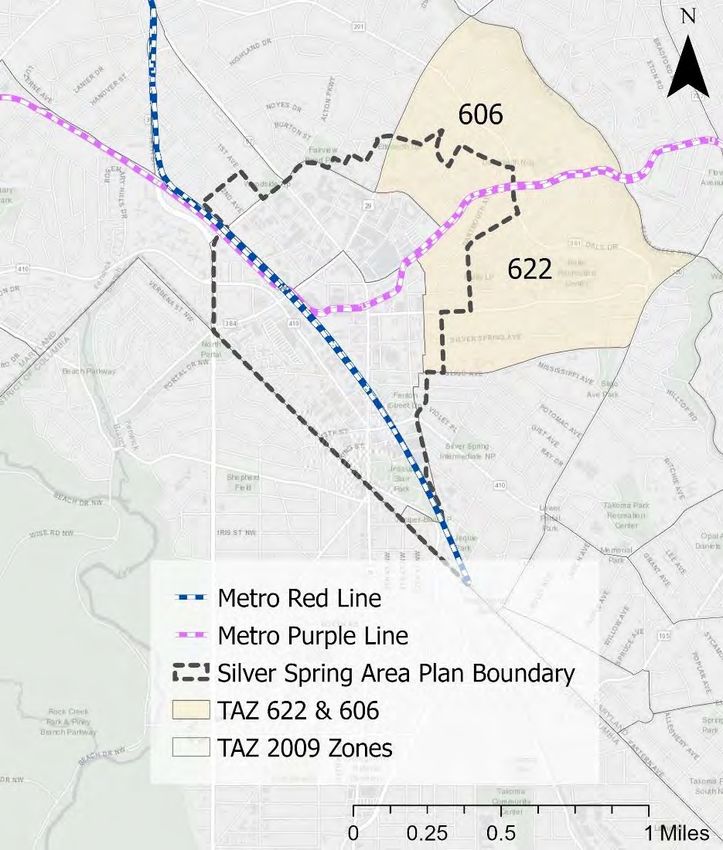
•   In the early 2000s, Montgomery County housing production averaged 3,500 building permits a
    year, a number that has declined to around 2,500 annually in the 2010s. This reduced level is
    below what the county needs to achieve its
    COG housing targets.
•   Almost half of renters and one in five
    homeowners in the Plan Area are cost-
    burdened– spending more than 30 percent of
    their income on rent or housing costs.
•   “Missing Middle” already exists in the Plan
    Area, namely in older duplexes, triplexes, and
    small apartment buildings located on the edge
    of the CBD and in the adjacent neighborhoods.
•   While rents have risen at a higher annualized
    rate in the county as compared to downtown
    Silver Spring since 2000 (1.8 percent in the
    county vs. 1.5 percent in downtown Silver
                                                         Figure 1 Plan Boundaries
    Spring), rents are still higher per square foot
    and per unit in downtown Silver Spring.
•   The average price for a detached home in zip code 20910 (the zip code that serves the Silver
    Spring Downtown and Adjacent Communities Plan area) exceeded $700,000 for the first time in
    2020.
                                                   • While the median price for all homes sold in zip
                                                   code 20910 was $520,000 (includes both attached
                                                   and detached units) – 40 percent of homes sold for
                                                   more than $600,000 in 2020.
                                                   • In zip code 201910 57 percent of homes sold in
                                                   less than 10 days in 2020, and the average days on
                                                   market declined to 24 days in 2020 from 30 days in
                                                   2019, signals of rising and unmet housing demand.
                                                   • The average Gross Floor Area for homes built in
                                                   zip code 20910 since 2010 as increased by 77
                                                   percent compared to the average home constructed
    Figure 2 Zip code 20910 and Plan               before 1959.
    Boundary                                       • Demolition of single-family detached units has
                                                   been relatively rare since 2000 in zip code 20910 as
    compared to western parts of the county, but there are signs that the market for custom-rebuilt
    homes is accelerating in recent years. in recent years.
         o 61 demolition permits were issued for single-family detached units in zip code 20910
             since 2000.
                 ▪ The Gross Floor Area of the subsequent new home was 155 percent larger than
                     the structure demolished.

                                                2
▪   Sales price increased by an average of 114 percent post teardown, from an
                        average sold price of $500,827 pre-teardown, to $1,073,193 after the teardown
                        was rebuilt.

Interviews

Planning staff conducted interviews with stakeholders involved in real estate and development in
Montgomery County and that have experience with the Missing Middle typology. Interviewees included
small-scale builders, for-profit residential developers, non-profit residential developers, architects, and
brokers. The interviews focused on understanding the potential for Missing Middle to increase the
supply of housing in Montgomery County; the changes that would be required to zoning, development
standards, and the entitlement process to make Missing Middle an attractive investment; and the
relative costs to construct different Missing Middle typologies to increase the supply of housing in
Montgomery County.

The interviews identified the following findings:
    • Stakeholders strongly feel that Missing Middle typologies must be allowed by-right, including a
        quicker and more predictable subdivision process, or builders will default to constructing
        profitable, by-right, new custom-homes, a quicker and more predictable subdivision process.
    • Market-rate developers are most interested in townhomes (including stacked flats and 2 over
        2’s), the typologies that now dominate middle levels of density.
    • Affordable housing developers who have an objective that is not solely focused on profits will
        pursue (limited) amounts of Missing Middle where allowable in order to maximize unit counts.
    • Developers believe that the best opportunity currently for Missing Middle is mid-size sites (4- to
        5-acres) in residential areas with obsolete uses, like unused schools or churches. Missing Middle
        is mid-size sites (4- to 5-acres) in residential areas with obsolete uses, like unused schools or
        churches.
    • Stakeholders stated that attracting private sector interest in the redevelopment of existing
        habitable single-family homes to other building typologies will require a meaningful increase in
        density, particularly if the desired units are to be smaller in size to help make them less
        expensive.
    • The existing R60 zoning/development standards do not physically accommodate Missing Middle
        housing, even a duplex. Lot coverage, height limits, and setbacks were the most common items
        mentioned in relation to challenges with development standards.
    • There is heavy competition for properties in close-in Metro accessible neighborhoods, which
        makes it harder to acquire and assemble lots. If a house is habitable an end-user who desires to
        live in that house will most likely out-bid a builder interested in redeveloping the property.
    • The most likely builders of Missing Middle types of housing are small firms that are currently
        working in the teardown, custom home market. Missing Middle products would need to be
        proven to be economical and scalable to be built with some regularity.
    • While there are significant hurdles to building this product, taking no action will depress the
        supply of homes, resulting in housing continuing to get more and more expensive. With
        increased demand and limited supply, over time many single-family homes will be bought and
        through the tear-down process be replaced by larger and more expensive structures. Even
        small, modest numbers of duplexes, triplexes, and small apartment buildings could help combat
        teardowns and rebuilds.

                                                     3
Entitlement Analysis

Missing Middle housing typologies could not be built in the single-family zoning under the current
standards. While many of the single-family zones in Montgomery County do allow for some types of
Missing Middle housing, namely duplexes and townhouses, there are additional requirements that
functionally prevent redevelopment of existing properties into Missing Middle in these zones.

Process:
    • Missing Middle housing cannot compete with profitable single-family housing developments if
        the entitlement process is not by-right. Missing Middle redevelopments of existing single-family
        properties generate too few units to interest developers if a more complicated and risky
        discretionary approval process cannot compete with profitable single-family housing
        developments if the entitlement process is not by-right.
    • Redevelopment of existing single-family properties into Missing Middle housing requires a non-
        discretionary and rapid subdivision process in order to compete with by-right redevelopment of
        single-family homes into larger custom single-family homes. Subdivision is necessary as builders
        desire to sell units fee-simple rather than operate small dispersed-site rental properties.

Density:
   • Existing single-family zones are significantly less dense than most of the Missing Middle housing
        typologies.
   • In the Adjacent Communities portion of the Downtown Silver Spring Sector Plan single family
        lots average between 7,000 and 8,000 SF, a net density of 5 to 6 units per acres.
        MissingMiddleHousing.com reports that side-by-side duplexes, the least dense Missing Middle
        typology, tend to achieve between 8 and to 17 units per acre.
   • To enable Missing Middle housing existing minimum lot sizes would need to be smaller and the
        corresponding allowable density would need to be higher.

Development Standards:
   • Missing Middle housing may require a relaxation of development standards related to height,
       side setback, and lot coverage in to physically accommodate for-sale Missing Middle typologies.
   • Existing small single-family lots are unlikely to physically accommodate the parking for multi-unit
       Missing Middle typologies under the current parking standards.

Affordable Housing:
    • Currently Missing Middle could only be developed in single-family zones using the optional
       method of development. Optional Method requires that at that that that that all projects
       regardless of total size provide moderately priced dwelling units to achieve Missing Middle types
       of housing.
    • The added cost of providing dedicated affordable housing will make redevelopment of existing
       single-family homes into modest-sized Missing Middle housing financially infeasible.

Missing Middle and Affordability

Missing Middle housing is not the same as income-restricted affordable housing. Most Missing Middle
housing is market-rate housing that will generally be more affordable than the typical new detached

                                                   4
single-family home due to its smaller size. The prices of Missing Middle housing, however, will be
determined by what the market can bear.

The creation of Missing Middle housing may not automatically create dedicated affordable housing such
as Moderately Priced Dwelling Units (MPDUs). MPDUs are the county’s inclusionary zoning program,
where new residential development projects of 20 units or more are required to set aside 12.5 percent
of units as affordable to households earning between 65 percent and 70 percent of Area Median
Income. Development projects between 11 and 19 units are required to make a payment to the Housing
Initiative Fund, the county’s housing trust fund.

While no MPDUs will be created for smaller infill projects, Missing Middle housing will still be helpful in
increasing the supply of attainable housing in Montgomery County. There is a growing need to make
sure the housing built is attainable, appropriate and suitable for the households that live here. Implicit in
this idea of attainability is that a range of housing options (type, size, tenure, cost) exists in the local
market to meet the size and affordability needs of people at all economic levels.

Summary of the Model Used to Evaluate New Development Feasibility

The redevelopment of existing habitable single-family homes in desirable markets requires the new
use generate significant revenue to cover the high cost of acquiring land, constructing a new
structure, paying required entitlement fees, and providing suitable profit to the builder. In order to
understand where and what type of Missing Middle housing typologies might be feasible
redevelopments in existing single-family zoned neighborhoods, Planning staff conducted a market
study with a focus on Silver Spring.

Focus Geography
The residual value model evaluates the feasibility of new development in geographic zones as opposed
to consideration of specific parcels. For this analysis, Planning staff used the Metropolitan Washington
Council of Governments 2009 Transportation Analysis Zones (TAZ) for these analysis zones. MWCOG
divides the entire region into TAZ, geographic areas usually the size of a single neighborhood, for the
purpose of transportation and population forecasting. TAZ are a convenient geography for this study
because they are small enough to provide results specific to individual neighborhoods, without being so
small that the results imply a false level of precision.

Planning staff focused on the two TAZ that cover the bulk of the residential neighborhood adjacent to
Downtown Silver Spring. The two TAZ are numbered 606 and 622, shown in Figure 3 below. The
statistics regarding the size and value of single-family properties in both TAZ 606 and 622 are similar.
Planning staff chose to use TAZ 622 in reporting detailed findings, but these findings apply equally to
TAZ 606. Notable statistics for both TAZ 606 and 622 are listed in Table 1.

                                                     5
Table 1 Focus Geography

             Statistic             TAZ 606      TAZ 622

 Number of single-family             330          512
 detached properties

 Average size of single-family      7,837        7,650
 Properties sold 2018-2020
 (square feet)

 Average value of single-family   $680,000     $655,000
 home sales 2018-2020

 Estimated cost to acquire an     $4,100,000   $3,950,000
 acre of single-family property
 based on home sales 2018-2020

Figure 3 Focus Geography Map

                                      6
The Residual Value Model for Analysis

Staff used a residual value model to broadly understand the feasibility of different Missing Middle
typologies across Montgomery County. The model is based on the underlying logic that if the value of a
new building minus the cost of its development (construction, soft costs/financing, fees, profit) greatly
exceeds the cost needed to acquire the land on which it would sit and where such development is legal,
then attempts at development are likely. The residual, or leftover, is the difference between the
expected value of the finished building and the development costs excluding land value. Developers
would use this residual to try and buy suitable land. If the residual is substantially greater than the
expected market price for land, it is likely builders would be able to acquire what they need. If the
residual is substantially less than the average cost of land, it is correspondingly unlikely that builders
could find land at a low enough cost to make the development financially feasible.

The model uses a hypothetical ‘prototype’ of each building typology analyzed and average cost of land
within each focus geography in order to understand at a high-level across a broad geography where
development may occur. While the benefit of this approach is a general understanding of the real estate
market and feasibility of any product type, it comes at a sacrifice to detail and understanding of
development potential of any specific property. The model works best when development could occur
in the future on many different properties and if each of those properties within each separate TAZ have
similar value. While every home is different, most single-family properties in a neighborhood have
similar dimensions, features, and values as their neighbors. This makes the residual value model well-
suited to analysis of redevelopment of single-family homes.

The output of the residual value model is the ratio of the residual generated by a proposed development
divided by the average cost of land in each TAZ. Planning staff then translated the output ratios into the
likelihood that builders would make efforts to find land for each typology evaluated in each geographic
area analyzed:
     • Negative residual value: the value generated by the development is less than the cost to build
         the structure and the required profit before any attempt to find land. Redevelopment is not
         possible because the builder is guaranteed to lose money.
     • Residual value generated between 0% and 75% of the average cost of land. Redevelopment is
         not likely because it would require a builder acquire a property that is markedly less expensive
         than the prevailing cost of land. Finding such a property is improbable but not necessarily
         impossible, so the model does not explicitly indicate that no development would ever occur.
     • Residual value generated between 76% and 125% of the average cost of land. Redevelopment
         has potential, but because the value generated is similar to the cost required to buy land,
         development of the typology evaluated may not be widespread.
     • Residual value generated greater than 125% of the average cost of land. Efforts to redevelop are
         likely due to the high potential profit. While efforts to find and acquire land are likely, this is not
         a guarantee that builders would be able to secure the parcel(s) needed at a profitable price or
         that construction would occur.

The bounds for each category above are not precise and are purposefully large, round numbers to avoid
a sense of false precision. Development is a complicated process influenced by many factors. No
generalized model that evaluates wide swaths of geography can do more than estimate the likelihood
that builders would try and find and acquire land based on the estimated profit.

                                                       7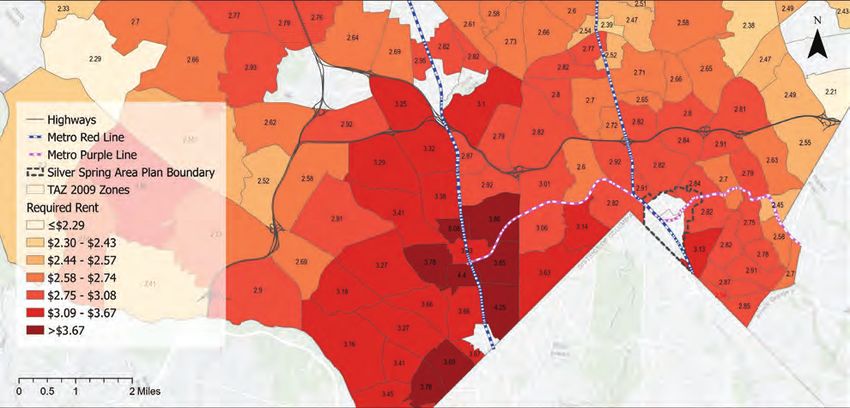
Forms of the Residual Value Model

Planning staff utilized two forms of the residual value model: one for building types where there are
similar recently constructed product and thus an ability to estimate the potential value of the ultimate
development, and another for building types where there are no recently constructed examples and
thus limited understanding of the value a new unit might generate.

The model for product with similar recently built examples to compare to takes the following steps, uses
the following data sources, and the following specific data metrics:

Table 2 Data Metrics

               Step                            Data Points                        Data Sources

 1) Define geographic units of      2009 Transportation Analysis        Metropolitan Washington
 analysis                           Zones (TAZ)                         Council of Governments

 2) Identify cost to build the      Cost per Square Foot of             Interviews with Builders
 typology being evaluated           construction
                                                                        Staff Knowledge
                                    Soft Costs & Financing Costs

                                    Entitlement Fees

 3) Identify the value of the       Number of Comparable Sales          Maryland State Department of
 developed typology                                                     Assessments and Taxation
                                    Size/Features of Comparable         property database
                                    sales
                                                                        Staff estimation
                                    Value of Comparable Sales

 4) Identify the cost to acquire    Number of recent sales of           Maryland State Department of
 single-family zoned land in each   single-family properties            Assessments and Taxation
 TAZ                                                                    property database
                                    Value of recent sales of single-
                                    family properties

 5) Generate Results

For the evaluation of typologies where there have been no recent similar developments in Montgomery
County, the process is different because it is not possible to estimate the future value of a new
development. Instead, the model calculates the rents required in each TAZ to generate residual value
equal to 75% of the average cost of single-family home properties in that TAZ. Staff then compared
those required rents to the market rents achieved in downtown Silver Spring to assess whether it was
likely that the market could support such rents.

                                                    8
Table 3 Data Metrics Continued

                  Step                            Data Points                          Data Sources

    1) Define geographic units of      2009 Transportation Analysis          Metropolitan Washington
    analysis                           Zones (TAZ)                           Council of Governments

    2) Identify the amount of          Number of recent sales of             Maryland State Department of
    residual value in each TAZ equal   single-family properties              Assessments and Taxation
    to 75% of the average cost to                                            property database
    acquire single-family zoned        Value of recent sales of single-
    property                           family properties

    3) Calculate the required value
    each unit of the typology being
    evaluated must generate

    4) Convert the value per unit      5.5% Capitalization Rate1
    into a net annual rent

    5) Convert net rent into gross     Net rent is assumed to be             National Apartment Association
    annual rent to account for         approximately 65% of the gross        annual survey of apartment
    vacancy, operation costs, and      rent                                  operating costs
    taxes

    6) Convert gross annual rent
    into rent-per-square foot-per
    month

    7) Compare results to the rents                                          CoStar
    achieved in downtown Silver
    Spring

Summary of Typologies Evaluated

Staff developed six typologies to test in the model. For each typology staff created a typical scenario in
which a builder might redevelop the typical 7,000-8,000 square foot single-family parcels in TAZ 622.
The details for each typology are in table 4 following the descriptions.

Small Side-by-Side Duplex: The redevelopment of a single-family property into two units. These units
are each 1,000 square feet in size. This size is markedly lower than the average size townhome built in

1
 A capitalization rate is a mathematical technique to convert a lump sum value into a stream of equal payments
(or vice-versa). The lump sum is multiplied by a percentage; the lower the percentage the more investors are
willing to pay to purchase a property and the lower the required rents to make a development feasible. Within the
Washington D.C region capitalization rates of between 5% and 6% are typical.

                                                        9
Montgomery County in the last 10 years, which is approximately 1,800 square feet. This is however
larger than the 612 square foot unit idealized example of a side-by-side duplex highlighted on the
website https://missingmiddlehousing.com/types/duplex-side-by-side#documented, but is well within
the range of the typical duplex specification listed on that website. Staff assume these duplexes would
be one story tall, and thus construction costs are lower at $170 per square foot than the cost of larger
side-by-side duplexes.
Large Side-by-Side Duplex: The redevelopment of a single-family property into two units. These units
are each 1,800 square feet in size, similar to the average size of townhomes developed in Montgomery
County in the last 10 years. In addition, this is slightly larger than the recently built Railroad Cottages
project in Falls Church, a much-publicized recent example of a cottage court, which are around 1,500
square feet each. Construction costs for this duplex were assumed to be $185 per square foot, similar to
the expected cost to construct a moderate number of townhome units.
Moderate Density Townhomes: The redevelopment of two or three adjacent single-family properties
into six to nine 1,800 square foot townhome units. This size is similar to the idealized townhome layout
listed for the townhome typology on the website missingmiddlehousing.com/types/townhouse which is
1,750 square feet. As a result of building additional units, Staff assumed a small discount in construction
costs, estimated to be $180 per square foot, as compared to the large side-by-side duplexes.
High Density Townhomes: The redevelopment of four or more adjacent single-family properties into 18
or more 1,500 square foot townhomes. The size of the units is reduced compared to the moderate
density townhome scenario to ensure that the program would physically fit into the existing dimensions
of typical single-family properties. The density per acre and size of these townhomes is comparable with
some recent developments in Montgomery County, but does assume that the acquired properties are all
highly developable with few environmental restrictions. Each unit is considered to be a separate
structure and thus this typology is required to comply with the International Residential Code, a less
rigorous building code than the International Building Code that applies to commercial development and
buildings that contain three or more residential units. For this typology Staff assumed a discount in
construction costs, estimated to be $170 per square foot, compared to the moderate density
townhomes due to the efficiencies in building multiple units.
Stacked Triplex: The redevelopment of two adjacent lots into nine total units in three separate
buildings. This combination and re-subdivision of property reflects the process needed to convert the
existing R-60 zoning with the minimum 60’ lot width to a dimension more suitable to the triplex
typology; The optimal width for a triplex property according to missingmiddlehousing.com/types/triplex
is 40’ wide. Staff assumed each unit would be 1,000 square feet, the same size as the units in the
idealized example at the missingmiddlehousing.com website. This size is similar to the average unit size,
1,200 square feet, of the four triplex buildings built in the Washington, D.C region since 2000 according
to real estate database CoStar. The Construction of multiple stacked units in a single building would
need to conform to the International Building Code, and thus construction costs are more expensive per
square foot than townhome and duplex scenarios. Staff assumed a construction cost per square foot of
$205.
Sixplex: The redevelopment of an existing lot into a six-unit apartment building. Staff assumed each unit
would be 800 square feet, similar to the 765 square foot units depicted on
misingmiddlehousing.com/types/multiplex-medium as the idealized layout for a medium-sized multiplex
building. This size is smaller than the average unit size of the 24 six-unit buildings constructed in the
10Washington D.C region since the year 2000, which was 1,300 square feet according to the real estate
database CoStar. As with the triplex, this building would need to comply with the International Building
Code and staff assumed a per square foot construction cost of $205.
Details of Typologies Evaluated
The summary details of each typology evaluated and the development cost per unit excluding fees are in
the following table. Entitlement fees were included in the model for each TAZ. The applicable
transportation and school fees for development at the geometric center of each TAZ was assumed to
apply to all properties within that TAZ. Entitlement fees vary based on different ‘zones’ of the county,
and in some places are discounted to attract growth. Staff assumed that the triplex and sixplex buildings
would be subject to the entitlement fees for the ‘multifamily low-rise’ category, while duplex and
townhome buildings would be subject to the fees for the ‘single family attached’ category.
Table 4 Details of Typologies Evaluated
Typology Density Size Per Unit/ Construction Cost Total
(net/gross per Gross Building Per SF Development
acre)2 Area per existing Cost per Unit
7.5K SF lot (excluding
Entitlement Fees)
Small Side-by-Side 11 – 12/ 9 – 10 1,000 SF / 2,000 $170 $225K
Duplex (in TAZ 622) SF
Large Side-by-Side 11 – 12 / 9 – 10 1,800 SF / 3,600 $185 $440K
Duplex (in TAZ 622) SF
Moderate Density 17 – 18 / 20 – 21 1,800 SF / 5,400 $180 $430K
Townhomes SF
High Density 24 – 26 / 20 – 21 1,500 SF / 6,750 $170 $340K
Townhomes SF
Stacked Triplex 24 – 26 / 20 – 21 1,000 SF / 4,500 $205 $270K
SF
Sixplex 35 – 36 / 27 – 28 800 SF / 4,800 SF $205 $215K
Estimated Value of Newly Constructed Units
In order to estimate the residual value created by new development, Planning staff estimated the value
a new duplex and townhome unit would generate in each TAZ. Staff reviewed all sales occurring from
2018 to 2020 of townhomes built since 2010 and accounted for the size of the units. Townhomes were
2
Net density is the density of units on just the developable area, or the area that is contained within privately-
owned parcels. Gross density is the density of units within an area including the public-right-of-way and other
public properties. Public right-of-way accounts for approximately 20% of the land area in TAZ 622.
11selected as the comparison because they are also attached-for-sale product. Based on this review, staff
assigned an estimated value per square foot of new development to each TAZ outside of the agricultural
reserve that contains single-family residential zoning. The value per square foot of new space and per
1,800 square foot townhome unit assigned each TAZ in Montgomery County is shown in the following
map, figure 4. TAZ 606 and TAZ 622 were assumed to generate $475 per square foot of new attached
for-sale development, or $855,000 for a 1,800 square foot townhome.
Figure 4: Estimated value of a new townhome in each TAZ in Montgomery County outside of the
agricultural reserve that contains single family residential zoning
Model Results
Staff used the residual model described to evaluate the likelihood that builders would attempt to
acquire property to develop the different typologies detailed. The model demonstrates that
redevelopment of existing single-family homes requires generation of substantial new value due to the
high cost of land and the high cost of construction. Less intense uses even when valued at the high level
of new townhome product may not generate the new value needed to enable provision of many
additional units.
Table 5 lists the results of the analysis for TAZ 622, which are similar to the results in TAZ 606. To enable
a comparison of like-size projects, the results are harmonized at a hypothetical one-acre of
development. The cost to assemble multiple parcels into one acre of land in TAZ 622 is approximately
$3.95 million. As noted in the description of each typology, not every development type requires an acre
of land or acquisition of multiple properties. All numbers have been rounded to avoid providing a
perception of false precision.
12Table 5
Total Total Value Ratio of Residual Feasibility of
Residual
Typology Development Created (1 Value divided by Cost Potential
Value
Costs (1 acre) acre) to Acquire 1 Acre Development
Small Side-
by-Side $2.75 million $5.4 million $2.6 million 0.65 < 0.75
Duplex
Large Side-
by-Side $5.3 million $9.7 million $4.5 million 1.10 0.75 < X < 1.25
Duplex
Moderate
$15.0
Density $7.9 million $7.1 million 1.80 > 1.25
million
Townhomes
High
$17.8
Density $9.0 million $8.8 million 2.20 > 1.25
million
Townhomes
Staff adjusted the model to calculate the rents required for the triplex and sixplex product to generate
75% of the average cost of land in TAZ 622. Table 5 shows the results. Again, to enable a comparison of a
like-size projects, the results are harmonized at a hypothetical one-acre of development. All numbers
have been rounded to avoid providing a perception of false precision.
Table 6
Triplex Sixplex
Cost to Acquire 1 acre $3.0 million $3.0 million
Total Development Cost $7.0 million $8.2 million
Total Value Development must
$10.0 million $11.1 million
Generate
Value Each Unit must Generate $400K $309K
13Net annual Profit Required per
$22.0K $17.0K
Unit3
Gross Annual Profit required per
$33.8K $26.1K
Unit4
Rent per SF per Month $2.82 $2.72
Required Monthly Rent per Unit $2,800 $2,200
The results reported here are required to generate residual value equal to 75% of the average cost of
attaining land in TAZ 622, the lower bound of where development efforts are considered likely.
Currently CoStar reports that the 10 mid-rise developments built since the year 2000 in Downtown
Silver Spring5 achieved a high of $2.50 per square foot in the second quarter of 2018, and currently are
asking around $2.30 per square foot. CoStar reports that the eight high-rise developments achieved a
similar high of $2.50 per square foot in the second quarter of 2019, and currently achieve rents of
around $2.30 per square foot. The most expensive high-rise in downtown Silver Spring, 8250 Georgia
Avenue, achieves rents of $2.82 per square foot and offers a more central location and more in-building
amenities than the hypothetical triplex and sixplex units. These data indicate that the market for triplex
and sixplex units is unlikely to support the rents required to make efforts to build this type of product in
the neighborhood adjacent to Downtown Silver Spring likely to succeed at this time.
Income Required to Afford the Unit Typologies Evaluated
The analysis did not focus strictly on the provision of units that are dedicated affordable, so to
understand the affordability of the new development Planning staff calculated the amount households
would need to earn to spend less than 30% of income on housing. This analysis assumes the payment of
a 30-year fixed-rate mortgage at 4% interest for the for-sale products. This analysis did not include the
costs of taxes, insurance, utilities, and other costs that might be part of a more comprehensive
understanding of total housing cost. Thus, the estimates in Table 7 may be lower than the total amount
households must earn to spend less than 30% of income on housing.
Table 7
Typology Value of Unit/Monthly Annual Required Annual
Rent Mortgage/Rent Income
Custom Home $1.05 million $60K $200K - $201K
3
The conversion of total value to the net annual profit is done using an assumed 5.5% capitalization rate. For an
explanation of capitalization rates, see footnote 1 under Table 3
4
Gross rent includes portion of the rent paid by tenants that goes to operation of the property, insurance, taxes,
and other fees. For formula used to convert net profit to gross profit, see step 5 in Table 3
5
Dedicated affordable product was filtered from this search to ensure comparison of like-product.
14Small Side-by-Side
$475K $27K $90K - $95K
Duplex
Large Side-by-Side
$855K $50K $160 - $165K
Duplex
Moderate Density
$855K $50K $160 - $165K
Townhomes
High Density
$712K $40K $135 - $140K
Townhomes
Stacked Triplex $2,800 per month in rent $35K $110K - $115K
Sixplex $2,300 per month in rent $28K $85K - $90K
Conclusion
The market study made the following significant findings about redevelopment of existing single-family
properties into Missing Middle housing in the Adjacent Silver Spring neighborhoods:
• Due to the high cost of land and high cost of construction new Missing Middle housing would be
expensive to live in. However, it would be far smaller per unit and much less expensive than the
new custom homes built near downtown Silver Spring in recent years.
• Enticing developers to attempt to build Missing Middle housing would require significant
changes to the entitlement and subdivision process to reduce their discretionary nature.
Builders strongly feel that any desired typology must be allowed by-right if it is to be an
attractive alternative to building a new custom home.
• Allowing Missing Middle typologies to physically fit on the existing properties in the Adjacent
Silver Spring neighborhoods would require substantial changes to the existing development
standards.
• Feasible redevelopment of habitable single-family homes in the Adjacent Silver Spring
neighborhoods requires generating significant new value which at existing market values for the
typologies evaluated requires a substantial increase in density.
• The community faces a central decision about its future:
o If no action is taken, over time the existing housing stock will be slowly transformed by-
right under the existing zoning code and development standards into larger custom
homes that are less affordable. This will likely reduce the diversity that the Silver Spring
community values and increase the socioeconomic gap between the Adjacent
Communities and downtown.
o Enabling the private sector to create comparatively less expensive new housing options
that are accessible to a more diverse segment of the population requires substantial
changes to the zoning code, subdivision process, and entitlement process. However, this
may more quickly and dramatically change the neighborhood's physical character.
15• • • • • • •
Upper MM
Missing Middle
•
•
•
•• • • • • • •
•

•

•
•
•
•
•
••
•
•• • • • •
•

•

•

•

•

•

•
•
•
•
•
•
•
••
•

•

    •

    •

•

•

•

•
•
•

•

    •
• • • • • • • • • • •
•
•
•
•
•
•
Caveat: Property is not a commodity and many factors influence availability and price. It is possible that builders may find developable parcels at low costs even if a market-wide
analysis indicates that development is not likely. Conversely, It is possible that developers are unable to secure land even if the residual value far exceeds land values.
1) Define 2) Identify
Geography Asset Cost
Category Data Source Data Metric
Development Costs
Asset Value
Land Value of Single-Family
Homes
Units Created out of an
Existing 7.5K Square Foot
Lot
Net Density: Total number of units divided by the developable land (parcels only, not including ROW or public land)
Gross Density: Total number of units divided by the total land area (includes ROW and public land which comprise approximately 20% of TAZ 622)1) Target Value 2) Total Cost: Creation: Multiply land cost by Development Cost + desired Land Bank Entitlement Fees + (75%) Target Land cost
* Estimated cost to acquire one-acre of single-family detached properties in TAZ 622: $3.95 million* Income spent on housing assumed to be 30% of total income Mortgage assumed to be a 30-year fixed rate loan at 4% interest. Calculation does not include the cost of tax and escrow payments Rents set to generates residual value equal to 75% of the average cost of land
•

•

•

•

•
•
•
•• • • • • •
You can also read