Homelessness and the housing crisis - Parliament of Australia
←
→
Page content transcription
If your browser does not render page correctly, please read the page content below
Homelessness and the housing crisis
                                Inquiry into homelessness in Australia
                                                Submission
                                              Dr Duncan Rouch

                                                  12-6-20 b

A key factor in homelessness is the housing crisis. Image source (Homelessness Australia 2016). In this
report I address the term of reference: 2. factors affecting the incidence of homelessness, including housing-
market factors. In particular, I address the impact of housing-market factors on homelessness.

                                                                                                             1
Executive summary
The key housing market factor for increasing homelessness has been that rental prices have increased
higher than increases in consumer price index over at least the last 20 years, for instance, for Greater
Melbourne and major regional cities in Victoria. This is consistent with the increased numbers of
households in household stress across Australia, since 1995, in particular for NSW, Victoria and Queensland.
Across Australia, only 2 percent of private rentals are affordable for a person on the minimum wage.

This collapse in affordable rental has been particularly serious for people on welfare benefits, since their
incomes have only increased based on increases in the consumer price index, or others on low incomes, in
particular due to stagnation of salaries since the global financial crisis in 2007-08. Obviously, as rental prices
have continued to substantially increase higher than increases in consumer price index since before 2000,
people on low incomes have substantially increasingly suffered more housing stress.

As a result, for instance in Victoria, there has been a movement of the poorest people on welfare benefits
and those with low incomes to outer Melbourne areas and beyond into nearby regional areas. This has left the
city, particular in inner areas with mostly middle- and upper-class residents. These polarising changes in
addition apply to regional cities, in particular Greater Geelong, and also Greater Bendigo and Greater Ballarat.
In contrast, two regional cities, Horsham and Swan Hill, have been able to maintain more reasonable
housing rental affordability and housing rental prices.

Key drivers for increasing rental prices have been the investor negative gearing and capital gains tax
discount.

To substantially improve social inclusiveness, given the major failure of the capitalist housing market, it is,
therefore, necessary for governments at all levels to take substantial action to mitigate this market failure.

Required building construction to meet the demand for public housing and affordable
rental housing
By 2040, construction of an additional 291,900 public housing dwellings is required to meet the needs across
Australia, with the largest requirement in NSW and Victoria, followed by Queensland.

Also, construction of an additional 1,442,700 affordable rental housing dwellings is required by 2040 to meet
the needs across Australia, again with the largest requirement in NSW and Victoria, followed by Queensland.

Clearly, over the last 25 years, many state and federal governments have frittered away opportunities to address
the developing housing crisis, with very limited responses. In is now time for all levels of government to work
together to make major and effective responses to the crisis.

Return on Investment
For every $1.00 spent on construction of public housing and community housing, around $1.30 in total
turnover (or an additional $0.30 in turnover) can be generated in the economy.

                                                                                                                   2
Public Housing
Issues in delivering and managing public housing
In the context to address the substantial demand for public housing, State governments in NSW, Victoria,
and Queensland, in particular, have only provided very limited responses. For instance, in Victoria, the
Government’s Public Housing Renewal Program has been a failure. The current three redevelopment projects,
at North Melbourne, Northcote and Preston, only provide, at most, an extra 139 public/community housing
dwellings.
Additional current issues with public housing in Victoria include poor maintenance of public housing estates,
inequality in operation of the Victorian Housing Register, and lack of a modern rent payment BPay facility.
Better delivering and managing public housing
Public Housing Authority
To improve management and construction rates, it is recommended that a separate public housing authority be
set up in each state and territory. A major aim of the Authority will be to actively reduce the public
housing waiting list, including to arrange construction of new public housing stock, built or bought, to meet
the demand.
Government funding of public housing
It is more financially effective for a state or territory government to fully fund construction of new public
housing. Also, it is important to set up a dedicated major fund, similar to the Social Housing Growth Fund in
Victoria (DHHS 2018b), to support continual construction of new public housing, with annual targets, to
meet current and future needs. This approach will also help avoid ideology and short-term politics, that have
limited progress until now.
Use of existing surplus land
The state and territory governments should preferentially utilise existing available land to build additional
public housing to meet housing demand, or for other community infrastructures and services. For
instance, in Victoria, among sites currently available for sale it has been assessed that 90.9 hectares,
across 24 individual sites, would be suitable for public housing. Otherwise, funds provided by land sales could
be used to buy more appropriate land for building public housing, as per previous practice.
Affordable rental housing
Better delivering affordable rental housing Inclusionary zoning
Mandatory inclusionary zoning should a component of the strategy to help create more affordable rental housing,
to be implemented by state and territory legislation. For council-owned land the level can be substantial, for
example of at least 25 percent set-aside of affordable housing dwellings, as proposed by the City of Melbourne.
3Use of existing surplus land
As well as inclusive zoning, a council should be able to utilise surplus government and agency lands, and
potentially buy further land or properties or apartments, to reach the targets of affordable rental housing.
The priority for use of surplus land should be for construction of new public housing. The Government may
consider the use of further surplus land, or purchase additional land, for equity investment to support
construction of affordable rental housing.
Affordable rental housing planning policy
Each local council should develop an affordable housing planning policy for inclusion in the associated local
planning scheme.
Housing Trust
Each local council should preferentially set up a dedicated housing trust to manage/support of developing
affordable rental housing.
Affordable rental prices
The contract for housing providers should include limits of rental prices. In general, a rental price of people in
an affordable rental dwelling should only be up to 30% of income plus Commonwealth Rent Assistance.
Occupant selection
Preference to be given to people with low incomes who are already working in the local council area, and who
have been unable to find affordable rental housing in that area or adjacent suburbs.
Building quality
The quality of new buildings shall meet the requirements for standards including: Apartment Design Guidelines;
National Construction Code; environmentally sustainable design - Nationwide House Energy Rating Scheme
and Green Star.
Financing affordable rental housing
With reduced income compared to market rents, providers of affordable renting housing, require financial or
equivalent support by government. Three main options are effective: the government to retain equity, by
maintaining ownership of its land as a component of the housing project; the government to provide loans
to the housing provider, at below market rate, using a dedicated fund; for housing low-income tenants,
the housing provider can arrange financial support from the federal government, by Commonwealth Rent
Assistance.
Limits of State and Territory housing policies: example of Victoria
In 2017 The Government of Victoria announced its new housing policy, ‘Homes for Victorians’, as it’s response
to the housing (buying and renting) affordability crisis in Victoria. This policy is a good start but has a
number of serious limits, in particular very limited support for meeting the required demands for both
public housing and affordable rental housing
4Why the government is not trusted by the community to effectively addressing housing requirements
Given the low numbers of constructing new public housing dwellings in current plans, compared to the
increasing high demand, and the well-known lack of maintenance of existing public housing estates for
many years, it has been perceived by many in the community that the government is intending disinvestment
of public housing properties to private housing associations, and therefore to transfer responsibility for
housing highly disadvantaged people, without telling the community the truth of its intentions.
Where to from here for improved State or Territory Government policy for
housing?
The government should first acknowledge previous problems, then to discuss background issues, followed by
improved housing policy, and reasons for specific plans.
The government should also explain that it understands the importance of public housing. Then to explain that
we need a diverse housing system to meet all needs, and that housing providers are a key part of the system,
as providing a range of different affordable rental housing options. That is, the improved diverse housing
system to give people on lower incomes the freedom to make a real choice among affordable rental housing
options. Also, having a safe home supports disadvantaged people to better gain employment, and so
contribute to the economy, no matter what level of income they gain.
Advocacy at Federal level
To reduce the impacts of negative gearing and capital gains tax discount on housing affordability by
discouraging speculative tax-avoidance investments
It is recommended in particular that the Federal Government:
• Re-negotiate of the National Housing and Homelessness Agreement.
• Remove negative gearing, to be immediately limited to second-house investors, then gradually to be
phased out (To reduce the impacts of negative gearing on housing affordability by discouraging
speculative tax-avoidance investments).
• Removal of capital gains tax discount for housing investors (again to reduce the impacts of
negative gearing on housing affordability by discouraging speculative tax-avoidance investments.
In this context It would be useful for the State and Territory Governments to advocate for these improvements
in federal policy to better support public housing and affordable rental housing, as current policy on these
sectors at federal level is weak.
5Contents
Executive summary................................................................................................................................. 2
Introduction ........................................................................................................................................... 7
Catastrophic collapse in affordable rental housing ............................................................................... 9
Decreased rental affordability in Victoria ............................................................................................ 10
Melbourne metropolitan areas ....................................................................................................... 10
Increasing housing rental prices ...................................................................................................... 12
Regional areas of the State of Victoria ............................................................................................ 13
Increasing housing rental prices ...................................................................................................... 14
Impact of negative gearing and capital gains tax discount on housing affordability .......................... 15
What are negative gearing and capital gains tax discount? ............................................................ 15
Adverse impact of negative gearing and capital gains tax discount on housing affordability ........ 16
Discussion............................................................................................................................................. 17
Catastrophic collapse in housing rental affordability across Victoria ............................................. 17
Responding to market failure .......................................................................................................... 18
Redefining housing sectors .......................................................................................................... 18
Required building construction to meet the demand for public housing and affordable rental
housing ......................................................................................................................................... 19
Return on Investment .................................................................................................................. 23
Better delivering public housing .................................................................................................. 25
Better delivering affordable rental housing ................................................................................ 31
Limits of the Victorian Government’s ‘Homes for Victorians’ policy .......................................... 33
Where to from here for improved State Government policy for housing? ................................ 36
Conclusion ............................................................................................................................................ 38
References ........................................................................................................................................... 42
Appendix A. Calculating rental affordability ........................................................................................ 46
Appendix B. Estimating current demand for public housing and affordable rental housing and
forecasting future demand, 2018 to 2040 ........................................................................................... 48
Appendix C. Inclusionary zoning .......................................................................................................... 51
Appendix D. Proposal for a Council Housing Trust .............................................................................. 56
6Introduction
The causes of homelessness are many and varied. The domestic violence, a shortage of affordable housing,
unemployment, mental illness, family breakdown and drug and alcohol abuse all contribute to the level of
homelessness in Australia (DFHCSIA 2008). Homelessness is one of the most potent examples of
disadvantage in the community, and one of the most important markers of social exclusion. For instance,
those who sleep rough are among the most vulnerable and disadvantaged members of the community. They
experience a range of harms, such as violence, extreme weather conditions and poor diet, with lasting
impacts on their health and wellbeing that can worsen over time (DHHS 2018c).
According to the Australian Bureau of Statistics (2018) people are assessed as homeless when:
• Living in improvised dwellings, tents or sleeping out,
• In supported accommodation for the homeless,
• Staying temporarily with other households,
• Living in boarding houses,
• Staying in other temporary lodging,
• Living in 'severely' crowded dwellings.
Homelessness has been heavily increasing, from 2011-12 to 2017-18, in NSW, Victoria and the Northern
Territory, while smaller changes have occurred in other States and the Australian Capital Territory, Table 1.
In terms of per capita needs, the Northern Territory has the highest number of homeless people, at 377.3
per 10,000 population. Indeed, in the Northern Territory nearly 45 percent of all Indigenous households are
located below the poverty line. The greatest disparity between Indigenous and other households (nearly 35
percent) is also found in the Northern Territory. Also, what is especially worrying is that median personal
income for Indigenous individuals in the Northern Territory declined from $296 to $281 per week (adjusted
for inflation) between 2011 and 2016, while for other individuals that figure increased from $1,018 to $1,072
(Altman 2017).
7Table 1 Numbers of homeless people in States and Territories, Australia, 2011-12 to 2017-18
State or Clients 2011– 2012– 2013– 2014– 2015– 2016– 2017– Average annual
Territory 12 13 14 15 16 17 18 change, 2011–
12 to 2017–18,
(per cent)
NSW Number 52,105 51,953 51,786 48,262 69,715 74,216 71,628 5.4
Per 72.2 71.1 69.9 64.2 91.4 95.9 91.1 4.0
10,000
ERP
Victoria Number 86,150 92,462 99,892 102,793 105,287 109,901 116,872 5.2
Per 155.6 163.6 172.9 174.2 174.5 177.9 184.8 2.9
10,000
ERP
Queensland Number 42,487 43,001 43,751 44,213 42,543 41,438 41,118 -0.5
Per 94.9 94.1 94.0 93.6 88.9 85.5 83.4 -2.1
10,000
ERP
Western Number 21,190 21,417 21,437 23,021 24,203 24,626 23,739 1.9
Australia Per 90.0 88.3 86.0 91.2 95.1 96.2 92.0 0.4
10,000
ERP
South Number 19,497 21,342 21,655 21,116 20,898 20,771 19,641 0.1
Australia Per 118.9 128.8 129.5 125.1 122.8 121.3 114.0 -0.7
10,000
ERP
Tasmania Number 6,148 5,585 6,614 7,328 7,859 7,789 6,508 1.0
Per 120.2 109.1 129.1 142.6 152.5 150.5 124.9 0.6
10,000
ERP
ACT Number 5,602 5,367 5,338 4,987 4,652 4,585 4,026 -5.4
Per 152.2 142.5 139.1 128.1 117.3 113.6 98.1 -7.1
10,000
ERP
Northern Number 6,584 6,959 7,123 7,649 8,132 9,187 9,285 5.9
Territory Per 284.6 294.9 293.4 314.0 331.9 373.8 377.3 4.8
10,000
ERP
ERP, the rate of homeless clients per the 10,000 estimated resident population. Source (Australian Institute
of Health and Welfare 2018).
Household stress is a risk to becoming homeless. The numbers of households in household stress due to
household costs greater than 30 percent of income, including homeless households, has substantially
increased in NSW, Victoria and Queensland from 1995 to 2018, while smaller changes have occurred in other
States and the Australian Capital Territory, Figure 1. These numbers are a measure of the need for additional
public housing and affordable rental housing.
8450.0
400.0
350.0
Households (thousands)
NSW
300.0
Vic
250.0 QLD
200.0 SA
WA
150.0
Tas
100.0 NT
ACT
50.0
0.0
1995 2000 2005 2010 2015
Year
Figure 1. Numbers of households in household stress due to households costs greater than 30 percent of
income, including homeless households, States and Territories, Australia, as a measure of the need for
additional public housing and affordable rental housing. Source (Australian Bureau of Statistics 2019b).
Decreased rental affordability is clearly a major issue on increasing household stress, particularly in NSW,
Victoria and Queensland.
Catastrophic collapse in affordable rental housing
Across Australia, only 2 percent of private rentals are affordable for a person on the minimum wage. Less than
1 percent are affordable for a single person on the pension. There are around 650,000 households which
cannot afford housing at market rates in Australia now and this figure is projected to reach over a million by
2036 (Raynor et al 2019).
As Peter Mares has argued, the current housing crisis is resulting in cities becoming geographically polarised into
locations of privilege in the centre, and in outer areas, clusters of the disadvantaged (Mares 2018).
If this trend continues to increase in future inner city areas, for instance in Melbourne, then (a) the city will
not be able attract enough staff on low incomes to run food and other services, especially if they need to travel
two hours or more to reach work and (b) the state will have further increases in public/community housing
waiting lists and increased numbers of homeless people.
Next, I look at this issue for the State of Victoria, as a key example.
9Decreased rental affordability in Victoria
Melbourne metropolitan areas
In Melbourne most increases in public housing waiting lists occurred in Melbourne Inner areas, in particular
western Melbourne (Ascot Vale (City of Moonee Valley)/Carlton (City of Melbourne)/Footscray (City of
Maribyrnong)/North Melbourne (City of Melbourne)) and north eastern Melbourne (Preston (City of
Darebin)). Smaller increases were seen in Melbourne Outer. This difference may be due to decreasing
affordability of housing including higher rents in Melbourne Inner compared to Melbourne Outer.
To assess housing rental affordability, data was taken from urban cities that each have a DHHS housing
office (DHHS 2019a). This method allows a reasonable overlap of each DHHS selection area over the local
urban city area, where the edge of a DHHS selection area may be roughly defined as midpoints between
nearest other DHHS housing offices.
For selected Melbourne inner areas reasonable rental affordability occurred in the period 2000 to 2005, but
then fell to around 5 percent in the period 2008 to 2016, and further to about just 2 percent by 2019,
except for City of Melbourne, where rental affordability remained below percent for the entire period,
Figure 1.
A similar pattern occurred for Greater Melbourne outer areas, though remained at higher affordability
compared to Melbourne inner areas, and was about 10 percent by 2019, Figure 2.
Rental affordability: selected Melbourne inner areas
100.0%
90.0%
80.0%
70.0%
60.0%
Darebin
50.0%
Maribyrnong
40.0%
Melbourne
30.0%
Moonee Valley
20.0%
10.0%
0.0%
Figure 1. Long-term housing rental affordability in selected Melbourne inner areas, March 2000 to
September 2019. Data source (DHHS 2019). This method is based on data of the urban cities that have a DHHS
housing office. For the definition of rental affordability see Appendix A.
10Rental affordability: selected Melbourne outer areas
100.0%
90.0%
80.0%
70.0%
60.0% Brimbank
50.0%
Frankston
40.0%
30.0% Greater Dandenong
20.0% Hume
10.0%
0.0%
Figure 2. Long-term housing rental affordability in selected Melbourne outer areas, March 2000 to
September 2019. Data source (DHHS 2019a).
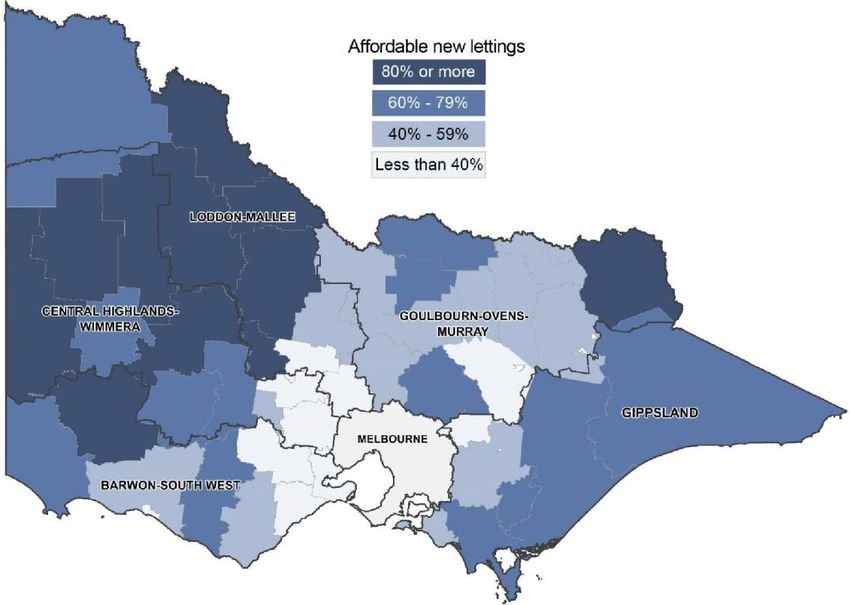
A summary of current rental affordability across Greater Melbourne is shown in Figure 3. In general Melbourne
inner areas currently have very low rental affordability, while Melbourne outer areas have little more rental
affordability. The specific data discussed above is in line with this summary.
Figure 3. Proportion of affordable rental dwellings in Metropolitan Melbourne at September 2019. Source (DHHS
2019b).
11Increasing housing rental prices
Decreasing housing rental affordability is generally associated with increasing rental prices. For the Melbourne
Inner areas rental prices have tended to increase higher than the rate of inflation since 2000, especially for
Footscray, Moonee Ponds/Ascot Vale and Preston, as indicated by median rental prices, Figure 4. This trend
includes a peak around 2009, associated with the collapse in rental housing affordability (Figure 1),
followed by a slight decrease to 2015, then an increasing trend to 2018.
That housing rental prices have substantially increased above inflation, over time, is problematic for people
supported by welfare benefits, as these are generally only raised according to increases in the Consumer
Price Index. In addition, given the substantial increases of rental prices above inflation, it is likely that
working people on low incomes, which may have not increased incomes for a number of years following the
Global Financial Crisis, 2007-09, also have decreasing rental options in Melbourne inner areas.
Median rental prices: Melbourne inner areas
$600.00
Carlton-Parkville
$500.00
North Melbourne-West
$400.00 Melbourne
$300.00 Footscray
$200.00 Moonee Ponds-Ascot Vale
$100.00
Preston
$0.00
CBD-St Kilda Rd
Figure 4. Median housing rental prices for Melbourne inner areas, March 2000 to September 2019. Rental
data (DHHS 2019c), adjusted for inflation by Consumer Price Index (Reserve Bank 2020) to $2019.
A similar trend of housing rental prices increasing over the rate of inflation has occurred for Melbourne
outer areas, though these still remain cheaper than for Melbourne inner areas, Figure 5.
12Median rental prices: Melbourne outer areas
$400.00
$350.00
$300.00
Sunshine
$250.00
Broadmeadows-Roxburgh
$200.00 Park
$150.00 Dandenong
$100.00 Frankston
$50.00
$0.00
Figure 5. Median weekly housing rental prices for Melbourne outer areas, March 2000 to September 2019.
Rental data (DHHS 2019c), adjusted for inflation by Consumer Price Index (Reserve Bank 2020) to $2019.
Regional areas of the State of Victoria
To assess rental affordability in regional areas data was taken for the cities that each have a DHHS housing
office, for each local government area (DHHS 2019a). This method focusses on the local city which is likely to
have the majority of dwellings in the area, and so provide a reasonable average value.
Bendigo, Ballarat and especially Geelong have significantly lower affordability than Horsham and Swan Hill,
Figure 6. In the case of Bendigo, it has been concluded that diminishing vacancy rates, rising rents and a
limited supply of affordable rental properties are factors compounding the pressures on tenants, to the
point where more families are facing homelessness (D'Agostino 2019).
Rental affordability: selected regional cities
100.0%
90.0%
80.0%
70.0%
Ballarat
60.0%
50.0% Greater Bendigo
40.0% Greater Geelong
30.0% Horsham
20.0% Swan Hill
10.0%
0.0%
Figure 6. Long-term housing rental affordability in selected regional cities, March 2000 to September
2019. Data source (DHHS 2019a). For the definition of rental affordability see Appendix A.
13A summary of current rental affordability across regional Victoria is shown in Figure 7. In general, areas
closer to Melbourne tend to have lower rental affordability. In part this is due to disadvantaged people
moving out from Melbourne to associated regional areas to find cheaper rental dwellings. As a result,
rental prices have increased significantly in regional areas and locals have been finding it more difficult to
find a home to rent, for instance in Gippsland (Chalkley-Rhoden 2017).
Figure 7. Proportion of affordable rental dwellings in Regional Victoria at September 2019. Source (DHHS
2019b).
Increasing housing rental prices
For the selected regional cities housing rental prices also increased above the inflation rate, though slightly less
than for Melbourne outer areas, Figure 8. The highest increases were for Greater Geelong, which
corresponds to the lowest rental affordability among these regional areas, Figure 8, followed by Greater Ballarat
and Greater Bendigo. In contrast, while rental prices increased above inflation rate for Horsham and Swan
Hill, these prices remained lower than for the other regional cities, which also corresponds to higher rental
affordability for these two cites compared to the others, Figure 8.
14Median rental prices: selected regional cities
$400.00
$350.00
$300.00
$250.00 Greater Ballarat
$200.00 Greater Bendigo
$150.00 Greater Geelong
$100.00 Horsham
$50.00 Swan Hill
$0.00
Figure 8. Median weekly housing rental prices for selected regional cities, March 2000 to September 2019.
Rental data (DHHS 2019c), adjusted for inflation by Consumer Price Index (Reserve Bank 2020) to $2019.
Impact of negative gearing and capital gains tax discount on housing affordability
What are negative gearing and capital gains tax discount?
Tax concessions for investment in housing include a 50% discount off normal individual tax rates on capital
gains together with so-called ‘negative gearing’ arrangements, which allow investors to deduct ‘losses’ made
on rental property investments (including interest on loan re-payments) from other income (including
wages).
Deductions can, of course, be claimed for losses on other kinds of investments and this would not normally
be regarded as a ‘tax concession’. The unique feature of ‘negative gearing’ for investments in assets such as
property, shares, and agricultural schemes is that income from these investments often comes mainly from
capital gains, the increase in the value of the asset over time. Under the Capital Gains Tax rules these are
only taxed when the asset is sold, and then at half the marginal tax rate. Yet expenses associated with the
investment (especially interest payments on loans) can be deducted from tax annually and often exceed
rental income. The tax system treats this as a ‘loss’. These ‘losses’ can be offset against other income that
would otherwise be taxed at the full marginal rate (mainly wages). In reality, in most cases the investment is
not making a ‘loss’ because it is accruing capital gains. Otherwise there would be no point investing in these
assets. If the tax system properly matched income and deductions, then either capital gains would be taxed
each year at normal marginal tax rates or deductions for ‘losses’ could not be offset against other income
until the capital gains are taxed on sale of the asset.
Whenever deductions for investment expenses are not properly matched with income, there is always a risk
that people will maximise ‘losses’ to avoid tax on their other income. This is achieved by structuring debt so
that interest expenses on loans to purchase the asset exceed income from the investment such as rent, for
instance by using more expensive ‘interest only’ loans (often with flexible interest re-payments so that
investors can ensure their costs always exceed rental income), or by borrowing more to buy second and third
properties as soon as the first one turns a ‘profit’.
15In recent years, since superannuation legislation was amended to allow it, investors have been encouraged
to borrow to invest in rental property through self-managed Super funds. A major advantage of this strategy
is that capital gains on the sale of assets in Super funds are normally free of tax.
Negative gearing is mainly used for rental property investment because housing is perceived to be a safe
investment to borrow against, but it is also used to invest in agriculture (for example pine plantations), and
shares (‘leveraged equity’).
Adverse impact of negative gearing and capital gains tax discount on housing
affordability
Given that most negatively geared investment is in rental property, these schemes impact especially on
housing markets. They encourage borrowing to speculate on housing prices, rather than patient investment
in housing to achieve the best long-term rental yield (ACOSS 2016).
The large-scale use of these tax schemes not only threatens public revenue and faith in the fairness of our
tax system. It also reduces the efficiency of investment by encouraging people to invest with tax avoidance in
mind rather than to achieve the best return at the least risk. It destabilises the economy by encouraging
people to borrow more than they otherwise would and adding fuel to booms in asset prices, which are often
followed by recessions (ACOSS 2016).
Contrary to claims that negative gearing encourages new investment in affordable housing, over 90 percent
of investment in negatively geared housing stock is in existing properties (Eslake 2014). This means that,
along with other housing subsidies that mainly support the purchase of existing properties, they are more
likely to inflate prices than make housing more affordable. For this and the other reasons, including
population growth, the boom in rental property investment from 1998 to 2004 did not increase rental
vacancy rates, which, for instance, fell from 2001 to 2007. It has instead raised home prices, and also
distorted the profile of investment properties and housing investors to the long-term disadvantage of low
and middle income tenants (ACOSS 2016).
Negative gearing and the Capital Gains Tax discount are not the only drivers of inflation in house prices and
rents, but they have become a much more important factor as investors have purchased a growing share of
dwellings. It is sometimes argued that these tax arrangements cannot be a cause of the latest housing price
boom because they have been in place for many years, across a number of housing cycles. This does not
mean that they had no influence on house prices. In its analysis of the causes of the last housing boom in the
early 2000s, the Reserve Bank concluded that it was the combination of these long-standing tax
arrangements and easier access to credit that drove higher demand for properties among investors (ACOSS
2016).
There was a major change to the tax treatment of investment property in 2000. Tax rates on individual
capital gains were halved, while retaining negative gearing arrangements. This made negative gearing much
more attractive. The effect of this change was not limited to rental property investment but in practice most
investors who use negative gearing invest in housing because it is perceived to be less risky to gear into an
investment in bricks and mortar. The 50% Capital Gains Tax discount fuelled an old-fashioned Australian
property boom. Overall, between 2000 and 2013 lending commitments for investment housing rose by 230
percent compared with a rise of 165 percent in lending for owner occupied housing (ACOSS 2016).
Long standing tax policies such as negative gearing may not be the trigger for housing price booms but they
accentuate their impact by encouraging investors to borrow more to punt on a further rise in prices. The tax
16treatment of housing pours fuel on the fire. As in previous housing booms, the Reserve Bank has been
concerned that speculative demand by investors may amplify the housing price cycle and increase the
potential for prices to fall later on (Reserve Bank 2015).
Discussion
Catastrophic collapse in housing rental affordability across Victoria
The data assessed here are well in agreement with Mares’ conclusion, that the current housing crisis is resulting
in cities becoming geographically polarised into locations of privilege in the centre, and in outer areas, clusters
of the disadvantaged (Mares 2018)
This has resulted in substantial collapses in rental affordability for key Melbourne inner areas (2000 to 2008),
and the subsequent reduction of rental affordability for outer areas of Melbourne (by 2011). As a result,
there has been a movement of the poorest people on welfare benefits and those with low incomes to
Melbourne outer areas and beyond into nearby regional areas. This has left the city, particular in inner areas
with mostly middle- and upper-class residents.
These polarising changes in addition apply to regional cities, in particular Greater Geelong, and also Greater
Bendigo and Greater Ballarat. In contrast, Horsham and Swan Hill have been able to maintain reasonable
housing rental affordability and housing rental prices.
The absence of affordable rental housing in the City of Melbourne since before 2000, and the collapse of
rental affordability across Greater Melbourne, and regional cities, in the last ten years, especially with rental
prices increasing at rates substantially above consumer price index increases is a particularly serious issue.
The long-term lack of rental affordability across Greater Melbourne and regional cities can be seen as a
major failure of the capitalist housing market. That is, particularly serious for people on welfare benefits, since
their incomes have only increased based on increases in consumer price index, or others on low incomes, in
particular due to stagnation of salaries since the global financial crisis in 2007-08. So, these people have
increasingly been unable to find affordable rental housing, as rental prices have increased at rates higher
than CPI. Further, Commonwealth rental assistance is also increased only according to CPI values (Services
Australia 2020), and therefore of increasingly limited value. It is, then, hard to overestimate the deleterious
impact of the increasing lack of rental affordability on people supported by welfare benefits or
otherwise low incomes. These disadvantaged people also tend to suffer a large range of major difficulties
compared to others. For 10 out of 14 issues, in the 3 percent bottom disadvantaged areas in Victoria at least
two-fold more people suffer these issues compared to people in other localities, Table 2.
17Table 2 Comparing issues for people in the 3% most disadvantaged localities to those in the other localities in
Victoria*
Issue Bottom 3% areas The other 97% areas Ratio 3% to 97%
(percentage of (percentage of areas
people) people)
Overall low level of education 9.7 3.6 2.7
Absence of post school qualifications 54.6 41.0 1.3
Unskilled workers 24.0 15.6 1.5
Young adults not engaged 11.8 5.5 2.2
Disability support 13.0 5.5 2.4
Unemployed 8.0 3.2 2.5
Long term unemployed 5.5 1.9 2.9
Rent assistance 10.9 6.2 1.8
Child maltreatment 5.4 1.8 3.1
Criminal convictions 12.9 6.6 2.0
Juvenile convictions 1.2 0.4 3.4
Domestic violence 6.2 2.4 2.6
Prison admissions 1.4 0.5 2.8
Psychiatric admissions 1.5 0.9 1.8
*, Reference (Vinson et al 2015). Yellow highlight, ratio of 3% areas to 97% areas of at least 2.
A key contributing factor to lack of rental affordability is the substantial total immigration rate for Australia,
which is bringing in numbers of people equating to the population of Canberra City every two years (Abbott
2020).
To substantially improve social inclusiveness, it is, therefore, necessary for governments at all levels to take
substantial action to address this market failure.
Not to take action will result in the substantial loss of staff on low incomes to support services in the
City of Melbourne, and increased pressure on housing in regional cities and towns, due to people on
low incomes, including welfare, moving out of the city to find lower rental costs. Also, without substantial
action, numbers of people waiting for public housing will continue to increase, as will numbers of homeless
people.
Responding to market failure
Redefining housing sectors
Public housing should be entirely responsible for supporting people with very low socio-economic status, as
first call for housing disadvantaged homeless people, according to the Housing First strategy (Waegemakers
18Schiff and Rook 2012), and therefore be a key component of an integrated housing strategy. Given the rental
market failure, there is also a substantial requirement for government to support private affordable rental
housing. This sector, therefore, should also be recognised as a key component of an integrated housing
strategy. In this context, Community Housing Associations along with private affordable housing providers,
should be assigned to the affordable rental housing sector.
It should, therefore, be recognised that public housing and community housing are essentially different and so
complimentary in aims and purposes Table 3.
Table 3 Different characteristics of public housing and affordable rental housing
Characteristic Public housing Affordable rental housing*
Rental costs 25% of income or assessed rental price, 30% of income plus Commonwealth Rent
whichever is less Assistance
Client groups Very low and Low income groups Low and Moderate income groups
Tenure Indeterminate (mutually agreed term) Rental contracts, commonly by year
A wider range of locations and types of
Value Better suits Housing First support
housing
*, includes community housing. Income groups are defined in Appendix A.
Clearly, an integrated housing strategy is required to optimally meet current and future housing needs. A
further value is that each sector can be specifically defined according to needs and required resources.
Therefore, ambiguous terms, like social housing or affordable housing can be discarded from policy
' '
considerations, to improve transparency and reduce confusion.
So, under an integrated housing strategy, substantial further construction of both public housing and private
affordable rental housing are optimally required to meet current and future needs.
Required building construction to meet the demand for public housing and affordable rental housing
To assess the requirements for both public housing and affordable rental housing I have developed an updated
housing demand model (Appendix B), based on (Lawson et al 2018). The demand model created by
Lawson and colleagues provides combined current and forecast needs, to support professional forward
planning, and to avoid common limited crisis responses and limited ideological-bases responses. The
updated demand model addresses both current needs and future needs forecast to 2040, for all States and
Territories, and differentiation of needs for capital cities and regional areas.
By 2040, construction of an additional 291,900 public housing dwellings is required to meet the needs across
Australia, with the largest requirement in NSW and Victoria, followed by Queensland, Table 4a.
Also, construction of an additional 1,442,700 affordable rental housing dwellings is required by 2040 to meet
the needs across Australia, again with the largest requirement in NSW and Victoria, followed by Queensland,
Table 4b.
19These demand numbers are consistent with the general needs shown in Figure 1, with NSW, Victoria and
Queensland featuring with substantially increasing needs since 1995. These three States also have the
highest numbers of homeless people, 2017-18, Table 1.
Table 4a Current and forecast demand to 2040 for public housing dwellings
Public housing share Manifest need Total public
Current Projected to Projected housing need
(met) 2040 Current to 2040 2018–2040
State or Territory (’000) (’000) (’000) (’000) (’000)
Greater Sydney 74.1 23.5 19.5 6.2 49.2
Rest of NSW 41.9 13.3 13.5 4.3 31.0
Total 115.9 36.8 33.0 10.5 80.2
Greater Melbourne 44.2 18.7 40.3 17.0 76.1
Rest of Victoria 20.1 8.5 13.5 5.7 27.6
Total 64.3 27.2 53.8 22.7 103.7
Greater Brisbane 26.1 9.4 9.1 3.3 21.7
Rest of Qld 28.6 10.3 9.9 3.5 23.7
Total 54.7 19.6 18.9 6.8 45.4
Greater Perth 20.7 7.7 6.0 2.2 15.9
Rest of WA 12.6 4.7 4.9 1.8 11.4
Total 33.3 12.3 10.9 4.0 27.3
Greater Adelaide 26.5 4.0 6.7 1.0 11.7
Rest of SA 7.6 1.2 2.3 0.4 3.8
Total 34.1 5.2 9.0 1.4 15.6
Greater Hobart 3.4 0.32 0.1 0.01 0.4
Rest of Tasmania 3.8 0.36 2.9 0.28 3.6
Total 7.2 0.68 3.0 0.28 4.0
ACT 11.2 4.4 1.9 0.74 7.0
Greater Darwin 2.9 0.91 0.0 0.01 0.9
Rest of NT 7.2 2.3 4.3 1.3 7.8
Total 10.1 3.2 4.3 1.3 8.8
Australia 330.9 109.3 134.8 47.7 291.9
Source (this study), see Appendix B for method.
20Table 4b Current and forecast demand to 2040 for affordable rental housing dwellings
Community housing share Evident need Total affordable
Current Projected to Projected rental housing
(met) 2040 Current to 2040 need 2018–2040
State or Territory (’000) (’000) (’000) (’000) (’000)
Greater Sydney 25.8 8.2 232.4 73.7 314.3
Rest of NSW 14.6 4.6 131.4 41.7 177.7
Total 40.3 12.8 363.8 115.4 492.0
Greater Melbourne 11.1 4.7 167.1 70.6 242.3
Rest of Victoria 5.1 2.1 75.8 32.0 110.0
Total 16.2 6.8 242.9 102.6 352.3
Greater Brisbane 7.8 2.8 116.1 41.7 160.5
Rest of Qld 8.5 3.1 126.8 45.5 175.4
Total 16.3 5.9 242.9 87.2 335.9
Greater Perth 6.7 2.5 61.6 22.8 86.9
Rest of WA 4.1 1.5 37.5 13.9 52.8
Total 10.8 4.0 99.1 36.6 139.7
Greater Adelaide 9.7 1.5 59.1 8.9 69.5
Rest of SA 2.8 0.4 17.0 2.6 20.0
Total 12.5 1.9 76.1 11.5 89.5
Greater Hobart 2.9 0.3 8.9 0.8 10.1
Rest of Tasmania 3.2 0.3 10.0 0.9 11.3
Total 6.1 0.57 19.0 1.8 21.3
ACT 0.90 0.36 7.2 2.9 10.4
Greater Darwin 0.64 0.20 0.16 0.05 0.42
Rest of NT 1.59 0.50 0.41 0.13 1.03
Total 2.24 0.70 0.57 0.18 1.45
Australia 105.3 33.0 1051.5 358.2 1,442.7
Source (this study), see Appendix B for method.
Example construction plan
To meet the housing needs, Table 4a and Table 4b, I present an example construction plan for Victoria, Table 5.
Construction of more public housing should begin in the first year, starting at 6,000 dwellings per year (Lawson
et al 2018), and ramping up to 8,000 dwellings per year.
The government to also promote building of affordable rental housing, starting at 14,000 dwellings, then
ramping up to 25,000 dwellings per year by 2030. That is, to have a maximum collective construction rate of
30,000 dwellings per year, given the potential limit of construction activities by local building companies.
Housing needs should be regularly reviewed, for instance, every three years, to assess if any changes in the
construction plans are required. The construction plan provides tapering of numbers of dwellings towards
the end of the planned period, to allow a change to increased construction, or conversely, early completion,
according to adjusted needs.
21Table 5 Example annual construction plan for public housing and affordable rental housing dwellings for Victoria
2021 to 2040
PH ARH
Rolling Rolling
dwellings dwellings
total total
Year per year per year
2021 6,000 6,000 14,000 14,000
2022 7,000 13,000 16,000 30,000
2023 8,000 21,000 20,000 50,000
2024 8,000 29,000 22,000 72,000
2025 8,000 37,000 22,000 94,000
2026 7,000 44,000 23,000 117,000
2027 6,000 50,000 24,000 141,000
2028 6,000 56,000 24,000 165,000
2029 6,000 62,000 24,000 189,000
2030 5,000 67,000 25,000 214,000
2031 5,000 72,000 25,000 239,000
2032 5,000 77,000 25,000 264,000
2033 5,000 82,000 25,000 289,000
2034 4,000 86,000 25,000 314,000
2035 4,000 90,000 25,000 339,000
2036 4,000 94,000 25,000 364,000
2037 4,000 98,000 20,000 384,000
2038 3,000 101,000 15,000 399,000
2039 2,000 103,000 13,000 412,000
2040 700 103,700 1,900 413,900
PH, Public Housing; ARH, Affordable Rental Housing.
These numbers may look large, but it should be remembered that during post war reconstruction, between 1945
and 1949, 132,000 new houses and flats had been constructed to provide homes for an estimated 600,000
people (Powell and Macintyre 2020).
Addressing the demand for affordable rental housing is especially important as this sector tends to be
ignored in development of housing policy by governments.
For example, to meet total projected demand for affordable rental housing in the City of Melbourne, between
13.3 percent and 21.5 percent of the City’s total dwelling stock in 2036 would need to be affordable rental
housing (SGS Economics and Planning 2019).
Councils would benefit from a multi-stranded strategy to reach the targets for affordable rental housing in
their local area, as discussed in the ‘Advocacy’ section. In contrast, in cities in the USA, that have only used
inclusionary zoning, the outcomes are rather low numbers of affordable rental housing (Appendix C).
22Return on Investment
For every $1.00 spent on construction of public housing and community housing, around $1.30 in total
turnover (or an additional $0.30 in turnover) was generated in the economy, by the Rudd Government’s Social
Housing Initiative implemented over the period 2009 to 2012 (KPMG 2012). The economic value of this
approach is that it brings longer-term economic benefits, through improvements in workforce participation
and productivity, as more people with below-average wages can live closer to suitable jobs, especially in
cities (ACOSS 2019).
I present a model for housing homeless people with support to become capable of contributing to the
community and economy through employment, Figure 9. The left-hand stream is designed for people with
housing stress, at risk of homelessness. The middle stream, with people having a short crisis, is designed to
help these people gain a home quickly, in short-term private rental housing, to reduce the risk of becoming
chronically homeless, right-hand stream, which includes Housing First type services. Transitional Housing
(for instance, short-term rental support for private rental housing) is quoted in the ‘Homes for Victorians’
strategy (Vic Gov 2017). Housing First type services are cited in the plan for the Victorian Housing Register
(Sheriff 2016). People with long-term mental health issues may be periodically unable to work, and so on
average have very low incomes, and so require public housing.
The option to transfer to public housing is currently effectively unavailable in the short-term, either from
middle- or right-hand streams due to the substantial current waiting list for public housing dwellings. There
is also a current waiting list for affordable rental housing.
Social values in further providing affordable rental housing, include reduction of homelessness, as the
affordable rents, security of tenure, and other supports available to financially vulnerable people in public
housing reduces their risk of homelessness by more than half (ACOSS 2019).
Secure, affordable housing also greatly improves people’s capacity to find employment, recover from family
and domestic violence, and improve their health in the face of chronic illness. This in turn reduces the cost of
health and community services (ACOSS 2019).
In addition, families with low incomes who find affordable housing, helps them to gain financial stability that
improves children’s health and wellbeing and capacity to engage in education (ACOSS 2019).
23Figure 9. Model for housing homeless people with support to become capable of contributing to the community
and economy through employment. Types of homeless people are according to Australian Bureau of Statistics
(2018). The levels of very low income, low income and moderate income are shown in Tables A2 and A3,
Appendix A.
In this context it is also important for policymakers to understand the economic value of housing renting, as
they have seemed for many years to instead favour the leverage to create homeownership, often via “all-
in” wealth and highly leveraged financing strategies. Nevertheless, households that follow such a
homeownership strategy are likely to grow their wealth more slowly on both a raw and risk-adjusted basis,
compared to renters. This difference occurs due to the high numbers of homeowners that place down payment
and mortgage payments which together are overwhelmingly high portions of their overall wealth (Beracha et
al. 2017).
24By corollary, people with low incomes are likely to be more able to contribute to the economy, with affordable
rental housing costs, compared to mainstream high market rental costs.
To assess issues in better delivering public housing and affordable rental housing I use the examples of such
issues in the State of Victoria.
Better delivering public housing
The key economic and social values of public housing are that (a) of a mutual long-term tenure, and (b) rental
costs are at a maximum of 25% of income (DHHS 2019d). These factors are in line with the internationally
supported Housing First strategy (Waegemakers Schiff and Rook 2012), which help homeless people, along
with welfare and health support, to rebuild their lives, with the potential to enter or re-enter the workforce,
or otherwise contribute to the community through voluntary activities, based on a safe home.
Here I discuss the issues in delivering and managing public housing, utilizing Victoria as an example. In
Victoria the Department of Health and Human Services (DHHS) is responsible for delivering and managing
public housing.
Issues in delivering and managing public housing
In the context to address the major demand for public housing, Table B1, the Victoria Government’s Public
Housing Renewal Program has been a significant failure. The current three redevelopment projects, at North
Melbourne, Northcote and Preston, only provide, at most, an extra 139 public/community housing dwellings,
just 0.25 percent of the current demand, for 53,800 dwellings (Table 4a). This program is discussed further
below. In addition, Victoria has the highest demand for additional public housing compared to all other
states and territories (Table 4a).
Additional current issues with public housing include poor maintenance of public housing estates, inequality in
operation of the VHR, and lack of a modern rent payment BPay facility.
Poor maintenance of public housing estates
DHHS’ public housing asset management framework, in its current state, remains disjointed, poorly
communicated, and out of date in key areas. DHHS lacks a comprehensive understanding of its asset management
performance, a result of dysfunctional governance arrangements, minimal performance measures and
ineffective arrangements for collecting property condition data. These weaknesses impair DHHS’ ability to
make informed decisions about asset planning (Victorian Auditor-General 2017).
The effective management of public housing assets requires accurate property condition data to target
funding appropriately. This data should capture both asset condition and maintenance costs to inform the
asset management strategy and correctly prioritise works across the portfolio. Also, regional field officers
should undertake property condition audits (PCAs) every three years to provide an estimate of property
condition (Victorian Auditor-General 2012).
Eight years after the initial critical report, in May this year, the State Government announced $155 million,
would go towards upgrading and repairing more than 15,000 public housing units, with a further $110
million set aside to build new kitchens and bathrooms for 2,100 units. At least 25 per cent of this funding
25will be earmarked for regional areas (Ilanbey 2020). Again, maintenance of public housing properties should
be managed through a long-term plan, and not by once-off political announcements. A practical management
framework solution is presented lower in this report.
Inequality in operation of the Victorian Housing Register
On average there are much longer waiting times for Victorian Housing Register (VHR) offers to senior-aged
applicants for public/community housing than those offers which come directly from community housing
associations (CHAs). The faster direct offers are mainly due to connections between the Housing for the Aged
Action Group (HAAG) and CHAs, along with the desirability of the stereotypical elderly tenant who is expected to
easily comply with rules and regularly pay rent on time. This raises questions about the fairness and
equality of the VHR, when it was originally planned to deliver a more equitable and speedy allocation
system for all applicants (Leeder 2018).
Long lag in improving rent payment options
While DHHS allows rent payment by direct payment or by a dedicated card at a Post Office, public tenants are
still waiting for a modern BPay facility to pay rent, after a promise more than 5 years ago. When will DHHS
fulfil its promise?
Better delivering and managing public housing
New Public Housing Authority
To address issues of poor management and construction rates, it is recommended that a separate public
housing authority be set up. This new Public Housing Authority will be mandated to place people in public
housing from the top of the priority access waiting list, not cherry pick from the middle, as has commonly
occurred by housing associations. A major aim of the Authority will be to actively reduce the public housing
waiting list, including to arrange construction of new public housing stock, built or bought, to meet the
demand.
Importantly, it will have ability to employ professional real estate staff, including those that have effective
experience in managing properties. This is important as the DHHS is a public service department, and
therefore unable to employ such staff.
The Public Housing Authority will be associated with DHHS, within the State Government of Victoria and only
with a mandate for public housing, including to end the decades of stigmatisation of public housing. After more
than 20 years of neglect it is important to stay focused.
The Public Housing Authority will be sufficiently funded to support the right number of people and with the
right skills to support key activities, such as:
• To begin building of public housing now on public lands, and not sell these off
• Build rate according to annual goals
• New housing to be built to high environmental standards
• Land assessment: to assess available public lands first for building public housing, (if not useful for that
purpose then could be sold)
• Property management and acquisition, project management
• Rental management, including an ombudsman to handle complaints
26You can also read