Holmdel 2023 Reassessment Report
←
→
Page content transcription
If your browser does not render page correctly, please read the page content below
Holmdel 2023 Reassessment Report
                11/1/22

           Reassessment FAQ

              Appeals FAQ

        2022 Reassessment Report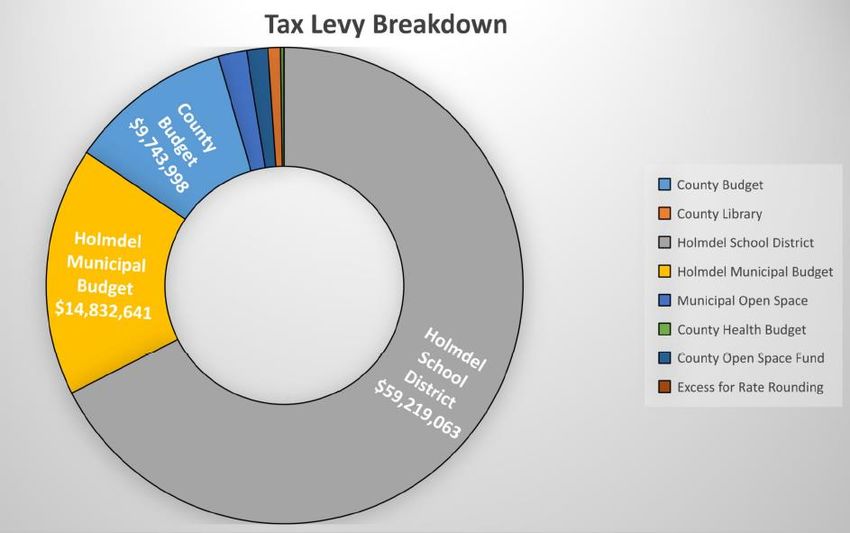
A Message from the Assessor
The past three years have been an exceptional period for real estate. Property values have increased steadily, and prices
had not yet abated as of the valuation date for the 2023 Reassessment (10/1/2022). The Township is required to
reassess all properties annually in order to maintain fair tax distribution. The goal of the reassessment is to react to the
market, rather than predict it. While the higher interest rate environment will likely have impacts on property values in
the future, the assessments are still catching up to the recent period of historic appreciation. The continued market
changes highlight the importance of the assessment function, which serves as the distribution mechanism of county,
school, and municipal tax levies.

The New Jersey constitution requires annual tax levies to be distributed based on market value. Contrary to popular
belief, property assessments do not generate taxes. They simply distribute them. Despite technological advances, many
municipalities in the state still take a “portfolio snap-shot” at a given point in time and distribute their property taxes the
way that picture looked for the subsequent 10 or 20 years (see exhibit A). By not implementing a proactive assessment
maintenance approach, tax distribution becomes less accurate each year that passes. A static assessment model
operates on the assumption that all property values within a municipal boundary appreciate or depreciate at the same
rate over time. This assumption is not accurate since property values do not necessarily change in a uniform manner
across all property types, price points, and sectors. Annual assessment maintenance is simply about tax distribution
fairness (as defined by the NJ constitution).

Through the 2023 reassessment, changes to the global assessment modeling were made to target market value.
Adjustments were also made to all individual properties, neighborhoods, and submarkets to refine assessment accuracy.
The goal of a reassessment is to annually target 100% market value so that statistical measurements represent better
assessment accuracy. For the upcoming 2023 tax year, the total overall aggregate value of Holmdel Township will be
15.23% greater than it was in 2022. This does not mean your taxes will go up 15.23%.

It means that the overall value of properties in the Township has increased. The aggregate value of Township property
and the tax rate have an inverse relationship. The higher property assessments will cause a lower tax rate. The 2023 tax
rate will be lower than the 2022 tax rate due to the increase in property values (see below rate estimate).

Provided below is recent history of past tax rates and an ESTIMATED tax rate for 2023 based on the higher assessed
values and various budgetary assumptions. It is important to reiterate that this is an ESTIMATED rate and the actual
2023 rate will not be known until mid-2023 when budgets are finalized. Contained in this report is more detail on the
reassessment process and results.

Erick Aguiar, CTA                                                      Tax Rate History

                                                                           2017- 2.029%
                                                                           2018- 2.021%
                                                                           2019- 2.029%
Assessor                                                                   2020- 2.039%
Holmdel Township                                                           2021- 2.006%
                                                                           2022- 1.813%
                                                                          *2023- 1.621%
                                                            *Estimated assuming +2% increase to tax levy and
                                                             2023 preliminary net taxable value of Township
                                                                    (less 1% to account for appeals)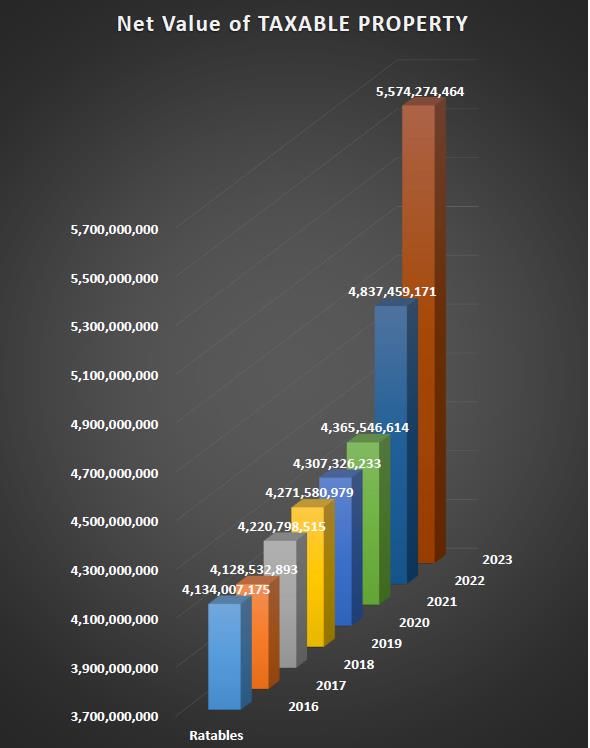
Prior Year (2022) Assessment Accuracy Reflection
Each October, the NJ Division of Taxation conducts statistical studies which measure the accuracy of current year
assessments. These studies could be considered the “assessor’s gradebook” for that year’s assessments and resulting tax
distribution. Nevertheless, recognition must be made that the assessments are produced the prior year based on past
sales, and the study is done the subsequent year based on future sales. Appreciating markets would likely result in an
assessment:sale price ratio under 100%, while depreciating markets would likely result in a ratio over 100%.

As anticipated, the dynamic and volatile market has affected assessment accuracy/market predictability statewide and
beyond. It should be well understood that when markets are more volatile (up or down), assessment coefficients will
statistically be higher. The incredible price appreciation experienced since COVID comes with volatility and an inherent
level of difficulty for the market participants (buyers and sellers) to discover a tight range of “Fair Market Value (FMV)”.
In such an environment, FMV understandably has a wider range, and it is expected for assessment coefficients to rise to
some degree. Further, when markets move so rapidly (like the 1-2% per month appreciation we have seen in recent
years), the dataset of sales within the sampling period will contain sales from various points in time when the market
was different. Since the sampling period extends the entire timeframe, without accounting for market changes, the
State’s Coefficient of Deviation (COD) measurements are expected to be higher.

While CODs will be higher in both; reassessment and non-reassessment districts, the fact remains that the reassessment
districts are better suited to deal with this higher level of volatility. Coefficients in stagnant assessment districts will
continue to deteriorate each year the assessment maintenance is ignored. On the other hand, reassessment districts can
adjust assessments accordingly with the changing market. Municipalities that regularly reassess stand the best chance of
providing their constituents the fairest level of tax distribution possible, even in the most difficult of times. It should be
no surprise that municipalities that take proactive steps in maintaining fair tax distribution consistently outperform
those that ignore such an initiative (see exhibit A).

For municipalities that do not take any proactive approach to maintaining fairness, the trajectory is ominous. The
continued spike in interest rates will likely cause further volatility. Projected price depreciation, in this case, will not be
equal across the board. All markets and price points will be affected differently. The opposite occurred on the way up,
with a noticeable market compression (likely attributable to historically low interest rates as the monthly payment is a
bigger market diving force on lower priced homes than it is on higher priced homes). Tax Distribution fairness in non-
reassessment municipalities will be completely at the mercy of the volatile market changes. Proactive municipalities will
continue to adapt annually, incorporating the various market changes into the subsequent year tax distribution.

                                                     Director’s Ratio
Holmdel Township’s 2022 Director’s Ratio was 95.65%. While the “Director’s Ratio” is a complex calculation, this
measurement is intended to express the typical relationship between assessments and sale prices in a given
municipality. The sampling period used for the Director’s Ratio contains sales that took place between January and June.
It is then blended with the Director’s Ratio from the prior year to stabilize shared tax levy impacts. With assessments
being set during the pre-tax year (based on sales that took place during the prior two-year period), it is expected that
ratios will be lower than 100% when markets are appreciating. The opposite would hold true for declining markets.
Typically, real estate markets do not appreciate significant amounts year over year. However, the recent market changes
have been exceptional, so the calculation is worth noting in this report to provide context to the declining ratio.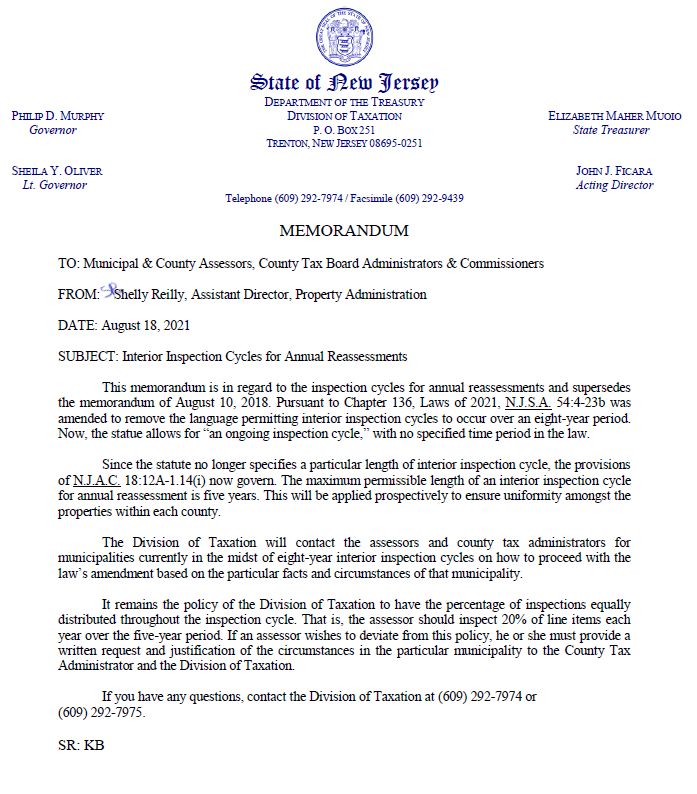
General Coefficient of Deviation (COD)
The General Coefficient of Deviation is widely held as the best indicator in determining proper tax distribution. It is a
way to measure how tightly clustered individual assessment ratios are in relation to the average ratio. A lower COD
means more accurate and fair tax distribution. The COD normalizes ratios to show accuracy within a municipality
regardless of what the Director’s Ratio is in any given year.

The more homogeneous the properties in a municipality are, the lower the COD should be. For example, a municipality
that is comprised of mostly townhouses would be expected to yield better assessment accuracy than a municipality that
is comprised of a complex range of property types and values (like Holmdel Township). Through annual reassessments,
Monmouth and Somerset Counties are showing much lower CODs compared to historical or statewide data.

Despite the complexity of the Township, Holmdel’s COD is more accurate than the norms in the rest of the state,
meaning that the assessments and resulting tax distribution are fairer. Holmdel is also trending to be more accurate
than historical coefficients. Prior to the COVID market volatility, the 2020 COD was 6.36, which was the second lowest
COD on record for Holmdel (in at least the past 30 years). While a historical comparison is an important measurement,
the COD must continue to be analyzed over time as coefficients will inevitably be higher during years that the underlying
market is more volatile (like the 2021 & 2022 market). While the 2022 COD was still lower than the historical average in
Holmdel, market volatility has been a challenge. It will likely take a few years for volatility to subside and be able to
maintain a COD in the 6-7 range again.

Below is a summary of Holmdel’s general COD for the past 9 years (see figure 1). Holmdel’s average COD prior to
implementation of annual reassessments (years 1991-2013) was 10.64.

                                                               General
                                                             Coefficient of
                                                Year          Deviation
                                                 2014                    9.43
                                                 2015                    9.24
                                                 2016                    7.45
                                                 2017                    7.62
                                                 2018                    7.39
                                                 2019                    7.40
                                                 2020                    6.36
                                                 2021                  10.12
                                                 2022                    8.53
                                                          (figure 1)
Inspections (data collection)
The Township completed the second five-year inspection cycle in this year. This cycle was done on a 33% per year
schedule split between 2020, 2021, and 2022 (see figure 2).

Unfortunately, the Division of Taxation recently established a regulation that requires all annual reassessment districts
to inspect properties every five years (see exhibit B). Holmdel had planned on operating under a previously permissible
eight-year inspection cycle which would have been less expensive and would have inconvenienced residents with
inspections less frequently. The law allowing the eight-year cycle was put in place only a few years ago as a cost saving
measure for municipalities. Recently, a new law was passed to allow virtual inspections (and established some other
changes). In the new law, the language specifically allowing the eight-year cycle was removed and no longer specifies a
timeframe. Division of Taxation’s decision to regulate as a five-year cycle removes the Township’s ability to spread the
cost over the eight-years. On the bright side, the Township has been granted permission to deviate from the “20% per
year” inspection routine and instead shall comply with the schedule set forth in figure 2.

                                                     Inspection Plan

                                                        (figure 2)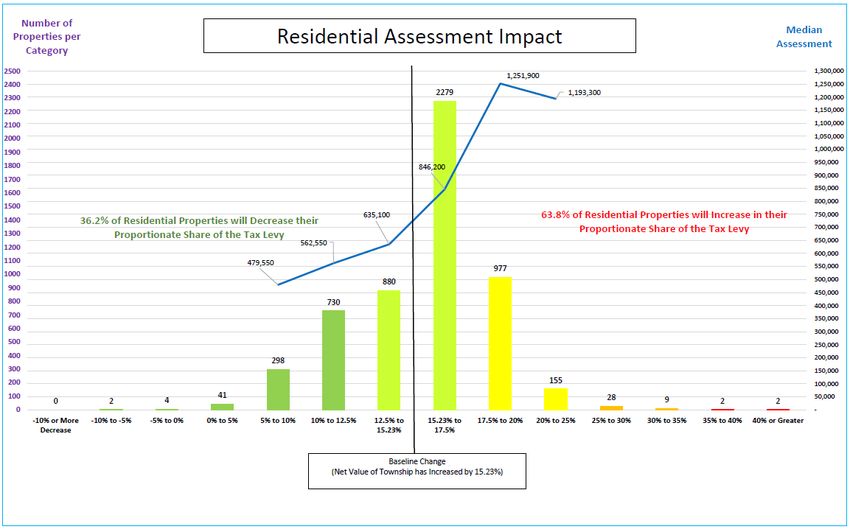
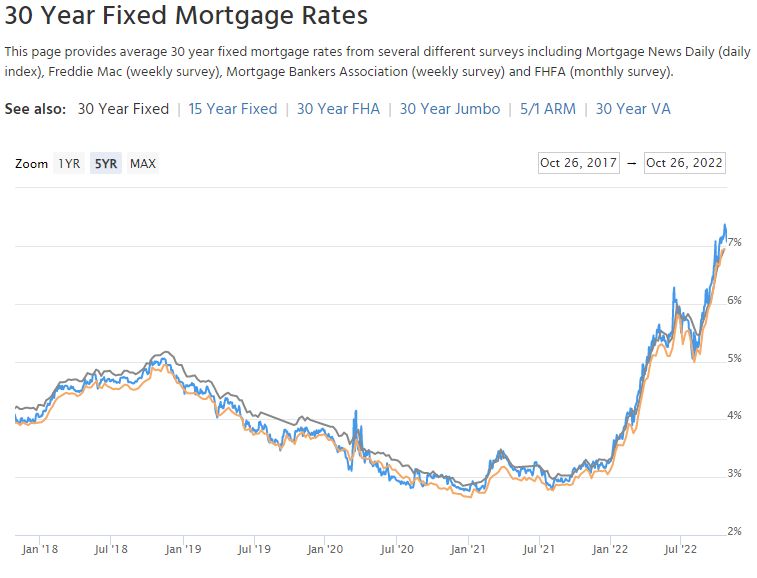
General Comments on the Current Real Estate Market
Another extraordinary year for the real estate market in the books. The 2021 market experienced continued price
appreciation driven by lower interest rates. This story continued during the winter months of 2022, with local markets
seeing a steady 1-2% per month appreciation rate. As inflation shot up, the Federal Reserve began tightening money
supply and has not yet stopped. Interest rates continue to ominously spike. The most extraordinary aspect of the 2022
market has been the muted reaction to the higher rates. Prices continued to increase until at least the summer of 2022,
despite rates more than doubling YTD. In the most recent month or so, we are finally seeing signs suggesting that price
appreciation has slowed to a crawl and may begin to stabilize or even decline.

The 2023 Reassessment takes the market changes into account. Sales from 2021 and 2022 were used in the
reassessment modeling, giving greater weight to the more recent sales. The 2023 aggregate value of Holmdel’s
assessments will increase by 15.23%. This 15.23% can be seen as the baseline for apportionment change. Any property
increasing greater than 15.23% will pay a greater proportionate share of the tax levy. Conversely, any property
increasing less than 15.23% (or decreasing) will pay a lesser proportionate share of the tax levy.

It is important to keep in mind that the shared County budget is apportioned to the 53 towns based on the respective
net values. Should appreciation in Holmdel outpace its 52 counterparts in the County, Holmdel will be assigned to pay a
higher proportionate share of the County Tax Levy (see figure 3). The way the market behaves is mainly out of our
control, but it is important to keep a pulse on how other towns are assessing their properties. All towns should be on an
equal playing field so that shared budgets get apportioned fairly.
Holmdel Tax Levy History

        (figure 3)
Total Change of Net Valuation Taxable
The net valuation of the Township is increasing by 15.23% in 2023 (see figure 4). About 737M has been added to the
Holmdel ratable base (partially related to new construction and partially related to market appreciation).

                                                      (figure 4)

                               Property Class Breakdown (Year over Year)

                                                      (figure 5)
(figure 6) (figure 7)
2023 Tax Rate Prediction

                                                        (figure 8)

                                      Minimal Apportionment Volatility
Volatility, in terms of 2023 tax apportionment change, is minimal (see figures 9 & 10).
    •   58% of residential properties changed between 12.5% and 17.5% (baseline is 15.23%)
    •   90% of residential properties changed between 10% and 20% (baseline is 15.23%)
Reassessment reports in prior years highlighted the notable market compression that had been occurring for the past
decade. Lower property values were appreciating at much greater rates than higher valued properties. This dynamic
was likely caused by the low interest rate environment, as lower priced home prices are more sensitive to interest rate
changes. With higher rates in 2022, the compression trend has finally reversed and higher valued properties
outperforming lower valued properties.

                                    Assessment change of all residential properties
                            (excluding new construction and properties that had renovations)

                                                        (figure 9)
Residential Change Report
(figure 10)2023 Tax List Accuracy
The primary driver of a reassessment is recent “arms-length market transactions”. Statutorily, properties are assessed
for what they would have sold for on October 1st of the pretax year. The 2023 valuation date is October 1st, 2022.
Our Supreme Court has held “value for purposes of taxation has some measure of permanence which renders it secure
against general temporary inflation or deflation.” (Hackensack Water Co. v. Division of Tax Appeals, 2 N.J. 157, 163
(1949)); and “True value must be fairly constant and must be gauged by conditions, not temporary and extraordinary,
but by those which over a period of time will be regarded as measurably stable.” (Berkeley Arms Apartment Corp. v. City
of Hackensack, 6 N.J. Tax 260, 286 (Tax 1983)).
These quotes are more important now than ever. While the local market has appreciated at significant rates, assessors
must view sales data used in the study in its totality while mass modeling assessments. While more recent sales are
certainly given more credibility in the analysis, older sales will still be a stabilizing factor with annual reassessments.
Inevitably, older sales will pull the modeling in the direction that the market was in the past.
A reassessment generally measures sale prices from the past two years (giving more credibility to the more recent
transactions.) The Monmouth County Tax Board has a standardized review process to measure new assessments against
sale prices from the current and prior year (see figures 11 & 12).
Tax Board Assessment Data Analysis Module (ADAM360) Standardized Review:
All 2021/2022 residential usable sales
(removing top & bottom 2.5% outliers and properties that had renovations after the sale)
*Data addendum with sales attached
(figure 11)Tax Board Assessment Data Analysis Module (ADAM360) Standardized Review:
All residential usable sales during the past 1 year period
(removing top & bottom 2.5% outliers and properties that had renovations after the sale)
*Data addendum with sales attached
(figure 12)EXHIBIT A (1 of 2)
Statewide Comparison of Reassessment vs. Non-Reassessment Districts
*Reassessment Municipalities are the 84 districts that reassessed every year for the past five years
**Non-Reassessment Municipalities are the 394 districts that have done no reassessments or revaluations in at least five yearsEXHIBIT A (2 of 2)
Statewide Comparison of Reassessment vs. Non-Reassessment Districts
*Reassessment Municipalities are the 84 districts that reassessed every year for the past five years
**Non-Reassessment Municipalities are the 394 districts that have done no reassessments or revaluations in at least five yearsEXHIBIT B Division of Taxation removed ability to spread inspections over 8-Year period
You can also read