Historical Databases, Big and Small - By Peter Doorn
←
→
Page content transcription
If your browser does not render page correctly, please read the page content below
Historical Databases, Big and Small
By Peter Doorn
To cite this article: Doorn, P. (2021). Historical Databases, Big and Small. Historical Life Course Studies, 10, 24-29. https://
doi.org/10.51964/hlcs9562

                                 HISTORICAL LIFE COURSE STUDIES

                                                  Not Like Everybody Else.
                                           Essays in Honor of Kees Mandemakers

                                               VOLUME 10, SPECIAL ISSUE 3
                                                        2021

                                                      GUEST EDITORS
                                                         Hilde Bras
                                                           Jan Kok
                                                     Richard L. Zijdeman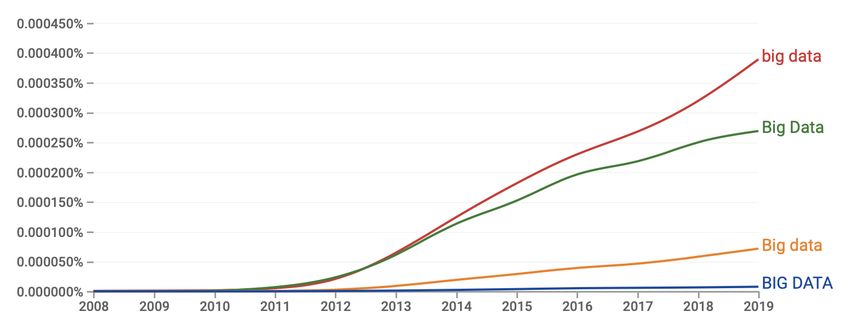
MISSION STATEMENT
HISTORICAL LIFE COURSE STUDIES

     Historical Life Course Studies is the electronic journal of the European Historical Population Samples Network (EHPS-
     Net). The journal is the primary publishing outlet for research involved in the conversion of existing European and non-
     European large historical demographic databases into a common format, the Intermediate Data Structure, and for studies
     based on these databases. The journal publishes both methodological and substantive research articles.

     Methodological Articles
     This section includes methodological articles that describe all forms of data handling involving large historical databases,
     including extensive descriptions of new or existing databases, syntax, algorithms and extraction programs. Authors are
     encouraged to share their syntaxes, applications and other forms of software presented in their article, if pertinent, on
     the openjournals website.

     Research articles
     This section includes substantive articles reporting the results of comparative longitudinal studies that are demographic
     and historical in nature, and that are based on micro-data from large historical databases.

     Historical Life Course Studies is a no-fee double-blind, peer-reviewed open-access journal supported by the European
     Science Foundation (ESF, http://www.esf.org), the Scientific Research Network of Historical Demography (FWO
     Flanders, http://www.historicaldemography.be) and the International Institute of Social History Amsterdam (IISH,
     http://socialhistory.org/). Manuscripts are reviewed by the editors, members of the editorial and scientific boards, and
     by external reviewers. All journal content is freely available on the internet at https://openjournals.nl/index.php/hlcs.

     Co-Editors-In-Chief:
     Paul Puschmann (Radboud University) & Luciana Quaranta (Lund University)
     hislives@kuleuven.be

     The European Science Foundation (ESF) provides a platform for its Member Organisations to
     advance science and explore new directions for research at the European level. Established in 1974 as
     an independent non-governmental organisation, the ESF currently serves 78 Member Organisations
     across 30 countries. EHPS-Net is an ESF Research Networking Programme.

     The European Historical Population Samples Network (EHPS-net) brings together scholars to
     create a common format for databases containing non-aggregated information on persons, families
     and households. The aim is to form an integrated and joint interface between many European
     and non-European databases to stimulate comparative research on the micro-level.
     Visit: http://www.ehps-net.eu.
HISTORICAL LIFE COURSE STUDIES
VOLUME 10, SPECIAL ISSUE 3 (2021), 24-29, published 31-03-2021

Historical Databases, Big and Small

Peter Doorn
DANS (Data Archiving and Networked Services), The Hague

ABSTRACT
Big Data is a relative term, and Small Data can be equally important. Not only the volume of data defines
if data is 'Big', but three more Vs characterise the term: velocity (speed of data generation and processing),
veracity (referring to data quality) and variety. Perhaps the most defining is methodological: data becomes
really big when new methods are needed to process and analyse it. In contrast, this paper demonstrates how
even a tiny dataset can contribute to our understanding of the past, in this case of the historical geography
of two provinces in Ottoman Greece in the 17th century. Graph analysis is used on a dataset of just 16 data
pairs, illustrating the point that a close-up view of data complements the look from farther away at bigger
data volumes.

Keywords: Big Data, Greece, Ottoman provinces, Graph analysis

e-ISSN:       		 2352-6343
DOI article:			  https://doi.org/10.51964/hlcs9562
The article can be downloaded from here.

© 2021, Doorn
This open-access work is licensed under a Creative Commons Attribution 4.0 International License, which permits use,
reproduction & distribution in any medium for non-commercial purposes, provided the original author(s) and source are
given credit. See http://creativecommons.org/licenses/.
Peter Doorn

               “Big data begets big attention these days, but little data are equally essential to scholarly inquiry [...]
                Big data is not necessarily better data. The farther the observer is from the point of origin, the more
                            difficult it can be to determine what those observations mean. […] Scholars often prefer
                                     smaller amounts of data that they can inspect closely”. (Borgman, 2015, p. xvii)

1        BIG DATA
         The term 'Big Data' is closely related to the information explosion, and the term seems to have been used for
         the first time in a paper for the IEEE (Institute of Electrical and Electronics Engineers) conference in October
         1997 (Press, 2013). Recognising that the amount of world-wide information was growing exponentially,
         forecasts were that, in spite of Moore's law, it would soon become impossible to store all the data around.
         Meanwhile, we, poor humans, were increasingly suffering from information overload.

         Kees Mandemakers was appointed professor in Large Historical Databases in 2008. Of course, what was
         considered large in historical research was still quite modest in comparison to what was going on in disciplines
         such as particle physics and astronomy at the time. 2008 was the year when the use of the term Big Data
         took off, as an NGram graph (based on the Google Books corpus, itself a very large dataset) shows (see
         Figure 1).

         Around the same time, the Big Grid project had started, and my institute DANS (Data Archiving and
         Networked Services) participated in two Big Data projects: Andrea Scharnhorst and colleagues classified
         the contents of Wikipedia and compared that with the UDC (Universal Decimal Classification) system
         (Scharnhorst, Smiraglia, Guéret, & Akdag Salah, 2016); and we experimented with archiving 1 million data
         files from the data archive on the grid.

         It was soon realised that Big Data was not something you could measure in bits alone: except for Volume
         (quantity), there are three more Vs that are crucial for data to be Big: Velocity (speed of data generation and
         processing), Veracity (referring to data quality, or how meaningful data is), and Variety. According to some
         definitions, Veracity and Variety are what makes Big Data really big. And exactly these characteristics are
         typical for data processing in the humanities in general and in historical research in particular.

         Big Data in the natural sciences is so voluminous because the measuring equipment captures masses of
         uninteresting noise, from which the meaningful data must be extracted with lots of computational power.
         Although in the humanities datasets are usually much smaller because the capturing of the data is based on
         human effort, the Veracity and Variety of Big Data are characteristic. Kees' life-time work on the Historical
         Sample of the Netherlands is an excellent example of that, which shows how much effort and perseverance,
         but also planning and organisation, are needed to accomplish a large corpus of data on the history of life
         courses from a multitude of sources.

         Figure 1		        Ngram graph of the term 'Big Data' (case-insensitive)

         Source: Ngram based on the Google Books English Corpus, 2019; https://books.google.com/ngrams/
         graph?content=big+data&year_start=2008&year_end=2019&corpus=26&smoothing=0&case_insensitive=true

25                                       HISTORICAL LIFE COURSE STUDIES, VOLUME 10, SPECIAL ISSUE 3 (2021), 24−29
Historical Databases, Big and Small
2 LIFE COURSES IN CONTEXT
In 2001 Kees and I jointly submitted a proposal to the NWO (Dutch Research Council) Big Investment
programme to continue and expand our work in bringing together a unique and large data collection on
the history of the Dutch population, based on population registers and similar sources, and on the historical
censuses of the Netherlands. The project 'Life Courses in Context' (LCiC) was the first proposal from the
humanities ever to be granted such a big investment subsidy.
An example from my side of the LCiC project shows how relative the term Big Data is. The first population
census to be processed with the help of computers was the 1960 census. The original punched cards of that
census (about 11 million cards, consisting of one card per inhabitant) were acquired by the first predecessor
of DANS, the Steinmetz Archive, when Statistics Netherlands (CBS) needed the space the boxes were taking
to prepare for the 1971 census. But one run on the mainframe computer of the time to do a simple statistical
analysis on the 11 million records would eat up the complete budget of the faculty of social sciences for a
whole year, so creating a digital version of the cards needed to be postponed until at least some funds were
available to bring the cards from the storage room to the punch readers at the SARA computer centre and
process them. And as it needed to be done at bargain prices, students transported the card boxes on the
baggage racks of their bicycles, some boxes got damaged and lost, some cards got stuck in the punch reader,
were torn and could not be read, and some boxes were read more than once. There was simply no money
to process the data appropriately. The LCiC project provided DANS with the opportunity to digitally restore
the 1960 dataset as well as possible, mending the gaps with digitised data at an aggregate level (Doorn &
van den Berk, 2007).
How big was the dataset that caused many people so much trouble? Eleven million punch cards with 80
columns would mean a potential of 880 million bytes, but because of empty fields, the total size was about
half a Gigabyte, which in the 1990s just fitted on one CD-ROM. But today, of course, you can easily store
and process the whole 1960 census on your mobile phone. That is how relative Big Data is. And this is also
why I like Choudhury's (2016) definition of Big Data: data that is too big to be processed with your normal
resources and methods.
3 ANALYSIS OF TINY DATA SETS
As a contrast with the analysis of big data in historical research, and guided by the Dutch saying 'Wie het
kleine niet eert, is het grote niet weerd', somewhat of an equivalent to 'He who will not keep a penny shall
never have many', I would like to focus on the analysis of very small data. Twice in my academic career I
have made a full analysis of a tiny dataset: in 1990 I did research on a dataset consisting of just 7 variables
over 24 years, so a total of 168 data points on which I reported in an article in a, despite the small sized data,
reputable journal (Doorn & Lindblad, 1990).
In the summer of 2020 I have been playing around (you can hardly call this serious work, can you?) on
even less data points: 32 data pairs, concerning 16 administrative regions in the Turkish Ottoman provinces
(sanjaks) of Ainabachti (also known under its Venetian name Lepanto, currently Navpaktos) and Karli-Ili ('the
land of Carlo', that is Carlo Tocco, present-day Aetolia and Acarnania) in Central Greece. This analysis is part
of my research on the settlement history of Aetolia, on which I have been working intermittently ever since
I was a student in 1981.
These two regions are mentioned in the work of the great Ottoman geographer, omni-scientist and leading
literary author of the 17th century Mustafa Ben Abdalla Hadschi Chalfa (in the German orthography), also
known as Haji Khalifah or 'Kâtip Çelebi' (Learned Scribe). Among his works is the famous Cihânnümâ (in
other orthographies, Djihaˉn-numaˉ, Jihannuma, ( جهان نماView of the World)), a geographic dictionary begun
in 1648, and only published after Haji Khalifah's death.
The Austrian orientalist and historian Baron Joseph Freiherr von Hammer-Purgstall discovered part of a
manuscript written by Haji Khalifah and belonging to his description of the world, in the collection of Count
Wenzeslaus Rzewusky. The manuscript contained a description of the Beylerbeyliks (the largest territorial
units of the Ottoman Empire, also known as Eyalets or Pashaliks) of Rumeli and Bosnia. Rumeli is literally 'the
land of the Romans' in Turkish, but it is also used to designate the Greek part of the Balkans (Çelebi, 1812).
https://openjournals.nl/index.php/hlcs 26Peter Doorn
Despite its 'inadequacies' and 'vagueness' (according to the translator), this source is a welcome addition to
our knowledge about the historical geography of Greece, given the almost total lack of information about
the territorial structure in the 17th century, as the source gives the names of districts in Ottoman Turkish
(transcribed in German by von Hammer) and their relative locations.
It is indeed quite problematic to identify all the districts, although most of them are recognisable by their
names in later or earlier sources. But there were also quite a few enigmatic names, and I hoped to use the
information on the relative locations of the district as an aid for the identification. The information given
about every district varies, but usually the description includes a formulation of the type: 'District A, X days of
travel removed from Constantinople, lies between District B and District C' (sometimes more neighbouring
districts are mentioned).
From this text I deduced a list of 32 pairs of neighbouring districts, which are often named after their capital:
12 in the sanjak of Ainabachti (Navpaktos), 20 in Karli Ili (Aetolia-Acarnania; note that in Modern Greece,
the province of Navpaktia is part of Aitoloakarnania).
Graph theory provides a methodological framework that is exactly suited for my question, which was to
arrange the 16 districts on the basis of the neighbouring information. Graphs are generally used to represent
relationships between objects. When two districts are mentioned in the source as neighbours, there is a
connection between them. If the source was consistent throughout, the connections would be double-sided:
if A is a neighbour of B, B should be a neighbour of A. But in reality, the source is not so systematic: therefore,
we use 'directed graphs', indicating unilateral connections.
Figure 2 Graph analysis of Ottoman districts in the 17th century
Source: Çelebi (1812).
Note: Graphs generated with https://csacademy.com/app/graph_editor/.
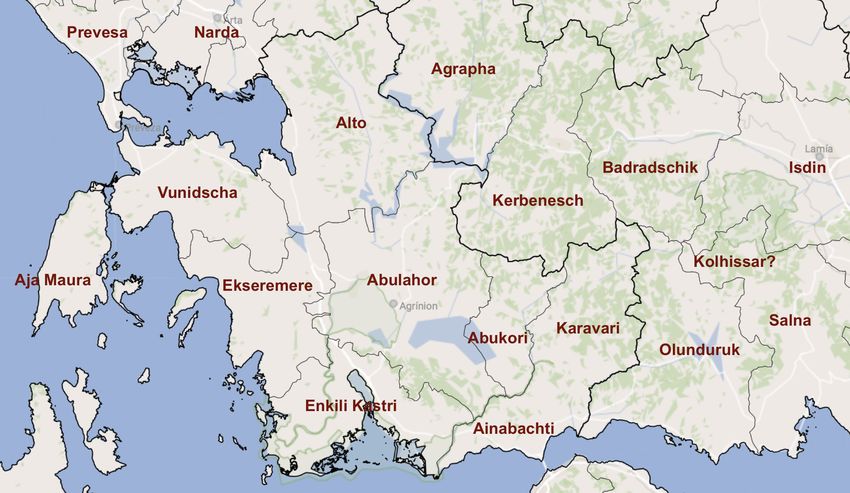
27 HISTORICAL LIFE COURSE STUDIES, VOLUME 10, SPECIAL ISSUE 3 (2021), 24−29Historical Databases, Big and Small The arrows are directed graphs indicating districts (the black dots) mentioned in the text as in between (or next to) other districts. For example: Olunduruk (now: Lidoriki, Dorida) is in between Ainabachti (Venetian Lepanto, modern Navpaktos), Salna (Salona, Amfissa) and Kolhissar; and Kolhissar is in between Salna, Olunduruk and Badradschik (Neopatras, Ipati). The double arrows give an indication of the consistency of 'in-between mentions'. Karavari is only mentioned as being next to Ainabachti, which may be an indicator of its isolation. Mountainous and forested Kravari has long been known as one of the poorest districts of Greece, the area where the beggars come from. Enkili (Kas(t)ri; modern name: Angelokastro) has the largest number of connections (7) and as the capital of the Sanjak Karleli (In the German text: Sandschak Karli Eli) is the most central place. Ainabachti (Navpaktos), the capital of the sanjak of the same name, has only two connections (the sanjak boundaries are indicated by the red dotted line). It was a relatively small sanjak, and had its greatest importance because of it harbour and strategic position on the Gulf of Corinth (in the past called the Gulf of Lepanto, at the entrance of which the famous sea battle of Lepanto took place in 1571). In the image, the positions of the places/districts are more or less geographically correct. Some of the neighbours are geographically impossible in reality, e.g. the proximity of Kerpenesch (Karpenisi, the capital of the later province of Evrytania) and Aia Maura (the island of Levkada, Levkas); and also the Nachbarshaft between Abukor and Ekseremere is impossible. Hence, the graph analysis can be used to substantiate errors and inconsistencies in the source. The most mysterious place/district in the list is Kolhissar, probably a transliteration of the Turkish Gölhisar, which means 'Lake Castle'. Its identification remains enigmatic because it is not mentioned in any independent other source, either earlier or later. Some scholars think Kolhissar was a place on Lake Trikhonis (in sanjak Karli Eli), but obviously this does not agree with the Ottoman manuscript, which says it is in between Lidoriki (Olunduruk), Sal(o)na and Ipati (Badradschik) in the sanjak of Ainabakhti (Navpaktos), where no lake is to be found in the wide surroundings. Instead, the graph analysis hints at an area with some of the highest mountains of Greece (mt. Gkiona and mt. Oeta, resp. 2,500 and 2,150 metres high). This small introduction to the data is enough to underline the general point I would like to make. Figure 3 depicts a map of the regional administrative structure in 17th century central-western Greece based on my tiny dataset. The names of the Ottoman districts are superimposed on a modern map of municipal and provincial boundaries. From older and later sources we know that the boundaries of the regions did not remain the same as in the 17th century. However, the similarity in terms of overall spatial organisation is striking, notwithstanding the big events that took place since then: the collapse of the Ottoman empire, the Greek War of Independence, the Balkan Wars, the First and Second World War. Almost four hundred years of resilience shown by a simple list of 32 value pairs. Figure 3 Map of modern municipal (demes) boundaries of central-western Greece and names of 17th century-Ottoman districts Source: Map of modern municipal boundaries derived from: https://www.citypopulation.de/en/greece/ mun/admin/ https://openjournals.nl/index.php/hlcs 28
Peter Doorn

4        CONCLUSION
         In spite of the enormous accomplishments made by historians such as Kees Mandemakers in bringing
         together large quantities of data, which opened up new avenues for historical analysis, we must bear in mind
         the relativity of what Big Data means, and we must also honour the small. I hope to have demonstrated that
         even the analysis of tiny datasets can offer new insights.

         REFERENCES
         Borgman, C. L. (2015). Big data, little data, no data. Scholarship in the networked world. Cambridge, MA:
              MIT Press.
         Çelebi, K. (1812). Rumeli und Bosna, geographisch beschrieben (von Mustafa Ben Abdalla Hadschi Chalfa;
              aus dem Türkischen übersetzt von Joseph von Hammer-Purgstall). Vienna. Retrieved from https://
              books.google.nl/books?id=DzsLAAAAIAAJ
         Choudhury, G. S. (2016). Data management at scale. Information Services & Use, 36(1–2), 27–33. doi:
              10.3233/ISU-160795
         Doorn, P. K., & Lindblad, J. Th. (1990). Computertoepassingen in de economische geschiedenis, in het
              bijzonder bij tijdreeksanalyse. Tijdschrift voor Geschiedenis, 103, 326–341. Retrieved from http://
              resources.huygens.knaw.nl/retroboeken/tvg/#source=103&page=335&view=imagePane.
         Doorn, P. K., & van den Berk, M. (2007). Een digitale detective story: De reconstructie van de Nederlandse
              Volkstelling van 1960. In Twee eeuwen Nederland geteld (Vol. 2, pp. 471–487). Data Archiving and
              Networked Services (DANS). doi: 10.17026/dans-z7q-kxgy
         Press, G. (2013, 9 May). A very short history of big data. Forbes. Retrieved from https://www.forbes.com/
              sites/gilpress/2013/05/09/a-very-short-history-of-big-data/#41be35d65a18
         Scharnhorst, A., Smiraglia, R. P., Guéret C., & Akdag Salah, A.A. (2016). Knowledge maps of the UDC: Uses
              and use cases. Knowledge Organization, 43(8), 641–654. doi: 10.5771/0943-7444-2016-8-641

29                                     HISTORICAL LIFE COURSE STUDIES, VOLUME 10, SPECIAL ISSUE 3 (2021), 24−29
You can also read