Highly multiplexed tissue imaging using repeated oligonucleotide exchange reaction
←
→
Page content transcription
If your browser does not render page correctly, please read the page content below
Eur. J. Immunol. 2021. 00: 1–16                            DOI: 10.1002/eji.202048891                                      J. Kennedy-Darling et al.         1

                                                                                                                                                           Basic
                                                                                                                  New technology

Research Article
Highly multiplexed tissue imaging using repeated
oligonucleotide exchange reaction
Julia Kennedy-Darling ∗1,5 , Salil S. Bhate ∗1,2,3 , John W. Hickey ∗1,2 ,
Sarah Black1,2 , Graham L. Barlow1,2 , Gustavo Vazquez1,2 ,
Vishal G. Venkataraaman1,2 , Nikolay Samusik1,6 , Yury Goltsev1,2 ,
Christian M. Schürch ∗∗1,2,4 and Garry P. Nolan ∗∗1,2

1
  Department of Microbiology & Immunology, Stanford University School of Medicine,
  Stanford, CA, USA
2
  Department of Pathology, Stanford University School of Medicine, Stanford, CA, USA
3
  Department of Bioengineering, Stanford University, Stanford, CA, USA
4
  Department of Pathology and Neuropathology, University Hospital and Comprehensive
  Cancer Center Tübingen, Tübingen, Germany
5
  Akoya Biosciences, 1505 O’Brien Drive, Menlo Park, CA, USA
6
  Becton Dickinson, San Jose, CA, USA

Multiparameter tissue imaging enables analysis of cell-cell interactions in situ, the cellular
basis for tissue structure, and novel cell types that are spatially restricted, giving clues to
biological mechanisms behind tissue homeostasis and disease. Here, we streamlined and
simplified the multiplexed imaging method CO-Detection by indEXing (CODEX) by validat-
ing 58 unique oligonucleotide barcodes that can be conjugated to antibodies. We showed
that barcoded antibodies retained their specificity for staining cognate targets in human
tissue. Antibodies were visualized one at a time by adding a fluorescently labeled oligonu-
cleotide complementary to oligonucleotide barcode, imaging, stripping, and repeating this
cycle. With this we developed a panel of 46 antibodies that was used to stain five human
lymphoid tissues: three tonsils, a spleen, and a LN. To analyze the data produced, an
image processing and analysis pipeline was developed that enabled single-cell analysis
on the data, including unsupervised clustering, that revealed 31 cell types across all tis-
sues. We compared cell-type compositions within and directly surrounding follicles from
the different lymphoid organs and evaluated cell-cell density correlations. This sequen-
tial oligonucleotide exchange technique enables a facile imaging of tissues that leverages
pre-existing imaging infrastructure to decrease the barriers to broad use of multiplexed
imaging.

Keywords: CODEX r DNA-conjugated antibodies                 r   Multiplexed tissue imaging      r   Single-cell
analysis r Spatial single-cell biology

       Additional supporting information may be found online in the Supporting Information section
        at the end of the article.

                                                                          ∗
Correspondence: Prof. Christian M. Schürch and Prof. Garry P. Nolan        Julia Kennedy-Darling, Salil S. Bhate, and John W. Hickey contributed equally
e-mail: christian.schuerch@med.uni-tuebingen.de;                          to the work.
                                                                          ∗∗
gnolan@stanford.edu                                                          Christian M. Schürch and Garry P. Nolan are the cosenior authors.

© 2021 The Authors. European Journal of Immunology published by Wiley-VCH GmbH                                                  www.eji-journal.eu

This is an open access article under the terms of the Creative Commons Attribution License, which
permits use, distribution and reproduction in any medium, provided the original work is properly cited.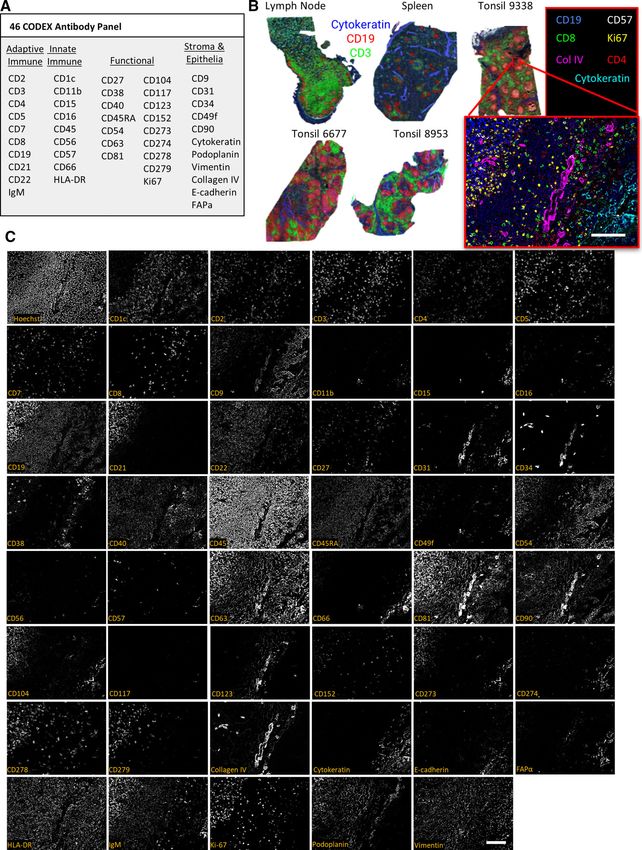
2   J. Kennedy-Darling et al.                                                                                    Eur. J. Immunol. 2021. 00: 1–16

    Introduction                                                                The first version of the CODEX imaging platform was based on
                                                                            iterative rendering of DNA-conjugated antibodies by DNA poly-
    Identifying cells and cell phenotype through antibody binding           merase primer extension and fluorescent dNTP analogs [27].
    to known proteins is a fundamental tool in basic research and           CODEX provides a multiplexed technique that can be easily
    clinical practice. Spatial information provided by cellular local-      adopted with minor modifications to regular fluorescent micro-
    ization is critical for understanding tissue homeostasis and char-      scopes. However, use of enzymes in the oligonucleotide detection
    acterizing disease [1–11]. Currently, immunohistochemistry and          step increased the complexity, background signal, and cost of the
    immunofluorescence imaging are the workhorses for defining cel-         method. To simplify and speed up the imaging process, we here
    lular and subcellular protein organization for pathologists and         updated the technique to use chaotropic solvents that facilitate
    biologists. These modalities allow a limited number of proteins         iterative annealing and stripping of complementary, fluorescently
    to be investigated simultaneously; however, simultaneous charac-        labeled DNA probes to DNA-conjugated antibodies.
    terization of cell phenotype with multiple proteins for many cell           Here, we tested the components of this newly developed
    types has been shown necessary to predict therapeutic outcomes          CODEX multiparameter imaging method. We validated the speci-
    [8–10]. Additionally, the characterization and identification of tis-   ficity and labeling efficiency of 59 unique oligonucleotide bar-
    sue substructures (e.g. tertiary lymphoid structures) by simultane-     codes and several dozen antibodies using iterative cycles of
    ous identification of multiple cell types or discrete cell subsets is   annealing, imaging, and stripping using automated fluidics. For
    important, since such have been associated with disease suscepti-       this report, the primary antibody panel included major immune
    bility and immunotherapy response [1–7].                                cell markers, including CD3, CD4, CD8, CD20, and CD66, func-
        Recently, several imaging technologies have been developed          tional markers such as CD279 (also known as PD-1), markers
    that have multiplexing capabilities of flow or mass cytometry           of nonimmune cell populations, and markers of structural fea-
    (beyond 30 markers). These techniques enable detailed cata-             tures such as vasculature. These antibodies were used to stain
    loguing of location and coordination of cellular phenotypes, cell-      five cellularly dense human lymphoid tissues and imaging was
    cell interactions, and larger cellular ensembles. Methods based         performed using the repeated oligonucleotide exchange reaction
    on mass cytometry employ isotope-labeled antibodies and use             with the developed CODEX technique. We demonstrate a process-
    raster laser ablation (imaging mass cytometry [IMC]) [12] or            ing pipeline for aligning cyclic imaging, segmentation of cells in
    ion beams (multiplexed ion beam imaging [MIBI]) for imag-               the data, and unsupervised clustering that led to the classification
    ing [13,14]. Other techniques employ matrix-assisted laser des-         of 31 major cell types. Finally, in a demonstration that the tech-
    orption/ionization (MALDI) trapped ion-mobility spectrometry            nique can be used to characterize tissue architecture, we used the
    (TIMS) [15] or Raman scattering or vibrational signatures of            spatial coordinates of single cells to compare the cell-type com-
    chemical bonds to perform multiplexed imaging [16], yet these           position of follicles and correlated cell-cell densities across the
    techniques lack resolution, are limited in multiplexing abilities, or   human tonsil, spleen, and LN.
    require specialized instruments and expertise.                              In summary, the updated and simplified CODEX platform
        Most advanced optical multiplexing methods are limited by           allows for robust, reproducible identification, and quantification
    spectral overlap restricting simultaneous detection to ten mark-        of single cells within complex tissues. This platform enables
    ers or fewer [17]. To overcome these limitations, techniques like       advanced analysis of intercellular relationships and overarching
    multiepitope-ligand cartography (MELC) [18], multiplexed fluo-          tissue architecture. Deep, spatially resolved phenotyping of the
    rescence microscopy (MxIF) [19], tissue-based cyclic immunoflu-         cellular components in diseases, such as autoimmunity and can-
    orescence (t-CyCIF) [20], and iterative indirect immunofluores-         cer, will advance our understanding of how spatial features con-
    cence imaging (4i) [21] use cyclic immunofluorescence imaging           tribute to disease biology and help develop novel diagnostics and
    protocols involving fluorophore inactivation or antibody stripping      therapeutics.
    and restaining. Because each cyclic stripping or bleaching step
    requires a substantial time (hours), increasing the number of
    parameters linearly increases the amount of time necessary for          Results
    one tissue.
        Another approach uses DNA-barcoded antibodies that are visu-        CODEX multicycle imaging using DNA oligonucleotide
    alized by cyclic addition and removal of fluorescently labeled          barcodes and automated fluidics
    DNA probes. Techniques based on this principle include exchange-
    points accumulation in nanoscale topography (PAINT) [22], DNA           The approach for the newly adapted CODEX high-parameter
    exchange imaging (DEI) [23], immunostaining with signal ampli-          imaging uses iterative cycles of annealing and stripping flu-
    fication by exchange reaction (immuno-SABER) [24], quantum-             orescently labeled DNA reporter oligonucleotides complemen-
    dot SABER [25], barcoded-antibody based cyclic immunofluo-              tary to DNA barcodes conjugated to antibodies (Fig. 1A). First,
    rescence (cyCIF) [26], and CO-Detection by indEXing (CODEX)             antibodies are each labeled with a unique oligonucleotide tag,
    [27,28]. These DNA-based systems have the advantages of a sin-          designed to minimize nonspecific oligonucleotide-oligonucleotide
    gle staining procedure, fast run times, and comparably simple           and oligonucleotide-tissue binding. Second, the oligonucleotide-
    chemistries.                                                            conjugated antibodies are used to stain a tissue section. Third,

    © 2021 The Authors. European Journal of Immunology published by                                                        www.eji-journal.eu
    Wiley-VCH GmbH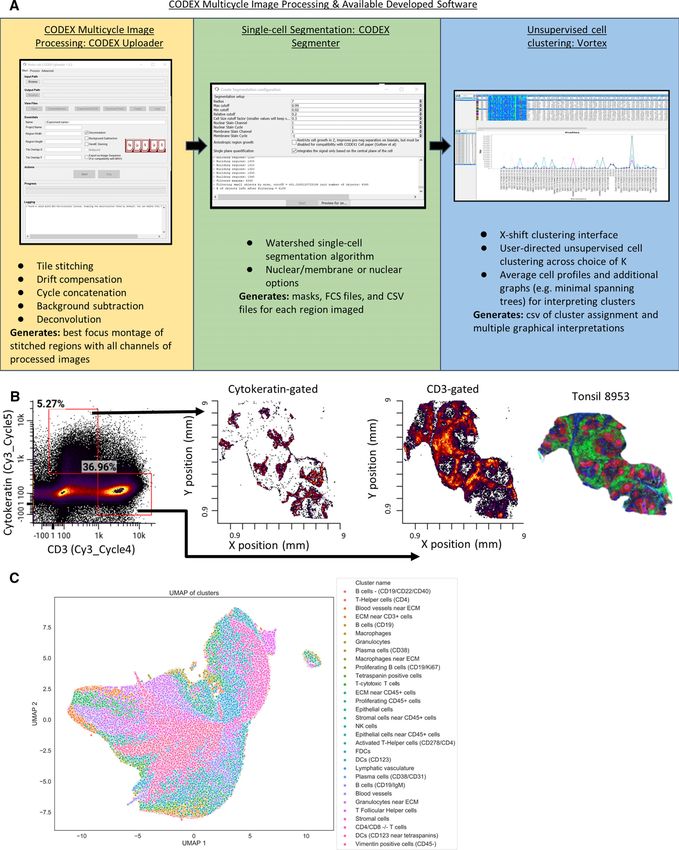
Eur. J. Immunol. 2021. 00: 1–16 New technology 3
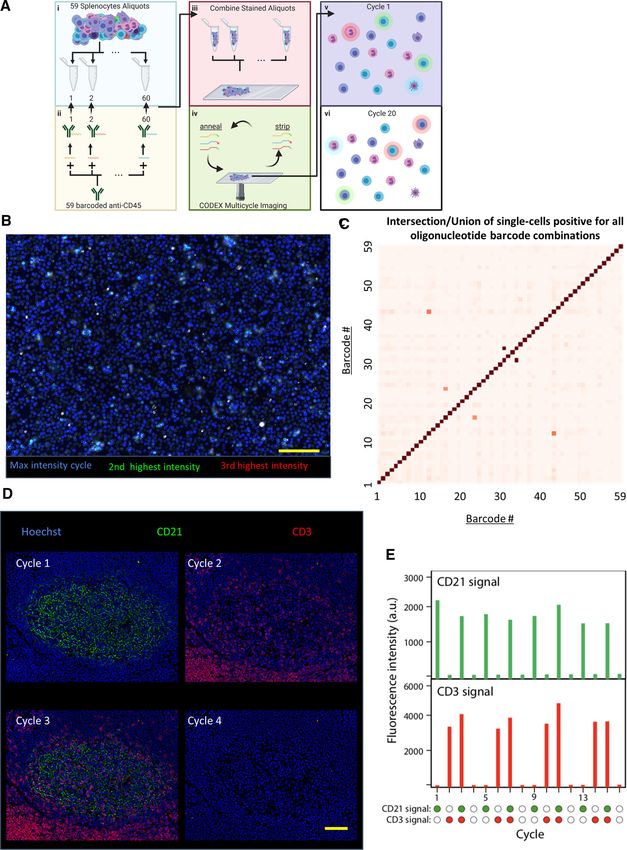
Figure 1. CODEX is a multiplexed tissue imaging technique that relies on antibodies conjugated to unique oligonucleotides. (A) Schematic of
repeated oligonucleotide exchange workflow for CODEX imaging. Briefly, antibodies conjugated with unique oligonucleotide barcodes are used
to stain a tissue section. Three antibodies bound to the tissue are then rendered visible by adding different complementary fluorescent oligonu-
cleotides. After imaging, the reporter oligonucleotides are stripped through the use of a chaotropic solvent. The cycle is repeated until all antibodies
within the panel have been revealed and imaged. (B) Data acquired are then concatenated and processed. The method enables evaluation of up to
60 markers simultaneously.
a robotic fluidics device is used to implement the following flu- library (Fig. 2A). We aliquoted murine splenocytes into 59 indi-
idics protocol: three fluorescent dye-conjugated oligonucleotides vidual tubes and then individually conjugated aliquots of the anti-
dissolved in a chaotropic solvent are added to the stained tis- mouse CD45 antibody to each barcode and used these barcoded
sue. The chaotropic solvent enables room temperature hybridiza- antibodies to stain the 59 different aliquots of mouse spleno-
tion of the fluorescent reporter oligonucleotides to their comple- cytes. After staining, all splenocyte aliquots were combined into
mentary DNA barcodes conjugated to unique antibodies. Fourth, a single-cell spread. The signal for each CODEX barcode channel
images of the antibody binding events are captured by fluores- was revealed by hybridization of up to three complementary fluo-
cent microscopy. Fifth, the three reporter oligonucleotides are rescent (FAM, Cy3, or Cy5) oligonucleotides per cycle of CODEX
removed by changing the solvent, followed by a washing step. The multicycle imaging. If cross-reactivity between oligonucleotides
hybridization process is then repeated with three other fluorescent or tissue is minimal, then there should be low signal from other
dye-conjugated oligonucleotides, and this cycle is repeated for as fluorophores within each cycle and across cycles.
many iterations as necessary to capture the spatial locations of We analyzed the multichannel imaging data visually to eval-
each antibody in the panel (Fig. 1A and B). uate which oligonucleotides exhibit cross-reactivity with another
The two core components of this technology are (1) the oligonucleotide. For every pixel in the image, we evaluated the
sequence orthogonal barcode library enabling association of each three channels with the greatest measured intensity. We then pro-
fluorescence signal to a specific antibody clone and (2) the flu- duced an image where the channel with the highest intensity (for
idics protocol used to add and remove the fluorescently labeled each individual pixel) is represented in blue, the channel with
oligonucleotides in each imaging step. The fluidics protocol is the second highest intensity in green, and the channel with the
fully automated using off-the-shelf components and control soft- third highest intensity in red. Because most pixels were blue,
ware that integrates with the microscope’s control software to this indicated there was minimal oligonucleotide cross-reactivity
coordinate the delivery of reagents and image acquisition. . (Fig. 2B).
Since each cell population was stained separately, each spleno-
cyte should only be labeled by one barcode. To further quantify
Validation of CODEX oligonucleotide barcode possible cross-reactivity, we segmented single cells as previously
specificity and annealing/stripping efficiency reported [27]. Populations of cells were identified that were pos-
itive for each barcode sequence by manual gating of the single-
We created an oligonucleotide library of 59 unique barcodes with cell expression data. We quantified the overlap (intersection over
sequences selected to eliminate binding between other barcodes the union) of oligonucleotide sequences of each pair and plotted
or genomic DNA (Supporting Information Table S1). We first this on a heatmap. Only three pairs showed even minimal cross-
evaluated cross-reactivity of our CODEX barcode oligonucleotide reactivity (Fig. 2C). These sequences were not used together in
© 2021 The Authors. European Journal of Immunology published by www.eji-journal.eu
Wiley-VCH GmbH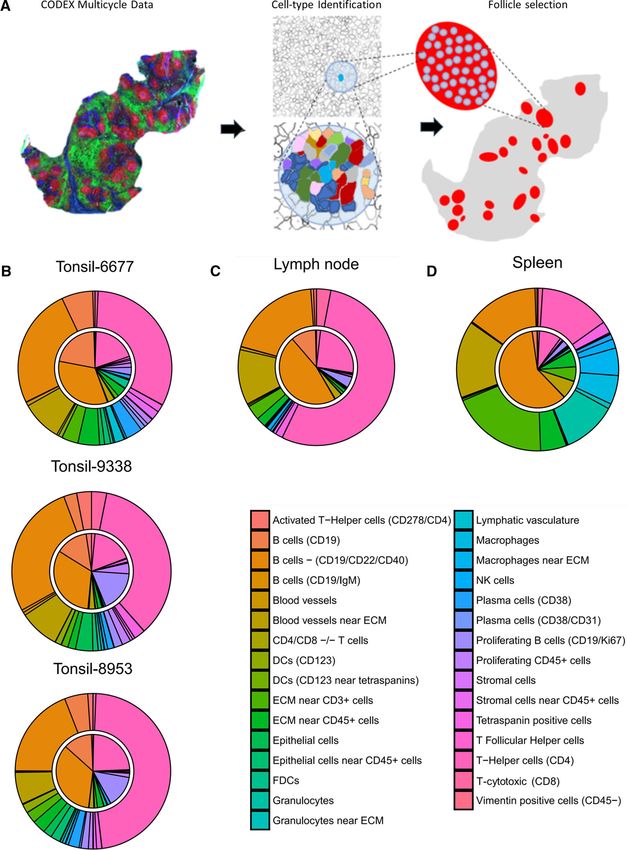
4   J. Kennedy-Darling et al.                                                                                            Eur. J. Immunol. 2021. 00: 1–16

    Figure 2. Validation of unique oligonucleotide barcode library. (A) Overall schematic for testing oligonucleotide orthogonality. (i) Fifty-nine spleno-
    cyte aliquots were made, and (ii) each one was stained with anti-mouse CD45 antibody with a unique oligonucleotide barcode. (iii) All aliquots
    were pooled and fixed on a slide and rendered visible through CODEX multicycle imaging. In principle, (v) cells should only display one fluorophore
    and (vi) an individual cell should only be stained in one cycle. (B) Image generated by evaluating each pixel and displaying the highest intensity
    pixel from all of the cycles with the color blue, the second highest intensity pixel from all of the cycles with the color green, and the third highest
    intensity pixel from all of the cycles with red (n = 1 experimental replicate, 15 × 106 splenocytes quantified across 59 barcodes). (C) Heatmap of
    quantified intersection over union of each oligonucleotide pair from single-cell segmented image data of the anti-CD45 stained splenocytes for all
    59 oligonucleotides. (D) Representative images from CODEX 16-cycle experiment where oligonucleotide-conjugated anti-CD21 (green) was rendered
    visible in the first cycle, anti-CD3 (red) in the second cycle, both in the third cycle, and neither in the fourth cycle; the four cycles were repeated
    three times (n = 1 experimental replicate over 16 channels). (E) Quantification of fluorescent intensities for the two channels across all 16 cycles.
    Scale bars: 100 μm, 20x magnification.

    © 2021 The Authors. European Journal of Immunology published by                                                                  www.eji-journal.eu
    Wiley-VCH GmbH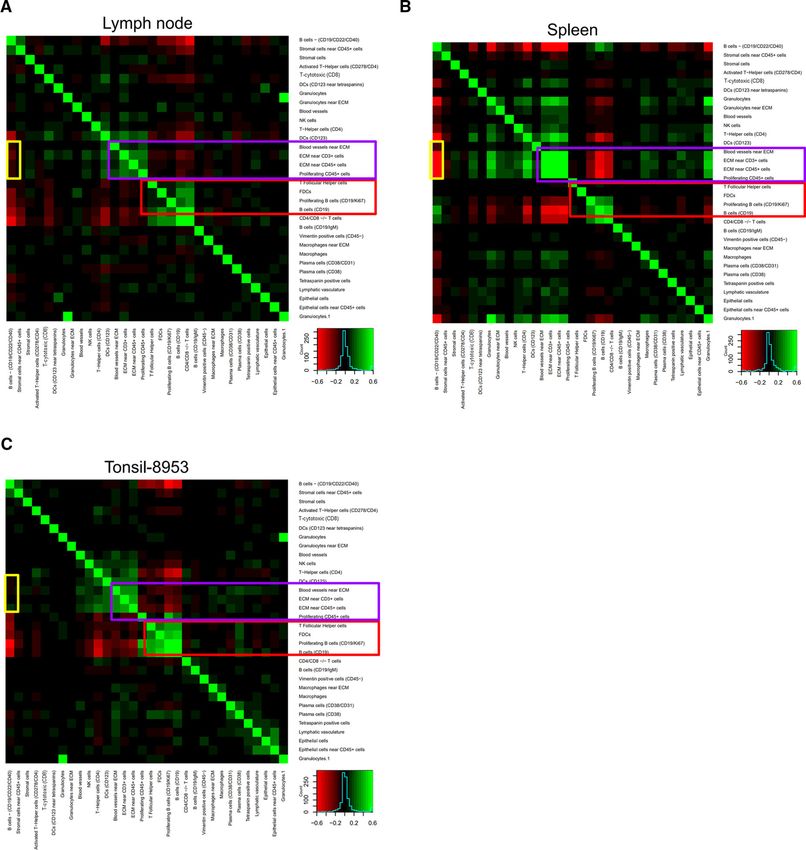
Eur. J. Immunol. 2021. 00: 1–16                                                                                            New technology       5

subsequent experiments. These results also demonstrate the effi-      lution, subtract background signal, segment single cells, and
ciency of the annealing and stripping fluidics protocol as fluores-   perform unsupervised single-cell clustering. This software is
cent barcodes from prior cycles were not present in subsequent        available for download at https://github.com/nolanlab/CODEX
imaging cycles.                                                       and https://github.com/nolanlab/vortexand currently supports
   To further validate the CODEX technique, a 16-cycle imaging        images generated from Keyence and Zeiss microscopes. The
experiment was performed using human tonsil tissue stained with       “CODEX Uploader” is used for automated image stitching, decon-
barcode-conjugated antibodies targeting CD21 and CD3. CD21            volution, drift compensation, background subtraction, and cycle
should only stain B cells and follicular DCs, whereas CD3 should      concatenation. The “CODEX Segmenter” enables automated
only stain T cells. We first added the dye-conjugated oligonu-        single-cell segmentation using a watershed algorithm. The “Vor-
cleotide complementary to the barcode conjugated to the CD21          teX” interface is used to apply the previously described X-shift
antibody and performed imaging. Second, this oligonucleotide          unsupervised clustering [29] (Fig. 4A).
was removed, and we added the dye-conjugated oligonucleotide               In addition to imaging up to three antibodies per cycle across
complementary to that conjugated to the CD3 antibody and per-         three fluorescent channels (FAM, Cy3, and Cy5), we also mea-
formed imaging. Third, this oligonucleotide was removed, and          sured the nuclear signal from Hoechst dye during every cycle
we added dye-conjugated oligonucleotides complementary to bar-        for image registration. The nuclear stain and the cell membrane
codes conjugated to both the CD3 and CD21 antibodies and per-         marker CD45 were used together to segment individual cells. This
formed imaging. In the fourth cycle, these were removed, no dye-      generated a multiparameter dataset consisting of fluorescence
conjugated oligonucleotide was added, and the tissue was imaged       intensity readings for each of the 46 antibody channels on 2.3 mil-
(Fig. 2D). These fluidics cycles were repeated three more times       lion individual cells in this experiment. The dataset generated is
(for a total of 16 cycles) and the signal associated with each        comparable in form to that resulting from mass cytometry or mul-
marker was measured. The fluorescence intensity associated with       tiparameter flow cytometry, but the spatial coordinates of each
each marker was reduced to background levels after each cycle         segmented cell are retained. Figure 4B shows two of the 46 mark-
and the signal generated from the addition of CODEX reporters         ers, cytokeratin and CD3, in a traditional flow cytometry-like plot.
was reproducible (within 20% of signal intensity) across addi-        Each gated population can then be visualized by X/Y coordinates.
tional cycles (Fig. 2E).                                              In this example, the populations correctly differentiate between
                                                                      epithelial and T-cell-rich regions of the tonsil.
                                                                           With 46 proteins measured simultaneously, manual gating of
CODEX multicycle imaging of dense human lymphoid                      cell populations is tedious and can be user biased. Consequently,
tissues with a 46-marker antibody panel                               we performed unsupervised clustering analysis using the X-shift
                                                                      algorithm [29]. In total, 31 clusters were identified, and cell sub-
After validating both the oligonucleotide barcode library and the     types were assigned based on expression of key markers (Fig. 4C,
automated fluidics protocol for CODEX imaging, 46 antibodies          Supporting Information Figs. S1 and 2). The identified cell types
were conjugated to unique CODEX barcodes (Supporting Infor-           correspond to all major cell subsets (immune, stromal, vascula-
mation Table S2). The antibodies chosen target markers of major       ture). The antibodies in our panel were selected to enable iden-
immune and nonimmune cell populations as well as structural           tification of immune cell subsets, and clusters corresponding to
features such as vasculature (Fig. 3A).Each antibody conjugate        T cells, B cells, macrophages, DCs, and NKCs were identified.
was tested separately with tissues known to express the marker of     Furthermore, this integrated pipeline also resolved key functional
interest for validation prior to the multicycle experiment.           subpopulations such as plasma cells, T-follicular helper cells, and
    This antibody panel was used to stain five fresh-frozen human     activated T-helper cells. Only a subset of cells displayed relatively
tissue sections (3 tonsils, 1 LN, and 1 spleen). We imaged areas      few identifying markers, such as the cluster-labeled tetraspanin
of approximately 0.5 cm2 per tissue but retained single-cell reso-    positive cells, which were positive for CD81 and CD9, likely a
lution by stitching together overlapping imaged tiles (Fig. 3B).      stromal cell subset. In the future, additional stromal cell mark-
Representative images from each of the 46 antibody channels           ers could be included to distinguish these cellular identities. The
and a nuclear channel (Hoechst 33342) are shown in an example         immune cell subsets were observed at similar frequencies across
for one tile from tonsil 9338 in Fig. 3C. Expected colocalizations    lymphoid tissues, with higher percentages of innate immune cells
of markers across the B-cell follicle, epithelium, and T-cell zone    like macrophages found in the spleen than in other tissues (Sup-
regions of the tissue were observed for each stained channel inde-    porting Information Figs. S1 and S2), as expected.
pendent of the imaging cycle in which the marker was detected.

                                                                      Characterization of cell-type distribution in and
Single-cell analysis of CODEX multicycle imaging of                   around B-cell follicles across lymphoid tissues
human lymphoid tissue
                                                                      The spleen, the LN, and the tonsils are all secondary lymphoid
To process the single-cell multiparametric imaging data, we           organs that are main sites of immunity. Structurally and func-
developed software to align cyclic images, perform deconvo-           tionally, each is distinct, but these organs all have B-cell follicles,

© 2021 The Authors. European Journal of Immunology published by                                                        www.eji-journal.eu
Wiley-VCH GmbH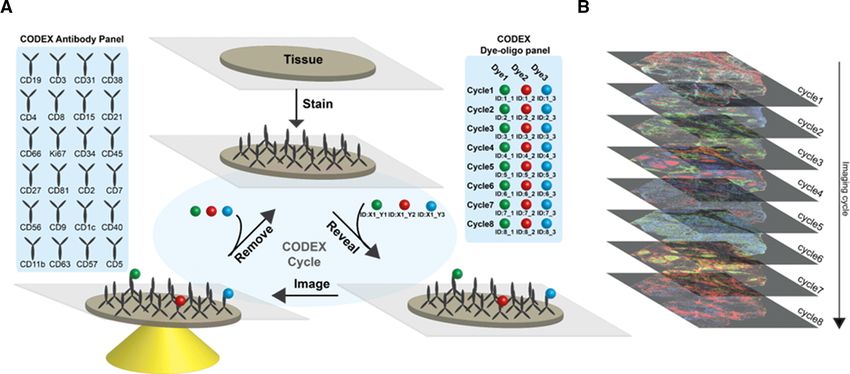
6   J. Kennedy-Darling et al.                                                                                        Eur. J. Immunol. 2021. 00: 1–16

    Figure 3. Use of the CODEX protocol to stain cellularly dense human lymphoid tissues with a panel of 46 antibodies (n = 1 CODEX multicycle
    imaging of each tissue with stated antibody panel: 3 tonsils, each from a different donor, 1 spleen from another donor, and 1 lymph node from
    another donor). (A) The 46-antibody panel contains antibodies to key adaptive and innate immune, functional, and stromal, and epithelial markers.
    (B) Overview images of five lymphoid tissue samples with Cytokeratin (blue), CD19 (red), and CD3 (green) shown. The higher magnification tile
    image shows tonsil 9338 with CD19 (blue), CD57 (grey), CD8 (green), Ki67 (yellow), Collagen IV (magenta), CD4 (red), and Cytokeratin (cyan). (C)
    Representative images of a zoomed in tile from tonsil 9338 of all markers and Hoechst staining. Scale bars: 100 μm, 20× magnification.

    which are critical for antibody responses. Using our multiparam-          within images of each tissue type (Fig. 5A). The relative distri-
    eter dataset, we investigated the cell-type compositions of the B-        butions of cell types across each follicle were averaged for each
    cell follicles of the different tissues.                                  tissue, represented by the inner circle of the pie chart (Fig. 5B).
        We identified follicle regions based on CD19 expression and           The relative distribution of each of these cell types surrounding
    also using tissue morphology based on Hoechst nuclear staining            the follicle regions were calculated, defined as a perimeter of 1.2

    © 2021 The Authors. European Journal of Immunology published by                                                            www.eji-journal.eu
    Wiley-VCH GmbH
Eur. J. Immunol. 2021. 00: 1–16 New technology 7 Figure 4. Processing of CODEX multiparameter imaging data. (A) The image analysis was performed using our “CODEX Uploader” for image pro- cessing, “CODEX segmenter” for cell segmentation, and “VORTEX” for unsupervised single-cell clustering. (B) Example of segmented data from tonsil 8953 as an fcs file with populations gated on fluorescent intensity of CD3 or Cytokeratin (no prior gating). These gated CD3+ and Cytokeratin+ pop- ulations are plotted with × (mm), y (mm) coordinates to reveal spatial locations of the populations in the tissue. (C) UMAP plot of all data with the 31 cell types identified by unsupervised clustering indicated by color (total number of cells quantified from single-cell segmentation from all tissues imaged = 2.3 × 10⁶ cells). © 2021 The Authors. European Journal of Immunology published by www.eji-journal.eu Wiley-VCH GmbH
8   J. Kennedy-Darling et al.                                                                                                Eur. J. Immunol. 2021. 00: 1–16

    Figure 5. Cell-type compositions within and surrounding lymphoid tissue follicle structures. (A) CODEX multiparameter imaging data were used
    to perform unsupervised clustering to identify key subtypes. CD19 expression data were used to manually identify follicles within tissues. Cell-type
    compositions of follicle areas and of cells directly surrounding the follicles were analyzed using these masks. (B-D) Average cell-type compositions
    of follicles from (B) three tonsil tissues, (C) a lymph node, and (D) a spleen; the inner pie circle corresponds to the area within each identified follicle
    and the outer rim corresponds to the cells directly surrounding the follicle (a diameter of 1.2 times the size of a cell).

    times the maximum distance between cells within the segmented                   (Fig. 5B, inner circle), as expected. However, tonsils 9338 and
    follicle region, as represented by the outer circle of the pie chart.           8953 had higher proportions of proliferating B cells, than tonsil
        Comparing the follicles of the three tonsils imaged, intrafollic-           6677, and tonsil 6677 had a higher proportion of resting B cells,
    ular cellular distributions were similar with 20-30% CD4+ T cells,              suggestive of potentially active immune responses within tonsils
    60-70% B cells, and about 10% other cell and stromal cell types                 9338 and 8953. The cell frequencies in the areas surrounding

    © 2021 The Authors. European Journal of Immunology published by                                                                      www.eji-journal.eu
    Wiley-VCH GmbH
Eur. J. Immunol. 2021. 00: 1–16 New technology 9
the follicles of tonsils were similar between tonsil samples. How- B cells [32], this anticorrelation likely corresponds to marginal
ever, there were higher proportions of CD4+ T cells (40-50%), zone structure within the spleen [33].
lower proportions of B cells (∼33%), and more blood vessels and
blood vessel cells near the ECM (∼20%) than within the folli-
cles (Fig. 5B, outer circle). Additionally, proliferating B cells were Discussion
present at significantly lower proportions (1-2%) in the areas sur-
rounding the follicles than within follicles across all tonsils. The streamlined version of multiplexed CODEX imaging reported
Comparison of the follicles from different secondary lymphoid here uses oligonucleotide-barcoded antibodies to stain tissues and
organs revealed considerable divergence in cellular compositions. iterative annealing and stripping of fluorescently labeled reporter
Follicles from tonsils were more cellularly comparable to follicles oligonucleotides to detect antibody binding. The repeated
from the LN (Fig. 5C) than those from the spleen (Fig. 5D). There oligonucleotide exchange reactions eliminate the need for enzy-
was a higher proportion of CD19+ /CD22+ /CD40+ B cells within matic reactions to detect antibody binding, decreasing the com-
follicles of spleen (∼66%) than within follicles of tonsils and LN plexity, time required, cost, computational analysis, and back-
(33-50%) (Fig. 5B-D, inner circle). Additionally, the proportion of ground signal associated with the original method [27]. This is
helper T (CD4+ ) cells within the splenic follicles (∼10%) was less enabled by using DMSO-based buffers, which act as chaotropic
than those of tonsil and LN (20-30%) (Fig. 5B-D, inner circle). solvents that reduce the melting point of DNA such that anneal-
Differences were even larger in proportions of cell populations ing and stripping of the DNA fluorescent barcodes can be done
surrounding follicles of different secondary lymphoid organs. For at room temperature [34]. Magnesium (Mg2+ ) ions also coun-
example, helper T (CD4+ ) cells made up about 33% of cells sur- teract the negative charges of DNA and improve duplex stability
rounding follicles in tonsils (Fig. 5B, outer circle), approximately [35,36]. The method employs a robotic fluidics system that can
66% in LN (Fig. 5D, outer circle), and about 20% in the spleen be integrated with a fluorescent microscope, which will facilitate
(Fig. 5D, outer circle). Moreover, the areas outside the follicle adoption by laboratories that use traditional immunofluorescent
regions in the spleen contained higher proportions of granulo- imaging.
cytes, macrophages, and T cells near ECM than in either the LN The 59 oligonucleotide barcodes designed were not cross-
or tonsils (∼50% vs. 10-15%) (Fig. 5B-D, outer circle). binding, bound specifically to cells, and were efficiently
hybridized and removed using chaotropic solvents. Oligonu-
cleotide barcode design is scalable, and the number of barcodes
Correlated cell-type densities within follicle regions could be expanded in the future to enable more than 59 mark-
ers to be identified simultaneously. For instance, additional fluo-
Beyond calculating the cellular compositions of distinct regions, rophores beyond the three deployed here each cycle could expand
spatially resolved cell-type identification enables assessment of the panel size in a given time frame or reduce the time for analysis
the local densities of various cell types. Under the assumption of a given panel size depending on how the probes are deployed.
that cell types move along density gradients, cell types with Validation of additional barcodes would allow antibodies to be
correlated local densities could indicate that a common molecu- used in multiple antibody panels without the need for barcode
lar program drives positioning, whereas anticorrelated cell-type reconjugation.
densities could correspond to a molecular program that maintains Using the repeated oligonucleotide exchange reactions method
separation. overcomes two challenges faced in multiplexed fluorescent imag-
We randomly extracted regions of 100 by 100 pixels across ing. First, compared to other multiparameter fluorescent imaging
each follicle region for each tissue and computed the frequencies techniques, this method has less spectral overlap as fewer fluo-
of cell types in each of these regions. We then evaluated corre- rophores are used per cycle. Second, batch effects are minimized
lations in these frequencies (Fig. 6, Supporting Information Fig. by staining with all antibodies at once and using the barcodes to
S3). In all three tissue types, there are two modules of cell types render each antibody fluorescent.
with strongly correlated densities. The first consists of proliferat- Here, we applied the modified CODEX technique to analyze
ing B-cell populations, CD19+ B cells, follicular DCs, and helper fresh frozen human immune organ sections. This technique is
T cells (Fig. 6, red boxes). This module is consistent with the pre- equally applicable to other clinical specimens, including formalin-
viously described composition of the light zone of the B-cell GC fixed, paraffin-embedded tissue with minor modifications to the
[30,31]. staining protocol, enabling large retrospective analyses through
The other module of highly correlated cell densities that was the imaging of tissue microarrays [28]. Moreover, using 3D tissue
common to all three tissue types consisted of collagen IV+ blood clearing techniques or expansion microscopy, this method could
vessels and CD3+ cells and CD45+ cells that were near ECM be applied to image multiple parameters within larger 3D vol-
(Fig. 6, purple box). This vascular module was anticorrelated with umes or focused super-resolution of a single cell [37-39].
the light zone module. This also showed that the CD22+ /CD40+ We stained five cellularly dense lymphoid tissues, including
B cells were anticorrelated with this vasculature module in the samples from tonsil, LN, and spleen, with a panel of 46 barcoded
spleen, whereas this was largely not the case for the LN or tonsil antibodies. Image processing and cell segmentation generated
(yellow box). As CD22 and CD40 are markers of marginal zone datasets analogous to those generated by multiplexed flow
© 2021 The Authors. European Journal of Immunology published by www.eji-journal.eu
Wiley-VCH GmbH10 J. Kennedy-Darling et al. Eur. J. Immunol. 2021. 00: 1–16
Figure 6. Cell-cell density correlation analysis for (A) lymph node, (B) spleen, and (C) tonsil determined by evaluating 100 × 100 pixel regions. The
heat map scale is from red (anticorrelated) to green (correlated). Correlated modules present in all three tissues are indicated by purple and red
boxes; an anticorrelated module present in spleen but not lymph node or tonsil is indicated by the yellow boxes.
cytometry or mass cytometry. Of course, in addition, the data of B-cell follicles illustrated that more innate immune cell types
from this modified CODEX protocol preserve cellular spatial were located around splenic follicles than follicles from the LN
information—a key need to understand tissue architecture or tonsil. Some of these differences between tissues observed
and function as cellular communication often involves cell-cell could be attributed to differences in the number of primary fol-
contact. licles observed, as well as anatomical peculiarities of the spleen.
Linking spatial positions with multiplexed protein expression In the future, separating out follicles with or without germi-
data enabled unique spatial single-cell analysis including unsu- nal centers may aid in more directly comparing follicular struc-
pervised cell identification, comparison of conserved structures ture across human lymphoid tissues. Finally, cell-density analy-
across organs, and analysis of cell density interactions. Compar- ses revealed conserved structures by cell-type associations such as
ing across lymphoid organs, highlighted previously established the light zone of the B-cell follicle and the marginal zone of the
cell types and structures [30,31,33]. Analysis of the periphery spleen.
© 2021 The Authors. European Journal of Immunology published by www.eji-journal.eu
Wiley-VCH GmbHEur. J. Immunol. 2021. 00: 1–16 New technology 11 We envision expansion upon the computational spatial anal- learning, and apply algorithms already used within geospatial yses described here. For example, one could use morphologic analyses. Combined with use of this newly developed CODEX pro- features of segmented cells, analyze neighborhoods of cells, tocol will enable novel biological insights into tissue homeostasis, compare and correlate with conventional images using machine cellular biology, and mechanisms of disease progression. Materials and methods Materials Reagent or Resource Source Identifier Antibodies Anti-Human CD38 (clone HB-7) Biolegend Cat.# 356602 Anti-Human Vimentin (clone RV202) BD Biosciences Cat.# 550513 Anti-Human CD8 (clone SK1) Biolegend Cat.# 344702 Anti-Human CD15 (clone HI98) Biolegend Cat.# 301902 Anti-Human CD21 (clone Bu32) Biolegend Cat.# 354902 Anti-Human CD66 (clone B1.1/CD66) BD Biosciences Cat.# 551354 Anti-Human HLA-DR (clone L243) Biolegend Cat.# 307651 Anti-Human CD7 (clone CD7-6B7) Biolegend Cat.# 343102 Anti-Human CD45RA (clone HI100) Biolegend Cat.# 304102 Anti-Human CD9 (clone HI9a) Biolegend Cat.# 312102 Anti-Human CD19 (clone HIB19) Biolegend Cat.# 302202 Anti-Human CD22 (clone HIB22) BD Biosciences Cat.# 555423 Anti-Human CD90 (clone 5E10) Biolegend Cat.# 328102 Anti-Human CD3 (clone UCHT1) Biolegend Cat.# 300402 Anti-Human Pan-Cytokeratin (clone AE1/AE3) Biolegend Cat.# 914204 Anti-Human CD5 (clone UCHT2) Biolegend Cat.# 300602 Anti-Human CD273 (clone 24F.10C12) Biolegend Cat.# 329602 Anti-Human Collagen IV (polyclonal) Abcam Cat.# ab6586 Anti-Human CD57 (clone HCD57) Biolegend Cat.# 322302 Anti-Human CD278 (clone C398.4A) Biolegend Cat.# 313502 Anti-Human CD34 (clone 561) Biolegend Cat.# 343602 Anti-Human IgM (clone MHM-88) Biolegend Cat.# 314502 Anti-Human CD56 (clone HCD56) Biolegend Cat.# 318302 Anti-Human CD45 (clone HI30) Biolegend Cat.# 304002 Anti-Human CD63 (clone H5C6) Biolegend Cat.# 353014 Anti-Human CD1c (clone L161) Biolegend Cat.# 331502 Anti-Human CD31 (clone WM59) Biolegend Cat.# 303102 Anti-Mouse Ki67 (clone B56) BD Biosciences Cat.# 556003 Anti-Human CD123 (clone 7G3) BD Biosciences Cat.# 554527 Anti-Human CD152 (clone BNI3) Biolegend Cat.# 369602 Anti-Human CD2 (clone RPA-2.10) BD Biosciences Cat.# 555324 Anti-Human CD81 (clone 5A6) Biolegend Cat.# 349502 Anti-Human CD4 (clone A161A1) Biolegend Cat.# 357402 Anti-Human podoplanin (clone NC-08) Biolegend Cat.# 337002 Anti-Human CD54 (clone HA58) BD Biosciences Cat.# 555510 Anti-Human CD117 (clone YB5.B8) BD Biosciences Cat.# 555713 Anti-Human CD279 (clone EH12.2H7) Biolegend Cat.# 329941 Anti-Human CD274 (clone 29E.2A3) Biolegend Cat. # 329702 Anti-Human Ecadherin (clone 24E10) Cell Signalling Technology Custom Anti-Human FAPa (clone F11-24) eBioscience Cat. # BMS168 Anti-Human CD49f (clone GOH3) BD Biosciences Cat.# 555734 Anti-Human CD16 (clone 3G8) BD Biosciences Cat.# 555404 Anti-Human CD11b (clone ICRF44) BD Biosciences Cat.# 555386 Anti-Human CD40 (clone HB14) Biolegend Cat.# 313002 Anti-Human CD27 (clone M-T271) BD Biosciences Cat.# 555439 © 2021 The Authors. European Journal of Immunology published by www.eji-journal.eu Wiley-VCH GmbH
12   J. Kennedy-Darling et al.                                                                                  Eur. J. Immunol. 2021. 00: 1–16

     Reagent or Resource                                                       Source                                     Identifier

     Anti-Human CD104 (clone 450–9D)                                       BD Biosciences                               Cat.# 555721
     Anti-Mouse CD45 (clone 30-F11)                                          Biolegend                                  Cat.# 109802
     Biological Samples
     Fresh-frozen human tissues (tonsil, lymph                  Deidentified human tissue sections                           N/A
       node and spleen)                                       obtained either commercially or from the
                                                                Stanford Cancer Center Tissue Bank.
     Mouse spleen cells                                        Spleen cells collected from a healthy                         N/A
                                                                                mouse
     Chemicals and reagents
     Hoechst 34580                                                    Thermo Fisher Scientific                          Cat.# H21486
     Coverslips                                                    Electron Microscopy Sciences                        Cat.# 72204-01
     Polylysine solution                                                   Sigma Aldrich                             Cat.# P8920-500ML
     1X DPBS                                                          Thermo Fisher Scientific                        Cat.# 14190250
     BS3                                                              Thermo Fisher Scientific                           Cat.# 21580
     Antibody stabilizer solution                                     Thermo Fisher Scientific                        Cat.# nc0436689
     Bio-Gel P-30 Gel                                                         Bio Rad                                  Cat.# 1504150
     Software and Algorithms
     R                                                                    R Core Team, 2017                      https://www.r-project.org
     X-Shift                                                                Samusik, 2016                                  N/A

     Contact for reagent and resource sharing                             with frequent washes with 1X DPBS. Extracted cells were fixed
                                                                          in 2% paraformaldehyde (PFA) for 10 min at room temperature.
     The image processing and data analysis tools presented in            Fixed cells were stored in 5% DMSO at −80°C until use. Just prior
     this article are available at https://github.com/nolanlab. Further   to use, aliquots of cells were thawed and washed once with 1X
     information will be provided by the corresponding authors upon       DPBS.
     reasonable request form.

                                                                          Antibody-oligonucleotide conjugation

     Methods
                                                                          Reagents Purified antibodies were obtained from the ven-
                                                                          dors listed in the table above. All antibodies were free from
     Tissue slicing                                                       carrier proteins and were in solutions containing PBS with
                                                                          low concentrations of sodium azide. Oligonucleotides with a
     Deidentified fresh frozen tissue samples were obtained from the      5’ protected maleimide modification were supplied by Trilink
     Stanford Cancer Center Tissue Bank. Tissue sections were placed      Biotechnologies.
     in OCT after resection and frozen and stored at −80°C. Tissues
     were sliced using a Leica CM3050 S configured cryostat. OCT
     embedded tissue samples were mounted to specimen chucks using        Deprotection of oligonucleotide maleimide groups Lyophilized
     OCT and equilibrated to the chamber temperature of the cryostat      oligonucleotide (2-8 mg) was weighed using a high-precision
     for 20 min. The specimen and surrounding temperatures were           scale and placed in a 1.7-mL Eppendorf tube. Toluene was added
     approximately −15°C. Tissue sections ranged between 5 and 10         to the tube (∼1.5 mL) and incubated at 90°C. The oligonucleotide
     μm. Sliced tissues were placed on polylysine coated coverslips and   pellet is not soluble in toluene. After 2 h of incubation, the toluene
     stored at −80°C until use.                                           was removed and replaced with fresh toluene and incubated for
                                                                          another 2 h. This toluene was removed and replaced with an
                                                                          additional aliquot of room temperature toluene. This aliquot of
                                                                          toluene was removed, and the oligonucleotide pellet was washed
     Mouse spleen cell extraction                                         four times with 100% ethanol (∼1.5 mL per wash). The oligonu-
                                                                          cleotide was dissolved to a final estimated concentration of 10
     Spleen cells were isolated from C57BL/6 mice. The spleen was         mg/mL in 2 mM Tris-HCl, pH 7, 1 mM EDTA, 150 mM NaCl, and
     placed in a solution of 1X Dulbecco’s phosphate-buffered saline      0.02% w/v NaN3 . The oligonucleotide concentration was mea-
     (DPBS) and then macerated through a sterile 70-μm cell strainer      sured using a Nanodrop and standard oligo settings.

     © 2021 The Authors. European Journal of Immunology published by                                                       www.eji-journal.eu
     Wiley-VCH GmbH
Eur. J. Immunol. 2021. 00: 1–16 New technology 13
Antibody partial reduction Concurrent with oligonucleotide dyes were synthesized with one of three fluorophores: Alexa488,
deprotection, purified antibody (typically 50 μg) was partially Cy3, or Cy5. Each CODEX antibody tag was conjugated to 50 μg
reduced by adding TCEP to a final concentration of 2 mM (from of anti-mouse CD45 (clone 30-F11).
a stock of 0.5 M at pH 7.0) and EDTA to a final concentration
of 2 mM (from a stock of 0.5 M at pH 8.0). The antibody con-
centration was approximately 0.5 mg/mL. The final volume was Staining of splenocytes for CD45 Aliquots of mouse spleen cells
adjusted to this concentration using 1X DPBS. This antibody solu- (0.25-0.5 million cells) were stained with each of the barcoded
tion was incubated at room temperature (∼23°C) for 30 min. anti-CD45 antibodies. Briefly, thawed and washed cells were
P30 Biogel slurry was prepared according to the manufac- resuspended in 1X DPBS, 0.5% w/v BSA, 5 mM EDTA, and 0.02%
turer’s instructions in 2 mM Tris-HCl, pH 7, 1 mM EDTA, 150 w/v NaN3 . Rat IgG and sheared salmon sperm DNA were added
mM NaCl, and 0.02% w/v NaN3 . A 3-mL aliquot of the slurry to the cells to a final concentration of 0.1 and 0.2 mg/mL, respec-
was added to the top of a Biospin chromatography column (Bio- tively. Cells were gently rotated for 10 min at room temperature.
Rad), and the column was placed in a FACS tube and spun down An aliquot of barcoded antibody (∼1 μL antibody/100 μL stain-
at 900 g for 5 min in a swinging bucket centrifuge. The Bio-Spin ing solution) was added to each sample and incubated with gentle
chromatography column was placed in a new FACS tube. The P30 rotation for 1 to 2 h. Cells were spun down at 600 g for 5 min in a
Biogel resin bed was slightly dry at the top after this step. swinging bucket centrifuge. The supernatant was removed, taking
After the 30-min incubation with TCEP and EDTA, the antibody care not to disrupt the cell pellet, and replaced with 1X DPBS with
solution was pipetted on top of the P30 Bio-gel resin bed. The 0.5 M NaCl (high-salt PBS). This step was repeated once more. All
column was spun down for 5 min at 900 g. The antibody solution cell aliquots were combined into a single tube and centrifuged at
collected in the FACS tube was transferred to a PCR tube and the 600 g for 5 min.
volume adjusted to the original volume of the reduction reaction
using excess tris-based buffer. The total NaCl concentration was Splenocyte attachment to slides The resultant cell pellet was
increased by 0.6 M by addition of 5 M NaCl stock solution. For a resuspended at approximately 15 million cells/mL (based on orig-
standard antibody reduction volume of 100 μL, 13.6 μL of 5 M inal cell density) and 10-15 μL of the cell slurry was pipetted
NaCl was added. onto a polylysine coated coverslip. After 10 min, 90 μL 1.6% PFA
in high-salt PBS was added to the droplet on top of the cover-
slip taking care not to disrupt the adhered cells. The solution
Antibody-oligonucleotide conjugation The volume correspond-
was incubated for 10 min at room temperature. The coverslip
ing to 0.1 mg of oligo was added to the antibody solution for each
was washed three times with high-salt PBS after which 100 μL
50-μg scale antibody conjugation reaction. The solution was incu-
2 mg/mL crosslinking reagent BS3 in high-salt PBS was added,
bated at room temperature for 2 h. After this time, the solution
and the coverslip with adhered cells was incubated for 20 min
was transferred to a preblocked (PBS-tween) 50-kDa molecular
at room temperature. The coverslip was washed three times with
weight cutoff filter. The remainder of the filter volume was filled
high-salt PBS and either used directly or stored for up to 2 weeks
with high-salt PBS (1X PBS with 1 M additional NaCl). After cen-
in 0.5 M NaCl, 0.5% w/v BSA, 1X DPBS, and 0.02% w/v NaN3
trifuging at 12 000 g for 8 min, the flow through was discarded,
(staining buffer 3) at 4°C.
and the filter was filled with high-salt PBS (∼0.45 mL). This step
was repeated twice. After the final wash, 0.1 mL of antibody stabi-
lizer solution with 0.5 M NaCl and 5 mM EDTA was added to the CODEX multicycle imaging To screen for barcode orthogonality,
top of the column. The filter was inverted into a new collection the coverslip with the mouse spleen cells stained with barcoded
tube and spun down for 2 min at 3000 g. The resulting barcoded antibodies was adhered to a custom acrylic holder using superglue
antibody solution was stored in a screw-top Eppendorf tube at and nail polish to form a sample well. Cells were stained with
4°C. The barcoded antibodies are suitable for use for at least 6 Hoechst within the sample well for 5 min prior to running the
months. experiment. Solutions containing sets of up to three dye-tagged
oligonucleotides complementary to barcodes were prepared based
on the desired order for imaging of barcoded antibodies. Each
Analysis for barcode cross-reactivity solution contained 400 nM of each dye-tagged oligonucleotide,
2.5 μg/mL Hoechst, 0.3 mg/mL sheared salmon-sperm DNA, and
Barcode and antibody preparation Oligonucleotide barcodes 88-96% v/v 10 mM Tris, pH 7.5, 10 mM MgCl2 , 150 mM NaCl,
were designed for sequence orthogonality. Each oligonucleotide 0.1% Triton X (v/v), and 0.02% NaN3 .
included a maleimide moiety to purified antibodies according to
the protocol listed above, and a CODEX-tagged dye, which con-
tains a conjugated fluorophore and a sequence that complements CODEX-tagged antibody tissue staining protocol
the CODEX-antibody tag. The CODEX antibody tags were ordered
from Trilink Biotechnologies and the CODEX-tagged dyes were Tissue preparation Human fresh-frozen lymphoid tissues were
ordered from Integrated DNA Technologies (IDT). CODEX-tagged sliced 5-10 μm thick using a Leica CM3050 cryostat and placed on
© 2021 The Authors. European Journal of Immunology published by www.eji-journal.eu
Wiley-VCH GmbH14 J. Kennedy-Darling et al. Eur. J. Immunol. 2021. 00: 1–16
polylysine coated coverslips. Sliced tissues were stored at −80°C to be imaged and the resolution or magnification settings of the
until use. Coverslips with tissues were removed from the freezer microscope. Here, large regions (>400 tiles at 20× magnification)
and placed on drierite beads for 2 min. Coverslips were incu- were acquired, such that imaging time for each cycle was approx-
bated at room temperature in acetone for 10 min. Samplers were imately 3.5 h. The washing, annealing, and stripping procedures
removed from the acetone and coverslips were dried for 2 min. require about 30 min per cycle regardless of tissue imaging size.
Tissue culture plates (6-well) were used to incubate the cover- Since there were a total of 19 cycles, the total time to run each
slips with tissue samples for all subsequent buffers. Coverslips tissue was approximately 66 h. As such, the chemistry took overall
were transferred to wells containing 0.5% w/v BSA, 1X DPBS, 9.5 h and the imaging of the large area required 56.5 h.
and 0.02% w/v NaN3 (staining buffer 1). This step was repeated
once. Tissues were fixed for 10 min in a 1.6% PFA in staining
buffer 1, after which they were washed twice in staining buffer 1. CODEX multicycle image processing We used the CODEX
Uploader (https://github.com/nolanlab/CODEX) for automat-
ing image stitching, drift compensation, and cycle concate-
Antibody staining Antibody cocktail solutions were prepared in nation. A watershed-based, single-cell segmentation algorithm,
61 mM Na2 HPO4 , 39 mM NaH2 PO4 , 50 mM NaCl, 0.25% w/v formalized as the “CODEX Segmenter” (https://github.com/
BSA, 0.5X DPBS, pH 6.8-7.0, and 0.01% w/v NaN3 (staining nolanlab/CODEX), was used for automating segmentation of
buffer 2) using between 0.8-2 μL per antibody for a 200 μL stain- single cells to generate csv and fcs files. The “VorteX”
ing solution. Tissues were stained for 3 h at room temperature (https://github.com/nolanlab/vortex) interface was used for X-
in a humidity chamber. Tissue sections were washed twice with shift unsupervised clustering as previously described [29]. Mark-
staining buffer 2 and fixed for 10 min using 1.6% PFA in stain- ers CD274, Ecadherin, and FAPa were excluded from the unsu-
ing buffer 3. Tissues were washed three times with 1X DPBS and pervised analysis and cell-type assignment. Cell types for each of
placed in ice-cold methanol for 5 min. Tissues were again washed the 31 clusters were assigned based on averaged overall marker
in 1X DPBS and then fixed using 0.2 mL of 2 mg/mL BS3 in high- expression profiles.
salt PBS. Finally, tissues were washed three times in 1X DPBS and
stored in staining buffer 3 prior to the CODEX multicycle experi-
ment. Follicle cell-type composition analysis
We identified and selected follicle regions across tissues based
CODEX multicycle imaging Stained tissue sections were on CD19 expression and also using tissue morphology based on
mounted to a custom acrylic holder using super glue and nail Hoechst nuclear staining. We manually gated masks over the
polish. A custom microscope state insert was manufactured that images and then computed the average distribution of cell types
enabled attachment of the acrylic holder to the microscope and across each tissue. We then used a perimeter around the manual
delivery and removal of reagents. A 96-well plate was prepared masks of 1.2 times the maximum distance between cells to cal-
for each experiment containing cocktails of up to three dye-tagged culate the relative distributions of each cell type surrounding the
oligonucleotides complementary to barcodes at final concentra- follicle regions and averaged these across follicles for a tissue.
tions of 400 nM in the presence of 150 mM NaCl, 10 mM Tris (pH
7.5), 0.1% w/v Triton X-100, 10 mM MgCl2 . 6H2 O, and 0.02% w/v
NaN3 (1X CODEX buffer), 1:600 Hoechst, and 0.5 mg/mL sheared Cell density correlation analysis
salmon sperm DNA in a volume of 0.25 mL. Solutions contain-
ing 1X CODEX buffer and 20% DMSO and 80% DMSO, respec- We assessed the local frequencies of cell types within 100 × 100
tively, were prepared and loaded onto a custom fluidics instru- pixel squares sampled randomly across images. We used cell cen-
ment based on the autosampler provided by MLE. troid positions extracted from cell segmentation as the default
Microscope imaging was performed using a Keyence BZX700 location of each cell type. This yielded a matrix of celltype con-
inverted microscope with filter cubes for the detection of Hoechst, centrations across many sampled regions. We then evaluated cor-
FAM, Cy3, and Cy5. Exposure times for each antibody were cali- relations between densities of each pair of cell types using the
brated and ranged from 0.05 to 0.5 s. Each CODEX cycle consisted Spearman’s rank correlation coefficient.
of addition of solution containing up to three dye-tagged oligonu-
cleotides to the sample followed by a 5-min incubation and wash-
ing of the sample using the 20% DMSO-based buffer. The tissue
sample was then imaged, the dye-tagged oligonucleotides were
removed by washing with 80% DMSO-based solution. This pro-
cess was repeated until all of the antibody staining data was Acknowledgments: This work was supported by the
collected. The fluidics process and image acquisition are fully U.S. National Institutes of Health (2U19AI057229-16,
automated using a custom Python-based script. The total time 5P01HL10879707, 5R01GM10983604, 5R33CA18365403,
to perform CODEX imaging depends on the size of the region 5U01AI101984-07, 5UH2AR06767604, 5R01CA19665703,
© 2021 The Authors. European Journal of Immunology published by www.eji-journal.eu
Wiley-VCH GmbHEur. J. Immunol. 2021. 00: 1–16 New technology 15
5U54CA20997103, 5F99CA212231-02, 1F32CA233203-01, m9.figshare.13079291) used in this manuscript on figshare
5U01AI140498-02, 1U54HG010426-01, 5U19AI100627-07, (https://figshare.com/). Further information will be provided
1R01HL120724-01A1, R33CA183692, R01HL128173-04, upon request from the corresponding authors.
5P01AI131374-02, 5UG3DK114937-02, 1U19AI135976-01,
IDIQ17 × 149, 1U2CCA233238-01, 1U2CCA233195-01);
the U.S. Department of Defense (W81XWH-14-1-0180, References
W81XWH-12-1-0591); the U.S. Food and Drug Administra-
tion (HHSF223201610018C, DSTL/AGR/00980/01); Cancer 1 Thommen, D. S., Koelzer, V. H., Herzig, P., Roller, A., Trefny, M., Dimeloe,
Research UK (C27165/A29073); the Bill and Melinda Gates S., Kiialainen, A., et al., A transcriptionally and functionally distinct PD-1+
CD8+ T cell pool with predictive potential in non-small-cell lung cancer
Foundation (OPP1113682); the Cancer Research Institute; the
treated with PD-1 blockade. Nat. Med. 2018. 24: 994–1004.
Parker Institute for Cancer Immunotherapy; the Kenneth Rainin
2 Dieu-Nosjean, M. -C., Goc, J., Giraldo, N. A., Sautès-Fridman, C., and Frid-
Foundation (2018-575); the Silicon Valley Community Foun-
man, W. H., Tertiary lymphoid structures in cancer and beyond. Trends
dation (2017-175329 and 2017-177799-5022); the Beckman Immunol. 2014. 35: 571–580.
Center for Molecular and Genetic Medicine; Juno Therapeutics,
3 Sautès-Fridman, C., Petitprez, F., Calderaro, J., and Fridman, W. H., Tertiary
Inc. (122401); Pfizer, Inc. (123214); Celgene, Inc. (133826, lymphoid structures in the era of cancer immunotherapy. Nat. Rev. Cancer
134073); Vaxart, Inc. (137364); and the Rachford & Car- 2019. 19: 307–325.
lotta A. Harris Endowed Chair to G.P.N. C.M.S. was supported 4 Bruno, T. C., B cells to the forefront of immunotherapy. Nature 2020. 577:
by the Swiss National Science Foundation (P300PB_171189, 474–476.
P400PM_183915), and the Lady Tata Memorial Trust, Lon- 5 Helmink, B. A., Reddy, S. M., Gao, J., Zhang, S., Basar, R., Thakur, R., Yizhak,
don, UK. J.W.H. was supported by an NIH T32 Fellowship K., et al., B cells and tertiary lymphoid structures promote immunother-
(T32CA196585), and an American Cancer Society-Roaring Fork apy response. Nature 2020. 577: 549–555.
Valley Postdoctoral Fellowship (PF-20-032-01-CSM). S.S.B. was 6 Cabrita, R., Lauss, M., Sanna, A., Donia, M., Larsen, M. S., Mitra, S., Johans-
supported by the BioX Stanford Interdisciplinary Graduate Fel- son, I., et al., Tertiary lymphoid structures improve immunotherapy and
lowship and Stanford Bioengineering. Figure 2A was created with survival in melanoma. Nature 2020. 577: 561–565.
BioRender.com. 7 Petitprez, F., de Reyniès, A., Keung, E. Z., Chen, T. W. -W., Sun, C. -M.,
Calderaro, J., Jeng, Y. -M., et al., B cells are associated with survival and
immunotherapy response in sarcoma. Nature 2020. 577: 556–560.
8 Carstens, J. L., De Sampaio, P. C., Yang, D., Barua, S., Wang, H., Rao, A.,
Author contributions: Conceptualization: J.K.D., N.S., Y.G., and Allison, J. P., et al., Spatial computation of intratumoral T cells correlates
G.P.N.; Methodology: J.K.D., S.B., G.V., N.S., Y.G., and C.M.S.; with survival of patients with pancreatic cancer. Nat. Commun. 2017. 8:
Hardware and programming: J.K.D., N.S., and Y.G.; Software: 1–13.
S.S.B., V.G.V., N.S., and Y.G.; Validation: J.K.D., S.B., G.V., N.S., 9 Goc, J., Germain, C., Vo-Bourgais, T. K. D., Lupo, A., Klein, C., Knockaert,
and Y.G.; Formal Analysis: J.K.D., S.S.B., G.L.B., J.W.H., and S., de Chaisemartin, L., et al., Dendritic cells in tumor-associated ter-
tiary lymphoid structures signal a Th1 cytotoxic immune contexture and
C.M.S.; Investigation: S.S.B., J.W.H., and C.M.S.; Resources:
license the positive prognostic value of infiltrating CD8+ T cells. Cancer
V.G.V., N.S., and Y.G.; Writing -Original Draft: S.S.B. and J.W.H.; Res. 2014. 74: 705–715.
Writing-review and editing: J.W.H., C.M.S., and G.P.N.; Supervi-
10 Kircher, M. F., Allport, J. R., Graves, E. E., Love, V., Josephson, L., Licht-
sion: C.M.S. and G.P.N.; Funding acquisition: G.P.N. man, A. H., and Weissleder, R., In vivo high resolution three-dimensional
imaging of antigen-specific cytotoxic T-lymphocyte trafficking to tumors.
Conflict of interests: J.K.D. is an employee of Akoya Biosciences, Cancer Res. 2003. 63: 6838–6846.
Inc. G.P.N. received research grants from Pfizer, Inc., Vaxart, Inc., 11 Damond, N., Engler, S., Zanotelli, V. R. T., Schapiro, D., Wasserfall, C. H.,
Celgene, Inc., and Juno Therapeutics, Inc. during the course of Kusmartseva, I., Nick, H. S., et al., A map of human type 1 diabetes pro-
this work. N.S., Y.G., and G.P.N. are inventors on US patent gression by imaging mass cytometry. Cell Metab. 2019. 29: 755–768.
9909167, granted to Stanford University that covers some aspects 12 Giesen, C., Wang, H. A. O., Schapiro, D., Zivanovic, N., Jacobs, A., Hatten-
of the technology described in this article. J.K.D., N.S., Y.G., and dorf, B., Schüffler, P. J., et al., Highly multiplexed imaging of tumor tissues
G.P.N. have equity in and/or are scientific advisory board mem- with subcellular resolution by mass cytometry. Nat. Methods 2014. 11: 417–
422.
bers of Akoya Biosciences, Inc. C.M.S. is a scientific advisor to
Enable Medicine, LLC. The other authors declare no commercial 13 Keren, L., Bosse, M., Marquez, D., Angoshtari, R., Jain, S., Varma, S., Yang,
S. -R., et al., A structured tumor-immune microenvironment in triple neg-
or financial conflict of interests.
ative breast cancer revealed by multiplexed ion beam imaging. Cell 2018.
174: 1373–1387.
Peer review: The peer review history for this article is available
14 Angelo, M., Bendall, S. C., Finck, R., Hale, M. B., Hitzman, C., Borowsky, A.
at https://publons.com/publon/10.1002/eji.202048891
D., Levenson, R. M., et al., Multiplexed ion beam imaging (MIBI) of human
breast tumors. Nat. Med. 2014. 20: 436–442.
Data availability statement: The image processing and
15 Spraggins, J. M., Djambazova, K. V., Rivera, E. S., Migas, L. G., Neumann,
data analysis tools presented in this article are avail- E. K., Fuetterer, A., Suetering, J., et al., High-performance molecular imag-
able at https://github.com/nolanlab. We have uploaded ing with MALDI trapped ion-mobility time-of-flight (timsTOF) mass spec-
the single-cell segmented data (https://doi.org/10.6084/ trometry. Anal. Chem. 2019. 91: 14552–14560.
© 2021 The Authors. European Journal of Immunology published by www.eji-journal.eu
Wiley-VCH GmbHYou can also read