High-resolution synthetic UV-submm images for simulated Milky Way-type galaxies from the Auriga project
←
→
Page content transcription
If your browser does not render page correctly, please read the page content below
MNRAS 506, 5703–5720 (2021)                                                                                         https://doi.org/10.1093/mnras/stab2043
Advance Access publication 2021 July 19

High-resolution synthetic UV–submm images for simulated Milky
Way-type galaxies from the Auriga project
Anand Utsav Kapoor ,1‹ Peter Camps ,1‹ Maarten Baes ,1 Ana Trčka ,1 Robert J. J. Grand ,2
Arjen van der Wel ,1 Luca Cortese ,3 Ilse De Looze1 and Daniela Barrientos 1
1 Sterrenkundig  Observatorium, Universiteit Gent, Krijgslaan 281 S9, B-9000 Gent, Belgium
2 Max-Planck-Institut für Astrophysik, Karl-Schwarzschild-Str 1, D-85748 Garching, Germany
3 International Centre for Radio Astronomy Research, The University of Western Australia, 35 Stirling Highway, Crawley, WA 6009, Australia

                                                                                                                                                             Downloaded from https://academic.oup.com/mnras/article/506/4/5703/6324023 by Ghent University user on 16 August 2021
Accepted 2021 July 9. Received 2021 June 1; in original form 2021 March 19

ABSTRACT
We present redshift-zero synthetic observational data considering dust attenuation and dust emission for the 30 galaxies of
the Auriga project, calculated with the SKIRT radiative transfer code. The post-processing procedure includes components for
star-forming regions, stellar sources, and diffuse dust taking into account stochastic heating of dust grains. This allows us to
obtain realistic high-resolution broad-band images and fluxes from ultraviolet (UV) to submillimetre (submm) wavelengths.
For the diffuse dust component, we consider two mechanisms for assigning dust to gas cells in the simulation. In one case,
only the densest or the coldest gas cells are allowed to have dust, while in the other case this condition is relaxed to allow a
larger number of dust-containing cells. The latter approach yields galaxies with a larger radial dust extent and an enhanced dust
presence in the interspiral regions. At a global scale, we compare Auriga galaxies with observations by deriving dust scaling
relations using spectral energy distribution fitting. At a resolved scale, we make a multiwavelength morphological comparison
with nine well-resolved spiral galaxies from the DustPedia observational data base. We find that for both dust assignment
methods, although the Auriga galaxies show a good overall agreement with observational dust properties, they exhibit a slightly
higher specific dust mass. The multiwavelength morphological analysis reveals a good agreement between the Auriga and the
observed galaxies in the optical wavelengths. In the mid- and far-infrared wavelengths, Auriga galaxies appear smaller and more
centrally concentrated in comparison to their observed counterparts. We publicly release the multi-observer images and fluxes
in 50 commonly used broad-band filters.
Key words: radiative transfer – methods: numerical – dust, extinction – galaxies: ISM.

                                                                                unresolved processes like star formation and stellar feedback or
1 I N T RO D U C T I O N
                                                                                disregarding certain physical processes.
Modern astronomical surveys provide enormous amounts of obser-                     Recent hydrodynamical simulations reproduce observational
vational data. In order to interpret these data, a parallel theoretical         galaxy populations to a remarkable degree; examples include EA-
framework is required. The currently accepted paradigm of the                  GLE (Schaye et al. 2015), SIMBA (Davé et al. 2019), and Illus-
cold dark matter (e.g. Hinshaw et al. 2013; Planck Collaboration                trisTNG (Pillepich et al. 2019). However, detailed predictions of
XIII 2016; Planck Collaboration VI 2020) provides us with a way                 these simulations still depend on the underlying implementation
to confront observations by the means of numerical simulations.                 of subgrid physics. The fine tuning of the subgrid physics models
Numerical simulations of galaxy formation have taken a giant                    introduces free parameters, which are generally calibrated based
leap in the last decade. Improvement in computer power, coupled                 on some key observables, such as the cosmic star formation rate
with improved numerical treatment has made it possible to handle                (SFR) density and/or the stellar mass content of galaxies at redshift
baryonic physics with increasing complexity. State-of-the-art galaxy            zero. These properties tend to be global in nature. Each galaxy is
formation simulations have started to include the effects of magnetic           considered to be a single point, neglecting internal structure and
fields, radiation fields, relativistic particles, etc. For a review, see        leaving the subgrid models’ accuracy or the calibration in doubt.
Somerville & Davé (2015) and Vogelsberger et al. (2020a). The                  A comparison at resolved spatial scales could reveal interesting
inclusion of baryons, on one hand, is essential for the study of                differences between simulated galaxy populations with otherwise
galaxies, but on the other hand involves the treatment of a wide                similar global properties. For example, Inoue & Yoshida (2019)
variety of physical processes spanning tens of orders of dynamic                show that adjusting the equation of state of the gas without changing
range. This necessitates the use of simplified subgrid recipes for              feedback or initial conditions can control formation of giant star-
                                                                                forming clumps in massive discs at redshifts ∼1–2 without affecting
                                                                                the global galaxy properties. Similarly, different stellar and active
   E-mail: anandutsav.kapoor@ugent.be (AUK); peter.camps@ugent.be (PC)         galactic nuclei (AGN) feedback schemes, which are essential in con-


C 2021 The Author(s)

Published by Oxford University Press on behalf of Royal Astronomical Society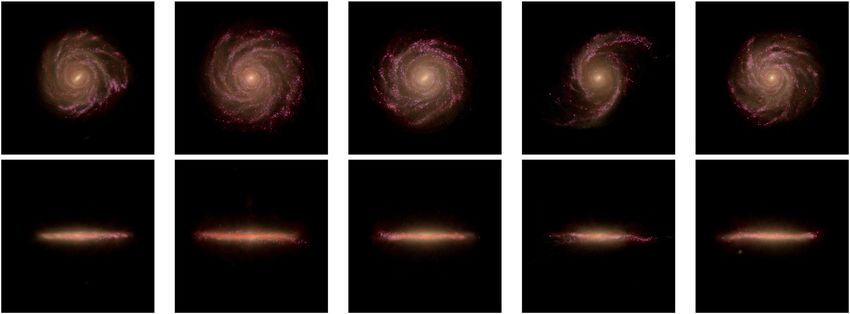
5704        A. U. Kapoor et al.
trolling gas cooling and star formation, could lead to a different gas     2 METHODOLOGY
composition and thermodynamical structure in and around galaxies
                                                                           We broadly follow the methodology pioneered by Camps et al. (2016,
(Naab & Ostriker 2017). Once again, a comparison at resolved scales
                                                                           2018) and Trayford et al. (2017) for the SKIRT post-processing of
could be used to differentiate and test galaxy formation models.
                                                                           galaxies in the EAGLE simulations, and subsequently applied to
   The success of a galaxy formation model at resolved scales would
                                                                           other cosmological hydrodynamical simulations by, for example,
eventually be determined by a comparison with observations, which
                                                                           Liang et al. (2018, 2019), Ma et al. (2019), Rodriguez-Gomez et al.
makes it essential that we generate mock observational data from the
                                                                           (2019), Cochrane et al. (2019), Vogelsberger et al. (2020b), Schulz
simulations, taking in account the relevant physics involved in the
                                                                           et al. (2020), Popping et al. (2021), and Trčka et al. (in preparation).
transformation from intrinsic to observed quantities. This brings us
                                                                           We summarize the key features of our methodology here.
to the need to account for the dust grains in the interstellar medium
(ISM). Notwithstanding a mass contribution to the ISM of only about

                                                                                                                                                       Downloaded from https://academic.oup.com/mnras/article/506/4/5703/6324023 by Ghent University user on 16 August 2021
1 per cent, dust locks up a substantial fraction of all heavy elements
                                                                           2.1 The Auriga simulations
and provides the primary source of opacity for non-ionizing photons,
thus influencing a galaxy’s spectral energy distribution (SED) at all      In this paper, we use the redshift-zero snapshots of the Auriga
wavelengths longer than 912 Å. In a typical disc galaxy, dust grains       suite of cosmological simulations, which is a set of 30 zoom
reprocess nearly one-third of the stellar light (Viaene et al. 2016;       simulations aimed at the modelling of Milky Way-type galaxies
Bianchi et al. 2018). The reprocessed energy shows up in the mid-          in a full cosmological context (Grand et al. 2017), carried out
infrared (MIR) and far-infrared (FIR) wavelength ranges, providing         using the moving-mesh magnetohydrodynamics (MHD) code AREPO
yet another mode of comparison with observational data.                    (Springel 2010). The Auriga simulations follow a  cold dark matter
   Most cosmological hydrodynamical simulations do not include             cosmology with parameters m = dm + b = 0.307, b = 0.048,
dust evolution in the galaxy formation physics, although important          = 0.693, and Hubble constant H0 = 100 h = 67.77 km s−1 Mpc−1 ,
steps forward have recently been made in this direction (McKinnon,         consistent with the Planck Collaboration XVI (2014) data release.
Torrey & Vogelsberger 2016; McKinnon et al. 2017; Vogelsberger                The host dark matter haloes of the zoomed galaxy simulations were
et al. 2019; Kannan et al. 2020; Granato et al. 2021). Simulated           drawn from a dark matter only simulation of comoving side length
galaxies are, thus, usually post-processed by assuming a fixed             100 cMpc. Further selection criteria were imposed on the mass and
percentage of the metal mass in the ISM as dust grains and solving the     the isolation of the host haloes. The virial mass ranges between
radiative transfer problem (e.g. Whitney 2011; Steinacker, Baes &          1 and 2 times 1012 M , consistent with recent determinations of the
Gordon 2013). Recent forward modelling efforts at resolved scales          Milky Way mass (see Wang et al. 2015, and references therein).
(e.g. Rodriguez-Gomez et al. 2019; Bignone et al. 2020; Parsotan           The isolation criterion was imposed by ensuring that any halo more
et al. 2020) target the impact of the presence of dust on the galaxy       than 3 per cent of the target halo mass is farther than nine times its
properties in the optical wavelengths. Such a strategy could be            virial radius from the main halo. A progressively coarser resolution
extended by including dust emission wavelengths, allowing a more           at increasing distances from the target object is employed to increase
comprehensive comparison, shedding light on the dust distribution in       the computation speed. This allows for a higher resolution simulation
comparison with observations, and gaining important insights about         of the selected objects in a cosmological setting by maintaining
the fidelity of the simulations in a wider spectral range.                 the large-scale tidal field. The selected haloes were resimulated by
   The main purpose of this work is to facilitate such comparisons         applying the so-called ‘zoom-in’ technique. The mass distribution
by producing and publishing spatially resolved synthetic observables       in the Lagrangian region forming the main halo is identified in the
for a suite of high-resolution zoom-in hydrodynamical simulations,         initial conditions, sampled by a large number of resolution elements
including the effects of both extinction and emission by dust.             and then resimulated.
These data products enable a detailed, local scale, multiwavelength           The Auriga physics model uses primordial and metal-line cooling
comparison with observations across the full range from ultraviolet        with self-shielding corrections. A spatially uniform UV background
(UV) to submillimetre (submm) wavelengths. We use the Auriga               field (Faucher-Giguère et al. 2009) is employed. The ISM is modelled
suite of zoom-in hydrodynamical simulations (Grand et al. 2017),           with a two-phase equation of state from Springel & Hernquist (2003).
which consists of a realistic galaxy population in a cosmological          Star formation proceeds stochastically in gas with densities higher
setting. The set of 30 galaxies reproduces a wide range of present-day     than a threshold density (nthr = 0.13 cm−3 ). The star formation
observables, in particular, disc-dominated galaxies with appropriate       probability in the candidate gas cells scales exponentially with time,
stellar masses, sizes, rotation curves, SFRs, and metallicities. We        with a characteristic time-scale of tSF = 2.2 Gyr. The single stellar
use the radiative transfer code SKIRT (Camps & Baes 2015, 2020)            population (SSP) of each star particle is represented by the Chabrier
to capture the intricate interplay between the simulated galaxy’s          (2003) initial mass function (IMF). Mass and metal returns from
constituents and generate high-resolution images in broad-bands at         Type Ia supernova (SNIa), asymptotic giant branch (AGB), and Type
UV to submm wavelength and at multiple observer positions.                 II supernova (SNII) stars are calculated at each time step and are
   In Section 2, we provide some background on the Auriga sim-             distributed among nearby gas cells with a top-hat kernel. The number
ulations and the SKIRT radiative transfer code, and we describe            of SNII events equals the number of stars in an SSP that lie in
how the Auriga results were exported to and post-processed by              the mass range 8–100 M . In order to mimic SNII events, a star-
SKIRT, with appendices containing some related information. In             forming gas cell could also be converted to a galactic wind particle
Section 3, we explain our post-processing calibration strategy. In         instead of a star. The wind particle is launched in an isotropically
Section 4, we describe the synthetic observables generated and their       random direction and interacts only gravitationally. It recouples
availability. Section 5 contains the results of the analyses carried out   hydrodynamically as soon as it reaches a gas cell with a density of
using the synthetic data including the derivation of global physical       5 per cent of the star formation density threshold, to mimic SN-driven
properties and a spatially resolved morphology study. In Section 6,        winds emerging from star-forming regions. The model includes gas
we summarize and conclude and we suggest some possible uses of             accretion by black holes, with AGN feedback in radio and quasar
our data products.                                                         modes, both of which are always active and are thermal in nature.

MNRAS 506, 5703–5720 (2021)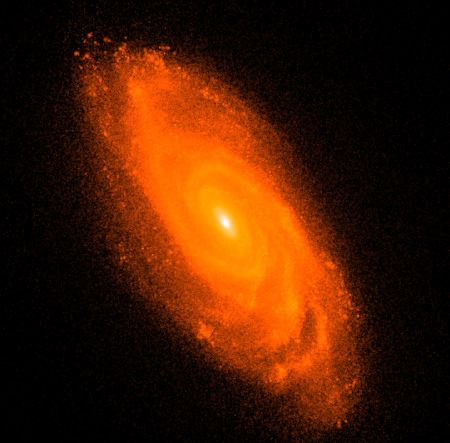
Dust in Milky Way-like simulated galaxies                          5705
           Table 1. Auriga numerical resolution parameters at red-                 and dust populations, including grid- or particle-based representa-
           shift zero. From left to right, the columns list resolution             tions generated by hydrodynamical simulations. The dust density
           level, dark matter particle mass, typical baryonic particle             distribution is discretized using one of the built-in dust grids,
           mass, and softening length of collisionless particles.                  including octree, k-d tree (Saftly, Baes & Camps 2014), and Voronoi
                                                                                   (Camps, Baes & Saftly 2013) grids. In this work, we use SKIRT’s
           Resolution level         mDM (M )        mb (M )      (pc)
                                                                                   most recent version, SKIRT 9. We next look at the steps used in the
           4                         3×    105        5× 10⁴       369             construction of the SKIRT input model.
           5                         2 × 10⁶          4 × 10⁵      738
           3                         4 × 10⁴          6 × 10³      184
                                                                                   2.3 Data extraction from Auriga snapshots for SKIRT

Table 2. Input parameters of the SKIRT radiative transfer model for each           For each galaxy, we extract the corresponding sets of star particles

                                                                                                                                                                 Downloaded from https://academic.oup.com/mnras/article/506/4/5703/6324023 by Ghent University user on 16 August 2021
of the Auriga components, in addition to the particle/cell positions. The          and gas cells, labelled as (a) and (b) in Fig. 1, from the Auriga
procedure for deriving a dust distribution from the gas cells (item e in Fig. 1)   simulation snapshots at redshift zero. We use a cubical aperture
is discussed in Section 2.3.2. The procedures for the particles representing       centred at the galaxy centre of mass to extract the data. The side
stellar populations and star-forming regions (items c and d in Fig. 1) are         of the cube is twice the radius at which the face-on stellar surface
discussed in Section 2.3.1.                                                        density within ±10 kpc of the mid-plane in the vertical direction
                                                                                   falls to a value of 2 × 10⁵ M kpc−2 . For three galaxies, AU-17,
Param.               Description                                Origin
                                                                                   AU-18, and AU-30, we use a higher value of cut-off surface density,
                                   Dust                                            6 × 10⁵ M kpc−2 , in order to avoid secondary structures in the data
                                                                                   other than the main galaxy. Any star particles or gas cells outside this
ρ gas                Gas density                                Simulation
                                                                                   region are ignored. A histogram of the aperture side lengths for the
Z                    Gas metallicity                            Simulation
                                                                                   Auriga galaxies is shown in the upper left-hand panel of Fig. 4.
T                    Gas temperature                            Simulation
SFR                  Star formation rate of the gas             Simulation
fdust                Fraction of the metallic gas               Free parameter
                     locked up in dust                                             2.3.1 Primary emission sources

                                   Stars                                           Star particles with an undefined age, which represent stellar wind
                                                                                   particles, are ignored. In order to characterize of the primary
h                    Smoothing length                           Assumed            sources of emission, each remaining star particle is assigned an SED
                                                                distribution
                                                                                   depending on its intrinsic properties inherited from the simulation.
Minit                Birth mass of the stellar                  Simulation
                                                                                   The star particles with an age above 10 Myr are assigned an SED
                     population
Z                    Metallicity of the stellar                 Simulation         from the Bruzual & Charlot (2003) template library for the Chabrier
                     population                                                    (2003) IMF with the appropriate age, metallicity, and initial stellar
t                    Age of the stellar population              Simulation         mass. Young star particles with an age below 10 Myr are assumed to
                                                                                   be still enshrouded by dust, and receive a special treatment. A young
                               SF regions
                                                                                   star particle is assigned an appropriate SED from the MAPPINGS III
h                    Smoothing length                           Calculated         SED family (Groves et al. 2008). These templates model both the
M                    Mass of the H II region                    Simulation         H II region and the photodissociation region (PDR) surrounding the
SFR                  Star formation rate of the H II            Calculated         star-forming core, including the dust contained in those regions. The
                     region                                                        MAPPINGS III templates are parametrized by five parameters, and we
Z                    Metallicity of the H II region             Simulation         determine these values for each young star particle in the following
C                    Compactness of the H II region             Assumed
                                                                                   way.
                                                                distribution
P                    Pressure of the ambient ISM                Calculated             (i) The metallicity, Z, is taken directly from the particle properties.
fPDR                 Dust covering fraction of the              Free parameter         (ii) The SFR is determined from the mass assigned to the star-
                     photodissociation region                                      forming particle at birth assuming a constant SFR during the H II
                     (PDR)
                                                                                   region’s lifetime of 10 Myr, following Groves et al. (2008).
                                                                                       (iii) The H II region compactness, C, is the prime parameter that
Magnetic fields are treated with ideal MHD following Pakmor &                      sets the shape of the FIR continuum dust emission, and is hence a
Springel (2013).                                                                   proxy for the dust temperature distribution (Groves et al. 2008). By
   In this paper, we use the fiducial Auriga models at resolution level            fitting modified blackbody functions to the MAPPINGS III templates
4, the specifications of which are given in Table 1.                               corresponding to different values of the compactness, we have
                                                                                   determined the correspondence between dust temperature and C.
                                                                                   Subsequently, we use the observed dust temperature distribution in
2.2     SKIRT   radiative transfer code
                                                                                   star-forming regions in Local Group galaxies (Utomo et al. 2019),
SKIRT  is a public multipurpose Monte Carlo radiative transfer code                and in hydrodynamical zoom simulations that take into account
(Camps & Baes 2015, 2020; Verstocken et al. 2017) for simulating                   dust physics (Kannan et al. 2020), to generate the distribution of
the effect of dust on radiation in astrophysical systems. It offers                compactness. This distribution can be approximated by a lognormal
full treatment of absorption and multiple anisotropic scattering by                distribution with log C = 5 and standard deviation 0.4. For each
the dust, computes the temperature distribution of the dust and the                young stellar particle, we hence randomly sample a value for log C
thermal dust re-emission self-consistently, and supports stochastic                from this distribution.
heating of dust grains. The code handles multiple dust mixtures and                    (iv) The ambient ISM pressure only affects the strength of a
arbitrary three-dimensional (3D) geometries for radiation sources                  number of emission lines, and does not affect the shape of the SED

                                                                                                                         MNRAS 506, 5703–5720 (2021)
5706         A. U. Kapoor et al.

                                                                                                                                                                     Downloaded from https://academic.oup.com/mnras/article/506/4/5703/6324023 by Ghent University user on 16 August 2021
                             Figure 1. Schematic overview of the SKIRT post-processing procedure used for the Auriga galaxies.

of the template. We calculate it for each star particle using equation
(13) of Groves et al. (2008).
   (v) The covering fraction of the PDR, fPDR , is determined as fPDR =
exp (−t/τ clear ), where t is the age of the stellar particle and τ clear is
the molecular cloud clearing or dissipation time-scale. We treat τ clear
as a free parameter in our post-processing framework and its value
is determined in Section 3.
   The methodology presented here for assigning the H II region com-
pactness and covering fraction, where we end up with a distribution
for these properties rather than a single value, differs from those used
in previously carried out post-processing of simulated galaxies.

2.3.2 Dust allocation
The next step in the post-processing framework is determining the
distribution of interstellar dust in each simulated galaxy. The Auriga
simulations do not include dust physics, hence we need to use a
recipe to infer the dust distribution based on the properties of the
interstellar gas. We assume that a constant fraction of the metals in
the eligible dust-containing ISM (DISM) is locked up in dust grains.
In other words, for each gas cell we set the dust density, ρ dust , as
follows:                                                                        Figure 2. Temperature–density phase diagram for the galaxy AU-6. The
                                                                               green lines represent recSF8000 (equation 2), where all gas to the right of
            fdust Zρgas if DISM,
ρdust =                                                            (1)          the vertical line or below the horizontal line is used for dust allocation. The
            0            otherwise,                                             orange line represents recT12 (equation 3), where all gas cells below the
where Z and ρ gas represent the metallicity and gas density given by            slanted line are eligible for dust allocation. The colour indicates gas mass (in
                                                                                M ) binned in 150 bins for both log (T/K) and log (ρ gas /ρ thr ), where ρ thr is
the gas cell’s properties in the Auriga snapshot. Furthermore, fdust
                                                                                the star formation threshold density corresponding to nthr = 0.13 cm−3 .
refers to the dust-to-metal ratio, Mdust /MZ , with Mdust and MZ the
dust mass and the metal mass in a given simulation cell. We treat fdust         in the dust geometry, so that the diffuse dust content of each galaxy
as a free parameter in our post-processing framework and its value              is essentially traced by the star-forming gas alone, as in Rodriguez-
is determined in Section 3.                                                     Gomez et al. (2019). We refer to this recipe as recSF8000 for the
   We use two different recipes for selecting the DISM.                         rest of this work.
  (i) Following Camps et al. (2016), only gas cells with non-zero                  (ii) We distinguish rotationally supported interstellar gas, settled
SFR or with a gas temperature, T, below 8000 K are treated as DISM.             in the disc, from the hot circumgalactic gas following Torrey et al.
This can be written as                                                          (2012):

DISM ⇐⇒ ρgas > ρthr or T < 8000 K,                                      (2)                          T                            ρgas
                                                                                DISM ⇐⇒ log               < 6 + 0.25 log                         . (3)
                                                                                                     K                     1010 h2 M kpc−3
where ρ thr is the Auriga star formation density threshold. In Fig. 2,
gas cells fulfilling these conditions are shown to the right of the             This demarcation is shown by the orange line in Fig. 2. This kind
vertical green line and below the horizontal green line. The cut-off            of dust allocation is also driven by the galaxy formation simulations
value of 8000 K is somewhat arbitrary, and in practice, the addition            following dust formation and destruction (e.g. see McKinnon et al.
of the gas cells below 8000 K does not cause a considerable change              2016, 2017), which despite using simple dust-evolution models show

MNRAS 506, 5703–5720 (2021)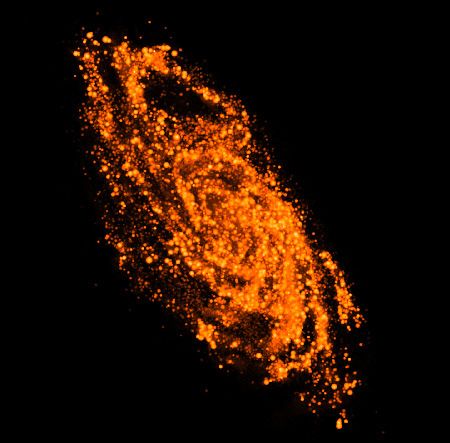
Dust in Milky Way-like simulated galaxies                        5707
                                                                                        Table 2 provides a summary of the various physical properties
                                                                                      used in building the SKIRT input models of the Auriga galaxies.

                                                                                      2.4 Radiative transfer on the Auriga galaxies: SKIRT
                                                                                      configuration
                                                                                      Apart from specifying the physical input model (Sections 2.3 and 3)
                                                                                      and the synthetic observables (Section 4), we need to configure SKIRT
                                                                                      to perform the radiative transfer simulations on the Auriga galaxies,
                                                                                      as described in this section. We use the same SKIRT configuration
                                                                                      for both recSF8000 and recT12, although the configuration

                                                                                                                                                                  Downloaded from https://academic.oup.com/mnras/article/506/4/5703/6324023 by Ghent University user on 16 August 2021
                                                                                      parameters were determined using the recSF8000 recipe.

                                                                                      2.4.1 Dust spatial grid
                                                                                      The SKIRT radiative transfer procedure requires the dust density
                                                                                      distribution of the system under study to be discretized on a spatial
                                                                                      grid. Within each grid cell, the dust density and all other physical
Figure 3. Dust surface density (in M pc−2 ) computed directly from the               quantities, such as the radiation field, are assumed to be uniform.
simulation data for AU-2, AU-6, and AU-16 based on the dust allocation                SKIRT supports many different dust grid types, including unstructured
schemes discussed in Section 2.3.2 and the fdust values taken from Table 3.           grids (Camps et al. 2013) and adaptive hierarchical Cartesian grids
All dust within ±5 kpc of the mid-plane is projected on a grid with a bin size
                                                                                      such as octree or binary trees (Saftly et al. 2013, 2014). Given that
of 0.75 kpc. The radial dust surface density distribution is also shown, along
                                                                                      the Auriga simulations are run with the AREPO hydrodynamics code
with the disc scale length h obtained by fitting a function of the form r0 e−r/h (r
being the radius). The fits do not consider the central dust distribution, whose      on an unstructured Voronoi mesh, it seems most logical to directly
extent is determined by eye. The impact of the change in dust allocation recipe       run the SKIRT post-processing using the same grid. Photon packet
can be clearly seen, with recT12 showing a more diffuse and extended dust             traversal through a Voronoi mesh is, however, inherently slower
distribution in comparison to recSF8000. We remark that the lack of dust              than through an octree grid. Moreover, it is not guaranteed that the
in the centres of these galaxies is likely because of the AGN quasar mode             Voronoi grid used for the hydrodynamics is optimal for radiative
feedback, which causes low gas density holes to appear after a local dump of          transfer post-processing. We ran tests using the native Voronoi grid
thermal energy.                                                                       and octree grids with different subdivision characteristics, the results
                                                                                      of which are given in Section A1. Our final simulations were run
                                                                                      using an octree grid with a maximum of 12 allowed subdivisions and
the presence of dust in the lower density, non-star-forming gas settled               a maximum cell dust fraction value of 10−6 . Fig. 4 provides some
in the galactic discs aside from the higher density star-forming gas.                 relevant statistics on the discretization of the diffuse dust density for
We call this recipe recT12 from hereon.                                               the Auriga galaxies with these grid parameters.
    Star-forming gas cells in the Auriga simulations are above the
density threshold ρ thr and are assumed to be composed of hot and                     2.4.2 Dust model
cold phases. The physics of the star-forming gas is governed by
an effective equation of state (Springel & Hernquist 2003). The                       Diffused dust in our simulations uses The Heterogeneous dust Evolu-
simulations report an effective temperature for the gas of such nature                tion Model for Interstellar Solids (THEMIS) dust model described by
(as shown in Fig. 2). This value is a mass-weighted temperature                       Jones et al. (2017) and the references therein. In this model, there are
obtained using the hot and cold phase temperatures, which are                         two families of dust particles: amorphous silicates and amorphous
≈106 and ≈103 K, respectively. This allows us to find a cold gas                      hydrocarbons. For the silicates, it is assumed that half of the mass
fraction in each cell. We associate dust only with the cold gas in                    is amorphous enstatite, and that the remaining half is amorphous
such cells. In practice the cold gas fraction turns out to be nearly                  forsterite. The size distribution is considered as lognormal and the
unity for most star-forming cells. For the lower density, non-star-                   same (a 10–3000 nm) for both populations of amorphous silicates
forming gas, the gas fraction associated with dust is assumed to be                   with the distribution peak at apeak      140 nm. For the amorphous
unity.                                                                                hydrocarbon population, the size distribution is a combination of a
    Fig. 3 shows the impact of changing the dust allocation recipe                    power-law and a lognormal distribution. The power-law distribution
on the dust surface density of three Auriga galaxies when viewed                      is used for amorphous carbon particles with sizes a ࣠ 20 nm, while
face-on. The dust morphology clearly differs: recT12 shows a                          the lognormal distribution is for larger grains, a 10–3000 nm with
more diffuse dust distribution that is radially more extended and                     apeak 160 nm.
has a higher coverage of the interspiral region in comparison to                         We use 15 grain size bins for each population of silicates and
recSF8000.                                                                            hydrocarbons to discretize the thermal emission calculations of the
    The procedure described above completely sets the spatial dis-                    dust mix.
tribution and properties of the stars and dust in each system, apart
from two free parameters: the molecular cloud dissipation time-scale
                                                                                      2.4.3 Number of photon packets and wavelength grid
τ clear and the dust-to-metal ratio fdust in the interstellar medium. In
Section 3, we calibrate these free parameters by comparing the global,                Apart from a sufficiently high spatial resolution (Section 4), high-
spatially integrated fluxes of the entire sample of Auriga galaxies to                quality broad-band images also require a sufficient signal-to-noise
a set of observed galaxies.                                                           ratio (SNR). The SNR of the output images directly drives the number

                                                                                                                           MNRAS 506, 5703–5720 (2021)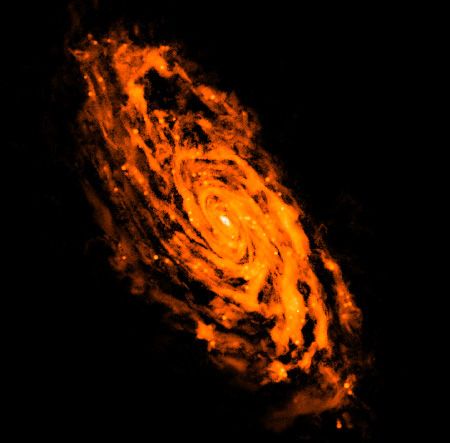
5708         A. U. Kapoor et al.

                                                                                                                                                                      Downloaded from https://academic.oup.com/mnras/article/506/4/5703/6324023 by Ghent University user on 16 August 2021
Figure 4. The first column (in grey) shows the side length of the cubical aperture used to extract the simulation data and the number of simulation Voronoi
cells within that aperture. The remaining panels show the distribution of the SKIRT dust discretization properties for each of the dust allocation recipes. From
left to right: the number of cells in the octree dust grid constructed by SKIRT; the 90 per cent percentile V-band optical depth of the cells in that grid; and the
discretization error on the total dust mass (i.e. the difference between the actual dust mass and the dust mass discretized on the grid).

of photon packets required in the radiative transfer simulations,                   Herschel broad-band filters for each of Auriga galaxies in face-on and
which, in turn, drives the simulation run time. We base the required                edge-on configurations. We then convert these fluxes to luminosities.
number of photon packets in the simulations on the relative error                   We vary the molecular cloud dissipation time-scale τ clear and the
statistic (R) described in Camps & Baes (2020). The results of our                  dust-to-metal ratio fdust in the models to find the best match with the
tests are provided in Section A2. For the chosen instrument set-                    observational data available.
up (Section 4), it turns out that using 2 × 10¹⁰ photon packets                        For this comparison, we use the DustPedia galaxy sample (Davies
forms a good compromise between sufficient SNR and an acceptable                    et al. 2017). This sample contains 875 nearby galaxies with matched
simulation run time.                                                                aperture photometry in more than 40 bands from UV to millimetre
   For all simulations carried out for this work, we use a logarithmic              wavelengths (Clark et al. 2018). We apply the CIGALE SED fitting
wavelength grid with 40 points running from 0.02 to 10 μm for the                   code (Noll et al. 2011; Boquien et al. 2019) to each of the DustPedia
storing the mean radiation field in each cell. For dust emission, a                 galaxies with the same parameter settings as used by Bianchi et al.
nested logarithmic grid is employed. The low-resolution part of this                (2018), Nersesian et al. (2019), and Trčka et al. (2020) except that
nested grid has 100 points, running from 1 to 2000 μm, whereas the                  we use the Chabrier (2003) IMF for SSPs, consistent with the IMF
higher resolution part runs in the polycyclic aromatic hydrocarbon                  used in the Auriga simulations. In order to select DustPedia galaxies
(PAH) emission range from 0.2 to 25 μm with 400 wavelength points,                  similar to the Auriga galaxies, we consider late type (Hubble stage
We refer to Camps & Baes (2020) for a discussion on the conver-                     > 0), star-forming galaxies with SFRcig > 0.8 M yr−1 , where
gence of both these wavelength grids for a very similar simulation                  SFRcig is the SFR inferred using the CIGALE SED fitting code.
set-up.                                                                             We impose an additional constraint based on WISE-3.4 μm band
                                                                                    luminosities, where we select galaxies that fall in the WISE-3.4 μm
                                                                                    luminosity range of the Auriga sample. This essentially imposes a
3 C A L I B R AT I O N O F T H E M O D E L                                          stellar mass selection criterion because the 3.4 μm band is a good
PA R A M E T E R S                                                                  proxy for stellar mass (Wen et al. 2013). This procedure leaves us
As discussed in Section 2, our post-processing recipes contain two                  with a DustPedia subsample of 45 galaxies, which we call DPD45.
global free parameters that we calibrate by comparing spatially                     We mention that for any missing observational data, we substitute
integrated luminosities for the sample of Auriga galaxies to those                  the best-fitting value obtained using CIGALE. For the seven bands
of a set of nearby galaxies. For both dust allocation recipes, we gen-              used in calibration, i.e. GALEX-far-ultraviolet (FUV), GALEX-near-
erate synthetic broad-band fluxes in the Galaxy Evolution Explorer                  ultraviolet (NUV), WISE-1, WISE-4, Photodetector Array Camera
(GALEX), Sloan Digital Sky Survey (SDSS), Two Micron All-Sky                        and Spectrometer (PACS)-70, Spectral and Photometric Imaging
Survey (2MASS), Wide-field Infrared Survey Explorer (WISE), and                     REceiver (SPIRE)-250, and SPIRE-500, the number of values

MNRAS 506, 5703–5720 (2021)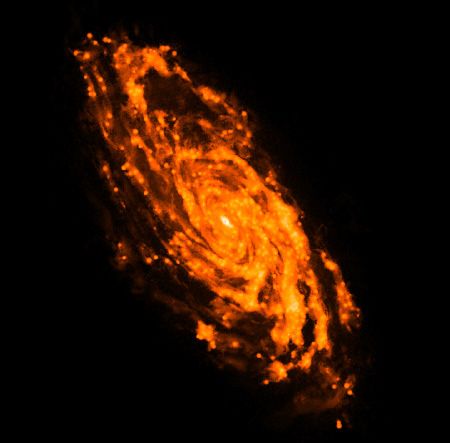
Dust in Milky Way-like simulated galaxies                       5709
                                                                                     DPD45, although the results for lower values show a slightly better
                                                                                     agreement. The large difference in the f250 /f500 colour between the
                                                                                     Auriga galaxies and DPD45 is likely to be a result of inadequate dust
                                                                                     heating, which we discuss further along with the scaling relations of
                                                                                     Fig. 7.
                                                                                        Observationally, τ clear is not very well constrained but is expected
                                                                                     to be of the order of a few Myr and is expected to be driven
                                                                                     by early feedback mechanisms such as winds, radiation pressure,
                                                                                     photoionization, etc. The value quoted in Groves et al. (2008) is 1–
                                                                                     2 Myr, whereas in Chevance et al. (2020a,b), based on a sample of
                                                                                     nine nearby disc galaxies, the duration of the feedback phase during

                                                                                                                                                                Downloaded from https://academic.oup.com/mnras/article/506/4/5703/6324023 by Ghent University user on 16 August 2021
                                                                                     which molecular clouds and H II regions coexist is inferred to be
                                                                                     1–5 Myr.
                                                                                        We fix τ clear = 1 Myr for both recSF8000 and recT12 based
                                                                                     on the behaviour of the MAPPINGS III templates in our tests, while
                                                                                     being in the range of values quoted in the literature. It is worth
                                                                                     mentioning that although we did the parameter space exploration
                                                                                     only for recSF8000, we do not expect a significant difference in
                                                                                     results if we repeat this exercise for recT12. We remark that while
                                                                                     we have tested τ clear < 1 Myr, we do not use those values in order to
                                                                                     be consistent with the observationally inferred clearing time-scales.
Figure 5. Colour–colour relation between PACS-70/WISE-22 and SPIRE-
250/SPIRE-500 bands. Larger values of τ clear correspond to a higher
contribution of cold dust both in the star-forming particles, leading to higher      3.2 Fixing the dust-to-metal ratio
f70 fluxes relative to f22 , and in the diffuse ISM, leading to higher f500 fluxes   Using τ clear = 1 Myr, we now quantify the correspondence between
relative to f250 . This moves the Auriga data points away from those of DPD45        DPD45 and the Auriga mock observations as a function of fdust .
with an increase in τ clear . The Auriga points shown here use recSF8000
                                                                                     We use a generalization to two-dimensional distributions of the
with fdust = 0.225.
                                                                                     well-known Kolmogorov–Smirnov (K–S) test (Kolmogorov 1933;
                                                                                     Smirnov 1948) as described in Press et al. (1992) following Fasano &
replaced by SED fitting for DPD45 are 1, 1, 0, 0, 36, 1, and 1,                      Franceschini (1987) and Peacock (1983). The K–S test computes
respectively.                                                                        a metric D that can be interpreted as a measure of the ‘distance’
   We calibrate the free parameters for our dust allocation recipes (see             between two sets of two-dimensional data points, with smaller D
Section 2.3.2) by comparing broad-band luminosity scaling relations                  values indicating better correspondence. We use the scaling relations
between the post-processed Auriga galaxies and DPD45.                                between WISE-3.4, and each one of GALEX-FUV, GALEX-NUV,
                                                                                     WISE-22, SPIRE-250, and SPIRE-500 to carry out the K–S test. We
                                                                                     use the mean D obtained from these scaling relations to quantify
3.1 Fixing the cloud dissipation time-scale
                                                                                     our choice of fdust . We note that the DPD45 sample lacks galaxies at
As mentioned in Section 2, the cloud dissipation time-scale is                       higher mass end of Auriga sample, i.e. with a WISE-3.4 luminosity
connected to the covering fraction of the PDR and thus determines                    above 1010 L (median of the Auriga sample). Hence, we implement
the dust emission from the star-forming regions. With increasing                     the K–S test as follows.
τ clear , the contribution of the dust emission from the star-forming                   We select a final value for fdust based on the K–S test results
regions modelled by the MAPPINGS III templates in the galaxy SED                     shown in Fig. 6. In the case of recSF8000, we choose fdust = 0.225
is expected to rise (see Groves et al. 2008, fig. 6). We expect this                 considering its correspondence with the observational data in each
increased contribution to have influence the infrared (IR) colours                   of the chosen scaling relations, despite there being other values of
of the galaxies. To evaluate this effect, we study the colour–colour                 fdust that show better agreement in some of the scaling relations.
relation for the WISE-22, PACS-70, SPIRE-250, and SPIRE-500                          For example, a lower value of fdust shows a better agreement for the
bands as shown in Fig. 5. An increasing value of τ clear leads to an                 WISE-3.4 versus SPIRE-500 scaling relation, or, a higher value of
increasing flux from the cold dust in the molecular cloud surrounding                fdust is better for WISE-3.4 versus GALEX-FUV. A similar argument
the H II region. The contribution of this cool dust can be traced by                 leads us to choosing fdust = 0.14 for recT12. The final choice of the
the variation in the f70 /f22 colour, which is likely to increase with               set of free parameters is shown in Table 3.
an increasing value of τ clear (again, see Groves et al. 2008, fig. 6).                 It is worth noting that the fdust value is lower for the recT12
On the FIR side of the spectrum, we use f250 /f500 colour values to                  recipe than for recSF8000, which is to be expected because
characterize the downwards slope of the dust continuum emission.                     more gas cells are assumed to contain dust, while producing similar
This colour shows sensitivity to the cold dust contents, with smaller                scaling relations. In comparison, De Vis et al. (2019) find a nearly
colour values indicating a flatter slope of the dust emission curve                  constant fdust value for all DustPedia galaxies with a gas fraction
and thus a larger contribution from colder dust. An increasing τ clear               lower than 60 per cent. The exact value is model dependent and
value is likely to lead to a larger amount of cold dust in the ISM,                  falls in the range of 0.092–0.214. Our calibrated fdust values lie in a
manifesting itself as a reduction in the f250 /f500 colour value.                    similar range for Auriga galaxies, with gas fractions ranging from
    Along with the DPD45 data points, Fig. 5 shows the results for                   10 to 40 per cent and a median value of 22 per cent. We point out that
Auriga models with τ clear = 1 and 2 Myr and an extreme value                        there is some discrepancy between DPD45 and the Auriga galaxies in
of 8 Myr. We find a limited impact of changing this parameter.                       the specific star formation rate (sSFR)–M plane, we discuss this in
None of the parameter values lead to a very good agreement with                      Section 5.1.2.

                                                                                                                         MNRAS 506, 5703–5720 (2021)
5710 A. U. Kapoor et al.
Downloaded from https://academic.oup.com/mnras/article/506/4/5703/6324023 by Ghent University user on 16 August 2021
Figure 6. Results of the 2D K–S test as described in Section 3.2 for the two dust allocation recipes. The data points connected by the solid lines are the mean
values, whereas the ones with dashed lines represent the one-sided standard deviation. The legend lists the average d̄ of the mean values for the five relations
considered. We choose the fdust value where the mean values for all five relations are sandwiched between the extremes.
Figure 7. Comparison of broad-band luminosity scaling relations between the DustPedia subsample DPD45 (see Section 3) and SKIRT post-processed Auriga
galaxies using the calibration parameters listed in Table 3. The Auriga sample for both recSF8000 and recT12 consists of 60 points, including an edge-on
and face-on configuration for each of the 30 Auriga galaxies. The rolling median lines use three bins of equal width in L3.4 . The bottom right-hand subpanel
also includes modified blackbody (MBB) relations for three β values. In each case, the MBB temperature runs from 18 to 30 K in the direction of the arrow,
with a step size of 3 K.
MNRAS 506, 5703–5720 (2021)Dust in Milky Way-like simulated galaxies 5711
Table 3. Values of the calibration parameters used for recipes
recSF8000 and recT12.
Dust allocation recipe τ clear (Myr) fdust
recSF8000 1 0.225
recT12 1 0.14
Fig. 7 shows the broad-band scaling relations of the post-processed
Auriga galaxies using the final, calibrated free parameter values.
In comparison with DPD45, there is good overall agreement. We
Downloaded from https://academic.oup.com/mnras/article/506/4/5703/6324023 by Ghent University user on 16 August 2021
do note minor discrepancies in the FUV: Auriga galaxies have, on
average, slightly higher UV luminosities than the observed galaxies.
Furthermore, the colour–colour relation between f350 /f500 and f250 /f350
exhibits very little scatter and shows a lower global dust temperature
in comparison to the galaxies in DPD45. The lack of scatter for the
Auriga galaxies could be caused, at least in part, by our use of a single
dust model with the same dust properties galaxy wide, which is not
very realistic. On the other hand, some of the scatter in the DPD45
galaxies might be the result of observational limitations, which we
did not consider for the Auriga galaxies. We investigated this issue
following the flux-limiting method used by Camps et al. (2016), and Figure 8. An example of the broad-band images of Auriga AU-16 in random
found that, while the scatter in the Auriga data points does increase, orientation (see Section 4) using the calibration defined in Section 3 for
the effect is minor. recSF8000, using 2 × 10¹⁰ photon packets. The images do not have the
The lower cold dust temperatures and flatter FIR slopes seen same colour scale.
for the Auriga galaxies are most likely caused by inadequacies
in the subgrid treatment of the dust geometry on small scales.
Camps et al. (2016, 2018) have noted the limitations of the dust
modelling that are likely responsible for similar discrepancies in
synthetic observations of EAGLE galaxies. Essentially, our dust 2004). For the three inclinations closest to edge-on, corresponding to
modelling does not fully capture the clumpy nature of the dust 90◦ , 84.◦ 26, and 78.◦ 46, we place observers at three different azimuths.
density distribution. The MAPPINGS III templates assume spherical For barred galaxies that are not significantly perturbed, these three
symmetry for modelling the dusty region surrounding the H II core, positions allow views along, perpendicular to, and at an angle of
resulting in isotropic emission. Also, the diffuse dust structure in 45◦ with respect to the bar. For the remaining eight inclinations
our models is tied to the gas structure in the simulations, which (72.◦ 54, 66.◦ 42, 60◦ , 53.◦ 13, 45.◦ 57, 36.◦ 87, 25.◦ 84, and 0◦ ) we use
is governed by a multiphase, ‘effective’ equation of state. The just a single observing position, at an azimuthal angle of 45◦ with
pressure-supported gas is overly smooth on scales of a few hundred respect to the bar. We also consider an additional ‘random’ viewpoint,
parsec (Benı́tez-Llambay et al. 2018; Marinacci et al. 2019). These corresponding to the native orientation of the galaxy in the simulation
approximations lead to an insufficient amount of dust being irradiated box. Altogether, this comes down to 18 observer positions per
by the strong radiation fields present within and around star-forming galaxy.
regions, thus underestimating the temperatures obtained for the At every observer position, we place a UV–submm broad-band
Auriga galaxies. Future efforts may (and hopefully will) improve instrument. This instrument provides us with both the spatially
subgrid models so that they more realistically reflect the turbulent integrated flux and the high-resolution image for each band. We
structure of the dust density distribution in star-forming regions use the same set of 50 broad-band filters as adopted by Camps et al.
and in the diffuse dust. However, that is beyond the scope of this (2018). This set includes most of the commonly used broad-band
work. filters for observations of nearby galaxies, together covering the
entire UV–submm wavelength range. Each individual broad-band
image has a resolution of 50 pc pixel−1 . Based on this pixel scale, the
4 S Y N T H E T I C DATA P RO D U C T S
image field of view falls in one of two categories. If the extraction
The main goal of our SKIRT post-processing of the Auriga galaxies aperture side is smaller than or equal to 102.4 kpc, we use a field of
is to produce and publish a set of synthetic observables. In this view of 102.4 kpc, yielding an image with 2048 × 2048 pixels. If
section, we describe our choice for the number and positions of the extraction aperture is larger, we use a field of view of 153.6 kpc,
the synthetic observers, and the characteristics of the corresponding corresponding to an image with 3072 × 3072 pixels. The pixel scale
synthetic instruments. In principle, SKIRT can be run with an arbitrary of 50 pc pixel−1 is seven times smaller than the softening length
number of observing positions, and with any number of synthetic of collisionless particles in the Auriga simulations (see Table 1).
instruments at each observing position. The only limitation is that This serves as a fair balance between high spatial resolution and the
each additional instrument implies an increase in both simulation run required memory and run time
time and memory consumption. Fig. 8 shows images in four selected broad-bands for AU-16 in
We use 11 uniformly sampled points in cos i, where i is the incli- a random orientation. Fig. 9 shows composite images, combining
nation of the galaxy, i.e. the angle between the angular momentum fluxes from multiple bands, for selected Auriga galaxies.
vector and the direction towards the observer. This choice naturally The broad-band images and spatially integrated SEDs for recT12
leads to a finer grid close to edge-on positions (see e.g. Tuffs et al. for all 18 observers are publicly available at www.auriga.ugent.be.
MNRAS 506, 5703–5720 (2021)5712 A. U. Kapoor et al.
Downloaded from https://academic.oup.com/mnras/article/506/4/5703/6324023 by Ghent University user on 16 August 2021
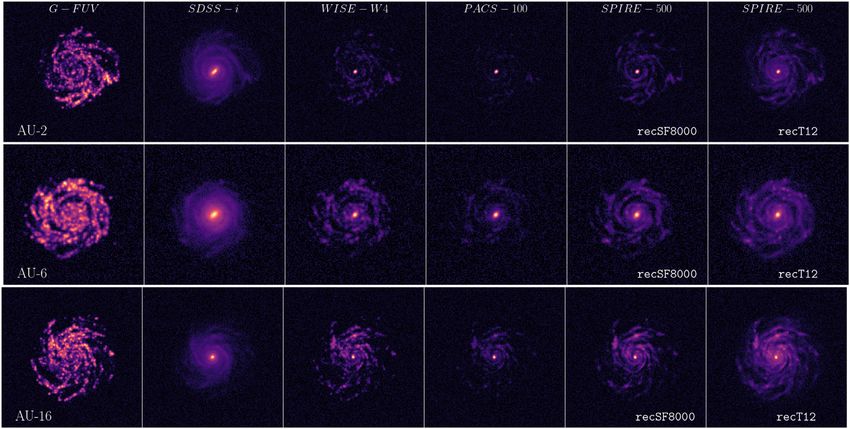
Figure 9. Face-on and edge-on views of selected Auriga galaxies post-processed with the recT12 recipe. Left to right: AU-2, AU-3, AU-6, AU-8, and AU-16.
The images combine an optical view using SDSS-u, -g, -r, and -z fluxes with additional blue for GALEX-FUV flux and red for SPIRE-250 μm flux. The
resulting purple colours indicate star-forming regions, which strongly emit both in the FUV and FIR. The red colours indicate diffuse interstellar dust.
Figure 10. Median Auriga SEDs obtained for each of the two dust allocation
recipes using CIGALE fitting of the broad-band data, along with those for
DPD45. The shaded regions represent 16 per cent–84 per cent range for each
of the data set. The Auriga statistics have been obtained using both face-on
and edge-on configurations for each galaxy.
5 R E S U LT S A N D A N A LY S I S
5.1 Global physical properties and dust scaling relations
In this section, we present the global physical parameters and
dust scaling relations obtained using CIGALE fitting of the broad- Figure 11. Physical properties of the Auriga galaxies obtained using CIGALE
band fluxes for the two adopted dust recipes. As mentioned in broad-band fitting as a function of inclination, for each of the two dust
Section 3, we use the same parameter settings as Bianchi et al. allocation recipes. The error bars represent the standard deviation in the
values obtained for all 30 Auriga galaxies. The corresponding mass-weighted
(2018), Nersesian et al. (2019), and Trčka et al. (2020), except
intrinsic values (calculated directly from the simulation data) are shown as
that we use the Chabrier (2003) IMF. We use these settings error bars on the right-hand side of each panel.
for both the Auriga and the DustPedia galaxies. The SED fit-
ting is carried out at all inclinations for each of the Auriga
5.1.1 Comparison of intrinsic and inferred physical properties
galaxies (see Section 4). We retain the best-fitting values gen-
erated by CIGALE for all analyses in this work. A comparison Fig. 11 shows intrinsic values for a number of physical quantities
between the Auriga input broad-band fluxes and those derived derived directly from the simulation data and the corresponding
by CIGALE is presented in Section A3, showing a very good values inferred using SED fitting as a function of inclination. Both
agreement between the two. The average fitted SEDs are shown dust allocation recipes, on average, show a decline in inferred SFR
in Fig. 10. from face-on to edge-on inclinations. The intrinsic SFR, i.e. the sum
MNRAS 506, 5703–5720 (2021)Dust in Milky Way-like simulated galaxies 5713
Downloaded from https://academic.oup.com/mnras/article/506/4/5703/6324023 by Ghent University user on 16 August 2021
Figure 12. Dust scaling relations obtained with CIGALE fits of the broad-band data for the Auriga galaxies along with those for the DustPedia subsample
DPD45. The rolling median for each sample is shown as a coloured line, with the error bars corresponding to the medians of the errors for the DustPedia sample.
For each Auriga galaxy, values for the face-on and edge-on configurations are shown here.
of the values assigned to the star-forming region particles during data
extraction (see Section 2.3.1), is in very good overall agreement with
the derived values for the face-on configurations. When comparing
the two dust allocation recipes, we find that the face-on SFR values
are similar for both recipes, while the decline in average SFR as a
function of inclination is sharper for recT12 (21 per cent) than for
recSF8000 (16 per cent). This decline is caused by the increased
shrouding of star-forming regions by diffuse dust in the outer regions
of the disc, which is present in larger amounts for recT12. This is
also reflected by the radial extent of the galaxies in FIR, which is
discussed in Section 5.2.2. The inferred stellar mass also shows a
decline with increasing inclination, now steeper for recSF8000
(36 per cent) than for recT12 (23 per cent). Similar to the SFR,
the inferred face-on values show better agreement with the intrinsic
values, calculated by summing the stellar particle masses during data
extraction.
The inferred luminosity-weighted stellar age is compared to the
intrinsic mass-weighted age of the stellar particles in the third panel of
Fig. 11. The inferred ages are slightly lower than the intrinsic values.
The values for recSF8000 are roughly constant with inclination.
In contrast, recT12 shows a decrease from i = 0◦ to i = 45◦ ,
followed by an increase toward edge-on inclinations. The inferred Figure 13. Auriga galaxies occupy the top right-hand corner of the sSFR–
dust mass does not vary significantly with inclination, which is M plane. The Auriga data are using face-on and edge-on configurations for
expected because the emission at IR wavelengths – given the low each galaxy. DPD-All represents the full DustPedia data set (barring a few
dust opacity – is essentially isotropic. The average inferred dust outliers). The data shown here have been obtained using CIGALE SED fitting
masses are very similar for both dust allocation recipes. for the observational (grey and blue) and the two post-processed data sets
(green and orange), while the black markers represent the mass-weighted
values taken directly from the simulation. Some effects of the discretization
of the CIGALE model grid parameters are visible.
5.1.2 Dust scaling relations
Fig. 12 shows a number of dust scaling relations for the face-on and a manifestation of the special position of the Auriga galaxies in
edge-on configurations for each of the Auriga galaxies along with Fig. 13. We note that the simulation SFR and the stellar mass are
those for the DustPedia calibration subset, DPD45. The leftmost well reproduced by the post-processing pipeline, as indicated by
panel shows the relation between specific dust mass and stellar mass. the comparison between the intrinsic values from the simulation
The observed anticorrelation is reproduced for both dust allocation and those obtained using our post-processing pipeline, shown in
recipes. At the same time we find that on average, the Auriga galaxies Fig. 13. Therefore, it appears that the offset between DPD45 and
are slightly more dusty in comparison to the DustPedia subsample Auriga galaxies shown in Fig. 13 is intrinsic to the simulation and
considered. The disagreement between Auriga galaxies and DPD45 not introduced by our post-processing procedures.
can be understood by considering the sSFR–stellar mass (M ) relation The correlation between specific dust mass and sSFR (second
shown in Fig. 13. Auriga galaxies occupy the top right-hand region in panel in the same figure) is very well reproduced by the Auriga
this plane, exhibiting a higher sSFR compared to DustPedia galaxies galaxies. The recT12 dust allocation recipe produces more dusty
of similar stellar mass. The location of the Auriga galaxies in Fig. 13 galaxies at the lower end of the sSFR range, which is expected
is also reflected by the higher gas content of these galaxies compared given that we allocate dust in some non-star-forming gas cells in that
to the observed galaxies of a similar stellar mass (fig. 12, Marinacci case.
et al. 2017). Given that the sSFR and specific dust mass are tightly The third panel in Fig. 12 shows the fraction of energy absorbed
correlated (da Cunha et al. 2010), we deduce that the offset between by dust, i.e. the ratio between the dust luminosity and the bolometric
DPD45 and Auriga galaxies on the Mdust /M –M plane is partially luminosity, fabs = Ldust /Lbolo . This ratio reflects the optical thickness of
MNRAS 506, 5703–5720 (2021)5714 A. U. Kapoor et al.
the galaxy, which depends on the amount, composition, and geometry
of its dust contents. Bianchi et al. (2018) find a broad positive corre-
lation between fabs and the bolometric luminosity for late-type, disc-
dominated, high sSFR, gas-rich galaxies in the DustPedia sample. We
find the same trend for the Auriga galaxies and our DPD45 sample,
with median values of 43.0 per cent, 41.7 per cent, and 40.8 per cent
for recSF800, recT12, and DPD45, respectively.
5.1.3 The IRX–β relation and attenuation curves
We consider the infrared excess (IRX)–UV slope, IRX–β, relation
Downloaded from https://academic.oup.com/mnras/article/506/4/5703/6324023 by Ghent University user on 16 August 2021
(Meurer, Heckman & Calzetti 1999; Overzier et al. 2011) in the
rightmost panel of Fig. 12. Here IRX is the infrared excess defined
as
Ldust
IRX = log , (4)
LFUV
and β is the UV slope given as
log(fNUV /fFUV )
β= − 2. (5)
log(λNUV /λFUV )
We find that while the IRX values are in line with those of the
DustPedia subsample, the UV slopes for the Auriga galaxies are
slightly shallower in comparison to DPD45. The Auriga sample is on
average ≈60 per cent more massive than the DPD45 sample, which
could explain some differences in the IRX–β relation between the
two samples, owing to changes in the dust attenuation curves as a
function of stellar mass (Salim & Boquien 2019) or due to the M –AV
correlation (Salim, Boquien & Lee 2018).
Comparing the two dust allocation recipes for the Auriga galaxies,
we obtain very similar results for both recSF8000 and recT12,
with a low amount of scatter. As described in Salim & Boquien
(2019), the diversity in galaxy attenuation curves drives the scatter
in the IRX–β plane. These authors also show that the slope of the
attenuation curve is tightly correlated with the position on the IRX–β
plane, with attenuation curves with flatter slopes having a higher tilt
in comparison to that found in Overzier et al. (2011). We show the
attenuation curves obtained for the Auriga galaxies in Fig. 14, along Figure 14. Dust attenuation curves obtained for CIGALE fits (top) and directly
with modified Calzetti curves as defined by Boquien et al. (2019). It obtained from the radiative transfer simulations (bottom). The lines represent
is clear that the Auriga galaxies, on average, have flatter attenuation the median values, while the corresponding shaded regions represent the
curves in comparison with those of DPD45. Both dust allocation 16 per cent–84 per cent range for each of the data set. We also show the three
recipes show little diversity in the attenuation curves, which is power-law-modified Calzetti attenuation curves (δ = 0, −0.25, −0.5) without
a UV bump used for CIGALE fits (for more discussion, refer to Boquien et al.
reflected in the lack of scatter in the IRX–β plane. We stress that the
2019; Nersesian et al. 2019). The insets show the histograms of the UV slope
UV bump is not modelled in the CIGALE SED fitting for the Auriga
of the attenuation curves between λ = 0.15 and 0.1 μm. The Auriga statistics
galaxies. This is consistent with the settings used in Boquien et al. have been obtained by using both the face-on and edge-on configurations for
(2019), who chose an attenuation law without a UV bump because the each galaxy.
UV emission in their galaxy sample is covered by just the two GALEX
bands, making it difficult to constrain the UV bump. Narayanan et al. 5.2 Multiwavelength morphological analysis
(2018) have shown the impact of dust geometry on galaxy attenuation
curves. Because the two dust allocation recipes yield a different dust In this section, we compare the morphology of the Auriga galaxies
geometry, some variations in the dust attenuation curves are expected. to observations over the UV–submm range. This serves to evaluate
Interestingly, the attenuation curves obtained with CIGALE fits show the fidelity of the simulated galaxies in general and provides a way
minimal differences between recSF8000 and recT12. to discriminate between the two dust allocation recipes, given that
Fig. 14 also shows the attenuation curves calculated using high these recipes will result in different dust emission and attenuation
spectral resolution SEDs obtained directly from SKIRT. Here we see values as a function of position in the galaxy.
a more diverse range of attenuation curves, as well as a difference in
the attenuation curve slope between the two dust allocation recipes.
5.2.1 Calculation of non-parametric morphological indices
We find that Auriga galaxies post-processed with recT12 exhibit
slightly steeper attenuation curves, on average. It would be interesting The calibration process described in Section 3 is solely based on
to carry out a detailed study of the attenuation curves, both at global comparing spatially integrated broad-band fluxes with observations.
and local scales, and their variation with inclination and with physical As a means of comparing the resolved Auriga images with obser-
properties. vations, we use the STATMORPH package (Rodriguez-Gomez et al.
MNRAS 506, 5703–5720 (2021)You can also read