High-cycle fatigue tests of pretensioned concrete beams - PCI.org

Page created by Julio Robertson
 
CONTINUE READING
High-cycle fatigue tests of pretensioned concrete beams - PCI.org
High-cycle fatigue tests
of pretensioned concrete beams

Jörn Remitz and Martin Empelmann

                                                                                                                                                  P
                                                                                                                                                          recast, pretensioned concrete beams are often used as
                                                                                                                                                          bridge girders for simply supported bridges. Because
                                                                                                                                                          these girders are repeatedly subjected to loads caused
                                                                                                                                                  by high and heavy traffic, fatigue resistance is an important
                                                                                                                                                  part of their design. In general, the fatigue resistance of pre-
                                                                                                                                                  tensioned concrete beams under cyclic loading is influenced
                                                                                                                                                  mainly by the fatigue of the embedded prestressing steel. In
                                                                                                                                                  current specifications and standards, the fatigue verification
                                                                                                                                                  of prestressing steel is either based on S-N curves, which
                                                                                                                                                  describe the relationship between the steel stress range and the
                                                                                                                                                  fatigue life (number of load cycles to failure), or on a fatigue
                                                                                                                                                  endurance limit. For example, the European Committee for
■ This paper compares the predicted fatigue life of                                                                                               Standardization’s Eurocode 21 (EC2) and the fib (Interna-
  prestressed concrete beams based on experimental                                                                                                tional Federation for Structural Concrete) fib Model Code for
  data with currently accepted design methods and                                                                                                 Concrete Structures 20102 (MC2010) use S-N curves and the
  specifications.                                                                                                                                 American Association of State Highway and Transportations
                                                                                                                                                  Officials’ AASHTO LRFD Bridge Design Specifications3 and
■ The experimental data came from a literature review                                                                                             The American Concrete Institute’s Considerations for the
  of previous studies as well as experimental testing                                                                                             Design of Concrete Structures Subjected to Fatigue Loading4
  of nine beams for this study, which included multiple                                                                                           (ACI PRC-215) use fatigue endurance limits. To evaluate the
  concrete and tensile reinforcement configurations.                                                                                              flexural fatigue behavior of pretensioned concrete beams, in-
                                                                                                                                                  ternational fatigue test results of pretensioned concrete beams
■ The study found that current models for predicting                                                                                              under cyclic bending loads were summarized in a database
  fatigue life overestimate the fatigue life of embedded                                                                                          and analyzed with regard to fatigue resistance.
  strands in pretensioned concrete beams, especially at
  low stress ranges.                                                                                                                              Various authors have conducted flexural fatigue tests on
                                                                                                                                                  pretensioned concrete beams with straight bonded strands or
                                                                                                                                                  wires.5–21 For example, Empelmann and Sender22 and Maurer
PCI Journal (ISSN 0887-9672) V. 67, No. 1, January–February 2022.
    PCI Journal is published bimonthly by the Precast/Prestressed Concrete Institute, 8770 W. Bryn Mawr Ave., Suite 1150, Chicago, IL 60631.      et al.23 summarize detailed data of previous fatigue tests and
    Copyright © 2022, Precast/Prestressed Concrete Institute. The Precast/Prestressed Concrete Institute is not responsible for statements made   results. The test results shown in Fig. 1 suggest that the fatigue
    by authors of papers in PCI Journal. Original manuscripts and discussion on published papers are accepted on review in accordance with the
    Precast/Prestressed Concrete Institute’s peer-review process. No payment is offered.

                                                                                                                                                                     PCI Journal | January–February 2022               63
High-cycle fatigue tests of pretensioned concrete beams - PCI.org
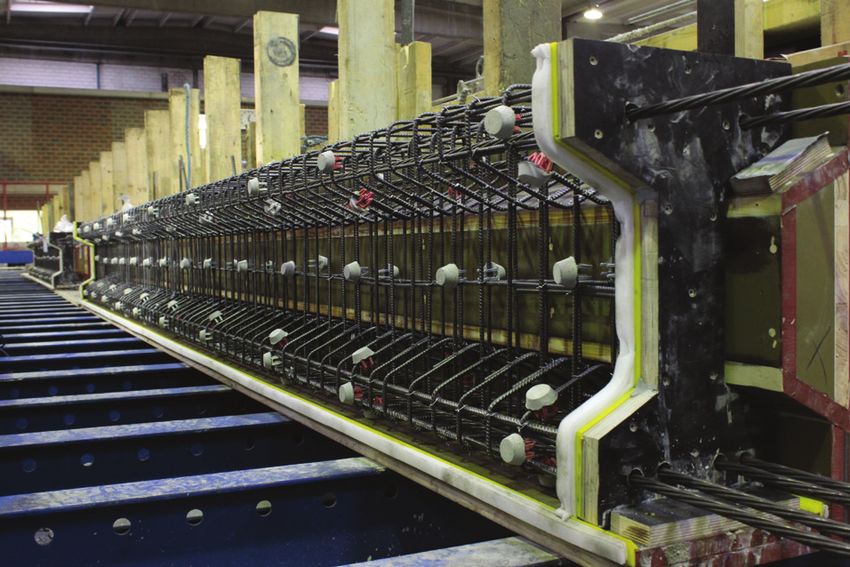
failure mode of such beams depends on the maximum fatigue                                                              strands in beams have a similar fatigue life at stress ranges Δσp
     load level FLLmax, which is defined as the ratio of the maximum                                                        greater than approximately 200 MPa (29 ksi), the fatigue life
     fatigue load or moment Mfat,max and the ultimate capacity Mu:                                                          of strands in beams is, in many cases, significantly lower than
                                                                                                                            that of single strands at stress ranges Δσp less than 200 MPa
     FLLmax = Mfat,max/Mu                                                                                                   and thus lower than the fatigue life according to the normative
                                                                                                                            S-N curve. This reduced fatigue life of embedded strands can be
     Maximum fatigue load levels greater than about 70% of ulti-                                                            explained by the structural parameters of pretensioned concrete
     mate capacity usually result in concrete compression failure                                                           beams (for example, reinforcing and prestressing steel ratio) as
     of pretensioned concrete beams. Fatigue load levels less than                                                          well as specific fatigue processes (for example, fretting effects
     about 70% mainly cause failure of the prestressing steel.                                                              caused by cyclic friction between strands and concrete) (Fig. 3),
                                                                                                                            which have been investigated and discussed in detail in previ-
     Concrete compression failure:                                                                                          ous publications.14,25–27 These influences affect fatigue behav-
                                                                                                                            ior especially at low stress ranges. Moreover, some tests had
     FLLmax ≥ 0.70                                                                                                          prestressed concrete beams that failed well below the endurance
                                                                                                                            limit according to the AASHTO LRFD specifications and ACI
     Prestressing steel failure:                                                                                            PRC-215. To check the high-cycle fatigue of embedded strands
                                                                                                                            in pretensioned concrete beams, this study conducted additional
     FLLmax < 0.70                                                                                                          fatigue tests with steel stress ranges of about 100 MPa (14.5 ksi)
                                                                                                                            and load cycles between 106 and 108.
     Because load levels in bridges are usually below this value,
     the fatigue behavior of prestressing steel is considered to be                                                         Experimental investigation
     critical to the fatigue life of pretensioned concrete beams.
                                                                                                                            Test specimens
     Figure 2 shows the fatigue test results of beams that failed by
     fatigue of the prestressing steel in relation to the steel stress                                                      A total of nine I-beams with a length of 5.00 m (16.4 ft) and a
     range. The results are compared with test results of single                                                            height of 0.50 m (1.64 ft) were tested with strand stress ranges
     strands in air under cyclic tension from Paulson et al.24 as well                                                      of about 100 MPa (14.5 ksi) and varying concretes and tensile
     as with the S-N curve for pretensioned steel according to EC2                                                          reinforcements as the main structural parameters. All beams
     and MC2010 and the fatigue endurance limit according to                                                                were dimensioned to generate flexural fatigue failure caused by
     AASHTO LRFD specifications and ACI PRC-215 (assuming a                                                                 fatigue of the embedded strands. Figure 4 and Table 1 show
     tensile strength for the strands of 1770 MPa [257 ksi, approxi-                                                        the dimensions and structural parameters of the test beams. The
     mately Grade 250]). While the normative S-N curve according                                                            first test (beam B5) was conducted during a previous research
     to EC2 and MC2010 can be assumed as a lower-bound approach                                                             project.28 The other eight beams were produced simultaneously
     for the fatigue life of single strands in air, the S-N curve does                                                      in pairs (B6 and B7, B8 and B9, B10 and B11, and B12 and
     not properly reflect the test results of strands in pretensioned                                                       B13). The beams were made of either normal-strength C50/60
     concrete beams. Even though single strands and embedded                                                                concrete or high-strength C80/95 concrete. Based on concrete

                                                1.00                                                                                                       1000
                                                                                                                                                                                                                           EC2 / MC2010
                                                                                                                                                            800
                                                                                                                                                                                                                           AASHTO LRFD
                                                                                                                                                            600                                                            ACI 215
                                                0.80
                                                                                                                                                            400
            Maximum fatigue load level FLLmax

                                                                                                                                   Stress range Δбp, MPa

                                                0.60                                                                                                        200

                                                0.40                                                                                                        100     Tests on single strands:
                                                                                                                                                             80       Paulson et al. (1983)
                                                                                                                                                             60     Tests on prestressed concrete beamts:
                                                                                                                                                                        Ozell, Ardaman (1956)   Nordby, Venuti (1957)    Ozell, Diniz (1958)
                                                0.20                                                                                                         40         Bate (1962)             Warner, Hulsbos (1964)   Abeles et al. (1974)
                                                                                                                                                                        Rabbat et al. (1979)    Harajli, Naaman (1984)   Overman et al. (1984)
                                                             Concrete failure                                                                                           Bökamp (1990)           Muller, Dux (1992)       Rao, Frantz (1995)
                                                             Prestressing steel failure                                                                                 Hagenberger (2004)      Grunert (2006)
                                                0.00                                                                                                         20
                                                                                                                                                                  104                105               106                107               108
                                                       102         103           104        105           106   107   108
                                                                                Number of load cycles N                                                                                    Number of load cycles N

     Figure 1. Fatigue test results of pretensioned concrete beams                                                          Figure 2. Fatigue test results of pretensioned concrete beams
     based on the fatigue load level. Note: Concrete failure =                                                              based on the stress range in prestressing steel. Note: AASHTO
     results from Venuti (1965) and Slepetz (1968); Prestressing                                                            LRFD = American Association of State Highway and Transpor-
     steel failure = results from Ozell and Ardaman (1956); Nordby                                                          tation Officials’ AASHTO LRFD Bridge Design Specifications;
     and Venuti (1957); Bate (1962); Warner and Hulsbos (1964);                                                             ACI 215 = the American Concrete Institute’s Considerations
     Venuti (1965); Abeles, Brown, and Hu (1974); Rabbat, Kaar,                                                             for the Design of Concrete Structures Subjected to Fatigue
     Russel, and Bruce (1979); Harajli and Naaman (1984); Over-                                                             Loading (ACI PRC-215-92); EC2/MC2010 = European Com-
     man, Breen, and Frank (1984); Muller and Dux (1992); and                                                               mittee for Standardization’s Eurocode 2 or fib Model Code for
     Rao and Frantz (1996).                                                                                                 Concrete Structures 2010. 1 MPa = 0.145 ksi.

64                      PCI Journal | January–February 2022
High-cycle fatigue tests of pretensioned concrete beams - PCI.org
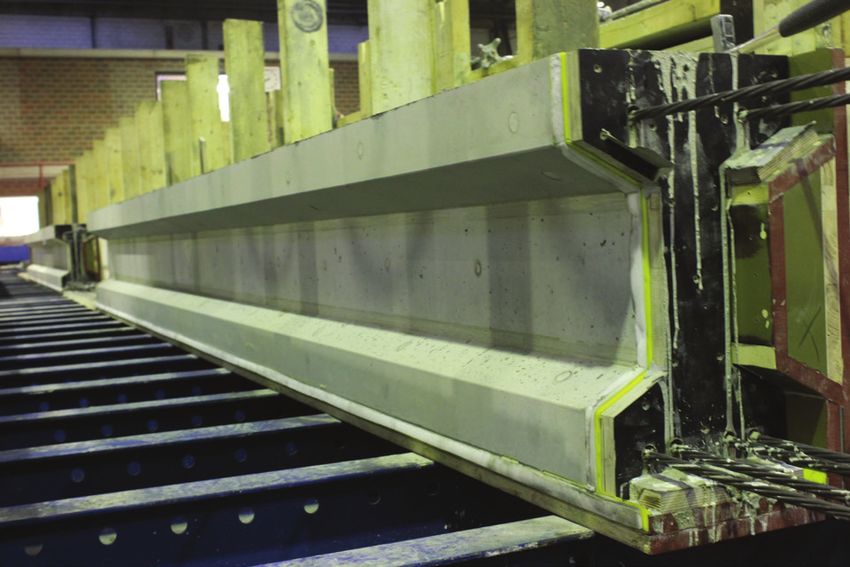
Figure 3. Friction processes at strands in concrete and resulting wire breaks. Source: Remitz and Empelmann (2020).

                                                                  Two 1 2 .5 -m m -d ia m e te r                   Tw o 1 2 .5 - m m - d ia m e te r                Tw o 1 2 .5 - m m - d ia m e te r
                                                                             s tra n d s                                       s tr a n d s                                     s tr a n d s
                                 300
                       5 0 100

                                                     70

                                                                                          E ig h t 6 - m m -                               E ig h t 6 - m m -                               E ig h t 6 - m m -
                                       6 -m m -d i a m e te r
                                                                                          d ia m e te r b a r s                            d ia m e te r b a r s                            d ia m e te r b a r s
                       210
                 500

                                       s ti rru p s s p a c e d
                                             at 75 mm
                       100 40

                                                                                          S ix 6 - m m -                                   Fo u r 1 0 - m m -                               Fo u r 6 - m m -
                                                     50

                                                                                          d ia m e te r b a r s                            d ia m e te r b a r s                            d ia m e te r b a r s

                                 100
                                                                  Fo u r 1 2 .5 -m m - d ia m e te r              Fo u r 1 2 .5 - m m - d ia m e te r              Fo u r 1 2 .5 - m m - d ia m e te r
                                                                               s tra n d s                                     s tr a n d s                                     s tr a n d s
                                 250
                                                                  Be a m B5                                  B e a m B 6 , B 7 , B 1 1 , a nd B 1 3           B e a m B 8 , B 9 , B 1 0 , a nd B 1 2

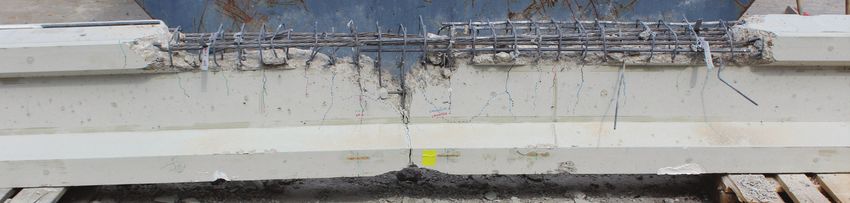
Figure 4. Cross section and reinforcement of the beams and pictures of beam production. Note: All dimensions are in millime-
ters. 1 mm = 0.0394 in.

cylinder testing at the beginning of the fatigue tests, the stress-                                           As equal to 314 mm2 (0.487 in.2). The average yield strength,
strain relationship of the normal- and high-strength concretes                                                tensile strength, and modulus of elasticity of the reinforcement
was determined including average values of the compressive                                                    was determined using tensile tests to be about 555, 600, and
strength fcm,cyl, splitting tensile strength fctm,sp, and modulus of                                          200,000 MPa (80.5, 87,0 and 29,000 ksi), respectively. In all
elasticity Ecm (Table 1). Furthermore, the amount of Grade                                                    beams, four Grade St1660/1860 seven-wire strands (minimum
B500 tensile reinforcement (minimum tensile strength of 500                                                   tensile strength of 1860 MPa [270 ksi]) with a diameter of 12.5
MPa [72 ksi]) was varied, with some beams using four 6 mm                                                     mm (0.5 in.) and an area of prestressing strands Ap of 93 mm2
(0.24 in.) diameter reinforcing bars with a total area of rein-                                               (0.144 in.2) were used in the tensile zone for a total Ap of 372
forcing steel As equal to 113 mm2 (0.175 in.2) and other beams                                                mm2 (0.577 in.2). Two additional strands were arranged in the
using four 10 mm (0.39 in.) diameter reinforcing bars with                                                    top flange to prevent cracking after prestressing. The strands

                                                                                                                                                  PCI Journal | January–February 2022                               65
High-cycle fatigue tests of pretensioned concrete beams - PCI.org
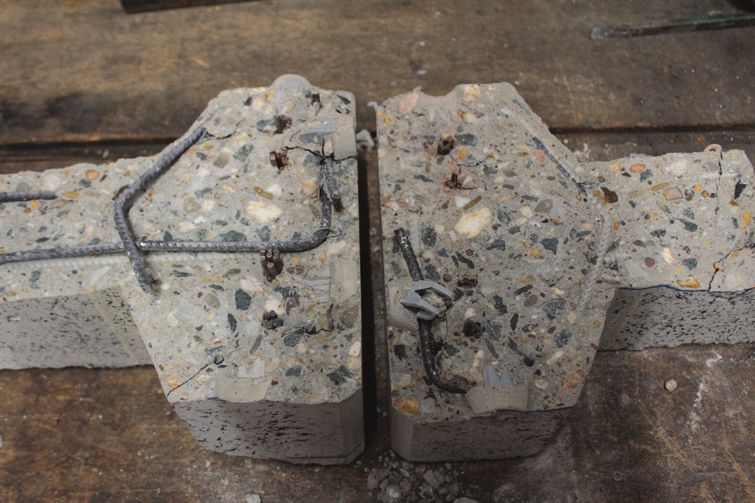
Table 1. Structural parameters of beams

                                                  Concrete                                                                  Prestressing

                                                                 Average                                                            Prestress-
                                                   Average                     Average                                   Initial
                                                                 concrete                       Tensile       Pre-                  ing steel/
                                                   concrete                   concrete                                 prestress-
       Beam                                                      splitting                    reinforce-   stressing                  strand
                                        Age,         com-                      modulus                                 ing steel/
                       Class                                      tensile                        ment       strands                  stress at
                                        days       pressive                   of elastic-                                strand
                                                                 strength                                                             start of
                                                   strength                     ity Ecm,                                 stress
                                                                   fctm,sp,                                                          test σp,t,
                                                  fcm,cyl, MPa                    MPa                                  σp(0), MPa
                                                                    MPa                                                                 MPa

                                                                                                           Four
                                                                                              Six 6 mm
                                                                                                           12.5 mm
     B5*              C80/95              28        102.8           5.0         43,200        diameter                   1080          965
                                                                                                           diameter
                                                                                              bars
                                                                                                           strands

                                                                                                           Four
                                                                                              Four 10
                                                                                                           12.5 mm
     B6               C50/60             135          71.0          4.5         36,000        mm diam-                   1100          896
                                                                                                           diameter
                                                                                              eter bars
                                                                                                           strands

                                                                                                           Four
                                                                                              Four 10
                                                                                                           12.5 mm
     B7               C50/60             218          71.1          4.8         37,800        mm diam-                   1100          887
                                                                                                           diameter
                                                                                              eter bars
                                                                                                           strands

                                                                                                           Four
                                                                                              Four 6
                                                                                                           12.5 mm
     B8               C80/95              28          87.3          3.9         41,800        mm diam-                   1100          974
                                                                                                           diameter
                                                                                              eter bars
                                                                                                           strands

                                                                                                           Four
                                                                                              Four 6
                                                                                                           12.5 mm
     B9.1             C80/95              56          92.4          4.0         41,100        mm diam-                   1100          953
                                                                                                           diameter
                                                                                              eter bars
                                                                                                           strands

                                                                                                           Four
                                                                                              Four 6
                                                                                                           12.5 mm
     B9.2             C80/95              56          92.4          4.0         41,100        mm diam-                   1100          953
                                                                                                           diameter
                                                                                              eter bars
                                                                                                           strands

                                                                                                           Four
                                                                                              Four 6
                                                                                                           12.5 mm
     B10              C80/95             148          90.0          5.1         45,800        mm diam-                   1100          930
                                                                                                           diameter
                                                                                              eter bars
                                                                                                           strands

                                                                                                           Four
                                                                                              Four 10
                                                                                                           12.5 mm
     B11              C80/95             118          88.4          4.8         44,500        mm diam-                   1100          935
                                                                                                           diameter
                                                                                              eter bars
                                                                                                           strands

                                                                                                           Four
                                                                                              Four 6
                                                                                                           12.5 mm
     B12              C50/60              28          59.5          4.3         32,900        mm diam-                   1100          935
                                                                                                           diameter
                                                                                              eter bars
                                                                                                           strands

                                                                                                           Four
                                                                                              Four 10
                                                                                                           12.5 mm
     B13              C50/60              97          69.3          4.3         38,300        mm diam-                   1100          914
                                                                                                           diameter
                                                                                              eter bars
                                                                                                           strands

     Note: 1 MPa = 0.145 ksi; 1 mm = 0.0394 in.
     * Beam B5 was tested during a previous research project (Remitz and Empelmann [2015]).

66          PCI Journal | January–February 2022
High-cycle fatigue tests of pretensioned concrete beams - PCI.org
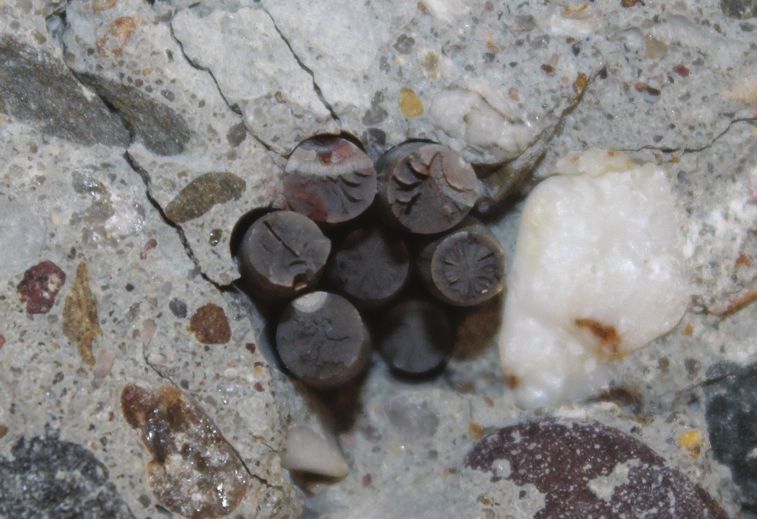
had an average 0.1% yield strength of 1710 MPa (248 ksi), ten-
sile strength of 1920 MPa (278 ksi), and modulus of elasticity
of 198,000 MPa (28,700 ksi).
                                                                                           Steel truss
Beams B6 and B12, constructed with C50/60 concrete, as                                                                                            Load cylinder
well as beams B8 and B11, constructed with C80/95 concrete,
                                                                                    Test beam                                                      Load spreader
differed only in the amount of tensile reinforcing steel and                                                                                       beam

were tested with a similar stress range Δσp of about 100 MPa
[14.5 ksi]. Based on these tests, the influence of varying                                                                                     Roller bearing
amounts of reinforcement was investigated. In addition, beams                                   1.60 m                      1.60 m                  1.60 m
B6 and B11, as well as beams B8 and B12, which had the same                                                                 480
                                                                                                                             . m

reinforcement, were used to examine the influence of different                                           Experimental test setup
types of concrete. Beam B7, with the same configuration as
beam B6, was periodically loaded to an overload of 120% of
the upper cyclic load level to explore the influence of overloads.
Beams B9, B10, and B13 were tested at strand stress ranges
less than 100 MPa to check a possible endurance limit. Beam
B9 withstood the anticipated number of load cycles with no in-
dication of failure (B9.1), so the test was stopped and continued
at an increased cyclic load level (B9.2).

Experimental setup and procedure
                                                                                                     Beam B7 after fatigue failure
Figure 5 shows the test setup, which was designed as a four-
point bending test with a span of 4.80 m (15.75 ft) and load
spacing of 1.60 m (5.25 ft). The test beams were simply sup-
                                                                     Figure 5. Experimental setup. Note: 1 m = 3.281 ft.
ported on roller bearings on both ends to avoid constraining
forces. The single loads were applied by two load cylinders
driven by a hydraulic pulsator.
                                                                                Load
Initially, the beams were loaded twice monotonically to about              1.1·Ffat,min
                                                                                              110 % of maximum cyclic load
                                                                                                                                       Maximum cyclic load
110% of the upper cyclic load level in approximately 10 kN                      Ffat,min

(2.25 kip) load increments (Fig. 6). The initial static loading                     Fcr
was used to crack all beams. Cracks were generated to consid-                   Ffat,min
                                                                                                                                     Minimum cyclic load
er the most unfavorable situation in terms of fretting actions                   Fdec
                                                                                                                     Decompression load

at the strands and because cracking cannot be excluded even
in prestressed concrete beams, for example, due to stresses                                 Static Static Start of cyclic             Cyclic
                                                                                                                                                       Load history /
                                                                                                                                                   N umber of load cycles
above the fatigue loads (overloads). Then, the constant cyclic                             loading loading   loading                 loading
                                                                                            N=1 N=2         N
High-cycle fatigue tests of pretensioned concrete beams - PCI.org
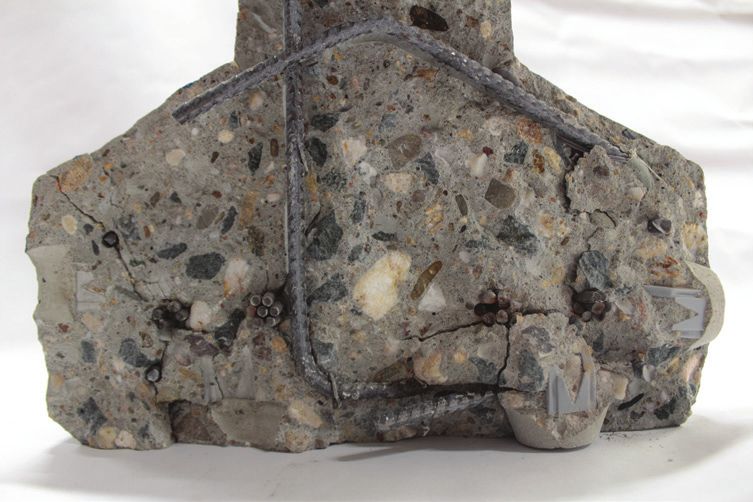
Table 2. Experimental and calculated cracking and decompression loads (per load cylinder) and calculated
      ultimate capacity and resulting fatigue load levels

                      Cracking load                Decompression load            Fatigue load           Calcu-                  Fatigue load level
                                                                                                                    Calcu-
                                                                                                        lated
                                                                  Calcu-      Mini-         Maxi-                    lated
                   Experi-         Calcu-           Experi-                                             stress                  Mini-       Maxi-
      Beam                                                        lated       mum           mum                    ultimate
                   mental          lated            mental                                              range                   mum         mum
                                                                  Fdec,cal,   Ffat,min,     Ffat,max,              capacity
                  Fcr,exp, kN     Fcr,cal, kN      Fdec,exp, kN                                         ∆σp,cal,                FLLmin      FLLmax
                                                                    kN          kN            kN                   Fu,cal, kN
                                                                                                         MPa

      B5              88              85               69           64          94            122         143        212         0.44        0.58

      B6              83              79               58           59          70            100         103        226         0.31        0.44

      B7              80              78               60           58          70            100         105        225         0.31        0.44

      B8              84              84               63           64          70            100          96        202         0.35        0.50

      B9.1            83              83               63           63          80              95         61        200         0.40        0.48

      B9.2            83              83               63           63          80            105         130        200         0.40        0.53

      B10             84              81               56           61          75              95         79        204         0.37        0.47

      B11             75              82               57           61          70            103         102        232         0.30        0.45

      B12             84              83               58           62          70              97         99        190         0.37        0.51

      B13             81              80               54           60          70              95         74        220         0.32        0.43

      Note: 1 kN = 0.225 kip; 1 MPa = 0.145 ksi.

     gauges during the initial static beam B7 test. Figure 7 shows                   tions and crack widths during cyclic loading. In general, the
     the strain distribution considering the dead load at time of                    midspan deflection of the beams increased with increasing
     prestressing Fdead,0, as well as the strain distribution at time                cycles. However, when all tests are compared, a clear and
     of testing under cracking load Fcr and minimum Ffat,min and                     uniform relationship between midspan deflection and the total
     maximum cyclic load level Ffat,max. In addition, Fig. 7 shows                   number of load cycles is not identifiable (Fig. 8), considering
     the experimental and calculated load-strain relationship for                    also that the beam B9 test was stopped before failure after
     concrete, reinforcing steel, and prestressing strands. These dia-               about 22 million load cycles (B9.1) and later continued at an
     grams demonstrate that the calculated concrete and steel strains                increased cyclic load level until fatigue failure (B9.2).
     correlate very well with the measured experimental values.
                                                                                     To better compare the deflection behavior of different tests,
     Besides the stress ranges in the strands, the maximum fatigue                   Fig. 8 shows the beam deflection at maximum fatigue load in
     load level FLLmax was used to evaluate the fatigue life of the                  relation to the deflection of the cracked beam in the second
     beams. The maximum fatigue load level was calculated by the                     cycle δ2 as a function of relative number of load cycles N/Ntot,
     ratio of the maximum cyclic load Ffat,max and the ultimate capac-               where N is the number of load cycles and Ntot is the total
     ity of the beam Fu,cal, which corresponds to the ratio of the max-              number of load cycles until beam failure. As previous studies
     imum fatigue moment to the ultimate moment capacity Mfat,max/                   have shown (for example, Abeles et al.,11 Slepetz,12 Harajli
     Mu,cal. The ultimate capacity was determined by cross-sectional                 and Naaman,14 Overman et al.,15 and Hagenberger19), the de-
     analysis using the experimental stress-strain relationship of con-              flection curve can be divided into the following three typical
     crete, reinforcing steel, and strands from the compressive tests                phases, depending on the relative number of load cycles:
     of concrete cylinders and tensile tests of steel samples. Table 2
     gives the calculated ultimate capacity as well as the resulting                 •    In the early stage of cyclic loading (phase I), deforma-
     minimum fatigue load level FLLmin and maximum fatigue load                           tions increase significantly due to redistribution of con-
     level FLLmax. The calculated maximum fatigue load level of the                       crete and steel stresses caused by cyclic creep and change
     beams was between 43% and 58% of ultimate capacity.                                  of stiffness in concrete.

     Fatigue test results                                                            •    In phase II, deformations gradually increase at a low rate.

     Deflection and cracking                                                         •    In phase III, at about 80% of the number of load cycles
                                                                                          before total failure of the beam, the deflections (and crack
     The flexural behavior of pretensioned concrete beams under                           widths) increase rapidly caused by progressive failure of
     cyclic loading was characterized by an increase in deflec-                           individual wires.

68           PCI Journal | January–February 2022
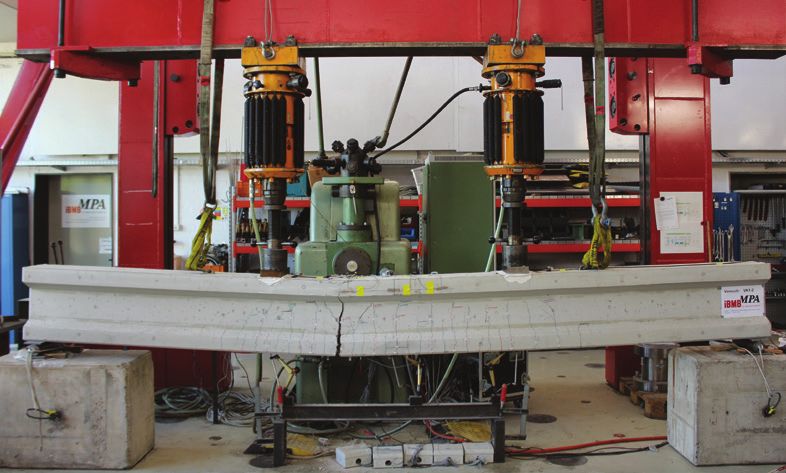
High-cycle fatigue tests of pretensioned concrete beams - PCI.org
0.00
                                                                                  Fdead,0,cal
                                                                                  Fdead,0,exp
                                                                      0.10        Fdead,t,cal

                                         Cross-sectional height, m
                                                                                  Fcr,cal
                                                                                  Fcr,exp
                                                                      0.20        Ffat,min,cal
                                                                                  Ffat,min,exp
                                                                                  Ffat,max,cal
                                                                      0.30
                                                                                  FFfat,max,exp

                                                                      0.40

                                                                      0.50
                                                                         1.0       0.8            0.6          0.4   0.2         0.0     -0.2                      -0.4         -0.6
                                                                                                                       Strains ε, ‰

                  140                                                                                                                           140
                                 Calculated                                                                                                                               Calculated
                                 Strain gauge                                                                                                                             Strain gauge 1
                  120                                                                                                                           120
                                                                                                                                                                          Strain gauge 2
                  100                                                                                                                           100
     Load F, kN

                       80                                                                                                                            80

                                                                                                                                        Load F, kN
                       60                                                                                                                            60

                       40                                                                                                                            40

                       20                                                                                                                            20

                        0                                                                                                                                   0
                        0.0              -0.2                                     -0.4                  -0.6          -0.8                                   4.0                   4.5                 5.0          5.5     6.0
                                                          Concrete strains εc, ‰                                                                                                       Concrete strains εp, ‰
                       140                                                                                                                                  140
                                  Calculated                                                                                                                                 Calculated
                                  Strain gauge 1                                                                                                                             Strain gauge 1
                       120                                                                                                                                  120
                                  Strain gauge 2                                                                                                                             Strain gauge 2

                       100                                                                                                                                  100
                                                                                                                                               Load F, kN

                        80                                                                                                                                   80
          Load F, kN

                        60                                                                                                                                   60

                        40                                                                                                                                   40

                        20                                                                                                                                   20

                         0                                                                                                                                    0
                          -0.5                             0.0                     0.5                   1.0               1.5                                     -0.5                  0.0             0.5          1.0    1.5
                                                                     Concrete strains εs, ‰                                                                                                Concrete strains εs, ‰

Figure 7. Experimental and calculated load-strain relationships of beam B7 for the first load cycle. Note: Fcr,cal = calculated crack-
ing load; Fcr,exp = experimental cracking load; Fdead,t,cal = calculated dead load of the beam at beginning of test including prestress
losses; Fdead,0,cal = calculated dead load of the beam at time of prestressing without time-dependent prestress losses; Fdead,0,exp
= experimental dead load of the beam at time of prestressing without time-dependent prestress losses; Ffat,max,cal = calculated
maximum fatigue/cyclic load; Ffat,max,exp = experimental maximum fatigue/cyclic load; Ffat,min,cal = calculated minimum fatigue/cyclic
load; Ffat,min,exp = experimental minimum fatigue/cyclic load. 1 kN = 0.225 kip; 1 m = 3.281 ft.

The flexural cracks in the middle of the beams were well                                                                               wire breaks, at about 80% of the total number of load cycles,
distributed, with an average crack spacing of about 75 to                                                                              the crack depth propagated quickly into the top flange of the
150 mm (3 to 6 in.), which corresponds to the stirrup spacing                                                                          beams and finally expanded in different directions just before
of 75 mm (3 in.). Figure 9 shows the crack patterns of beams                                                                           total failure (Fig. 10).
B6 and B7. The crack widths on the beams in the first and
second load cycles were less than 0.05 mm (0.002 in.) at min-                                                                          Fatigue failure
imum fatigue load Ffat,min and less than 0.10 mm (0.004 in.) at
maximum fatigue load Ffat,max. The increase in crack width as                                                                          All test specimens failed in the beam area with constant moment
the number of load cycles increases is similar to the three-                                                                           and at a location where a concrete crack propagated into the top
phase deflection behavior. In contrast to the deflection and                                                                           flange of the beams (Fig. 9 and 10). Table 3 gives the number
crack width, the crack depth remained nearly constant or                                                                               of load cycles at which fatigue failure of the first N1, second N2,
propagated at a low rate during cyclic loading. After the first                                                                        and third wire N3 occurred. Failure of the first three wires corre-

                                                                                                                                                                                  PCI Journal | January–February 2022              69
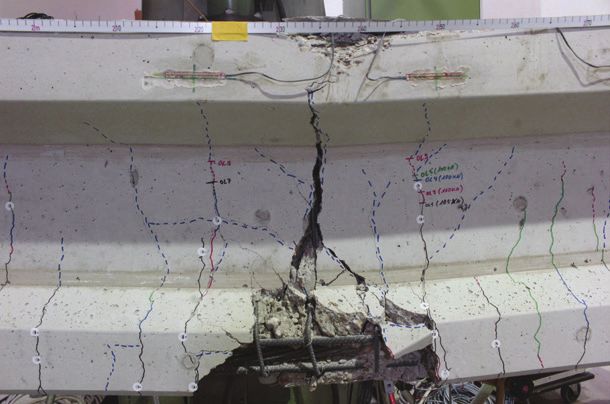
High-cycle fatigue tests of pretensioned concrete beams - PCI.org
20.0

                                    18.0

                                                                                                                   Relative beam deflection δ/δ2
                                    16.0
                                                                                            Still testing
            Beam deflection δ, mm

                                                            First indication
                                    14.0                                                        (B13)

                                                                                                                         (upper load level)
                                                            of failure (B7)
                                    12.0

                                    10.0

                                     8.0

                                     6.0

                                     4.0
                                                              Beam B6          Beam B9.1    Beam B11
                                     2.0                      Beam B7          Beam B9.2    Beam B12
                                                 Beam B5      Beam B8          Beam B10     Beam B13
                                     0.0
                                           0.0               10.0                  20.0                     30.0
                                                           Number of load cycles N, x 106
                                                                                                                                                   Relative number of load cycles N/Ntot

     Figure 8. Deflection behavior of the beams. Note: I = phase I of cyclic loading; II = phase II of cyclic loading; III = phase III of
     cyclic loading; N = number of load cycles; Ntot = total number of load cycles (until beam failure); δ = midspan deflection;
     δ2 = midspan deflection in second load cycle. 1 mm = 0.0394 in.

     Figure 9. Crack pattern of beam B6 and B7 after first cycle and after beam failure. Note: Scale dimensions are in millimeters.
     F = applied load of the beam (per hydraulic cylinder); Ffat,max = maximum fatigue/cyclic load. 1 mm = 0.0394 in.

70          PCI Journal | January–February 2022
High-cycle fatigue tests of pretensioned concrete beams - PCI.org
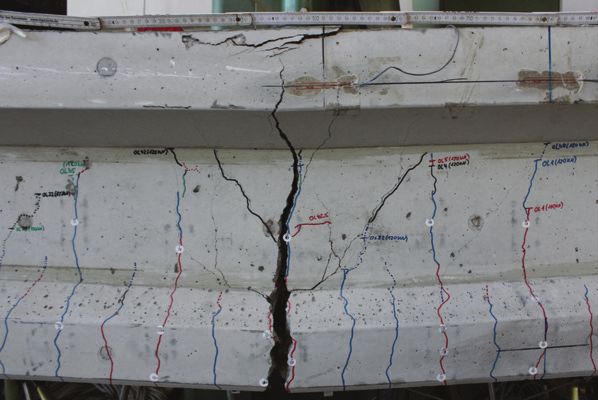
Table 3. Number of load cycles until wire breaks and total beam failure

                                                                              Number of load cycles
         Beam
                                  N1, ×106                   N2, ×106                   N3, ×106                  Ntot, ×106                  N1/Ntot

 B5                                  2.226                     2.731                      3.106                        3.618                    0.62

 B6                                 12.910                    13.082                    14.098                       17.115                     0.75

 B7                                 12.538                    12.732                    16.984                       21.162                     0.59

 B8                                  1.485                     1.487                      1.497                        2.150                    0.69

 B9.1                                n/a                        n/a                        n/a                       22.401*                    n/a

 B9.2                                 1.719                    1.856                      1.987                        2.868                    0.60

 B10                                  1.482                    1.532                      1.809                        4.080                    0.36

 B11                                  1.781                    1.822                      1.833                        3.116                    0.57

 B12                                  4.864                    4.964                      5.684                        6.791                    0.72

 B13                                                       still testing                                             25.000*                    n/a
 Note: Ntot = total number of load cycles until beam failure; N1 = number of load cycles until first wire break; N2 = number of load cycles until second wire
 break; N3 = number of load cycles until third wire break; n/a = not applicable.
 * No indication of damage

sponds to about a 10% reduction of the prestressing steel area.
Table 3 also shows the number of cycles at which total fatigue
failure of the beam occurred. The fatigue failure of the beams
was initiated by the first wire break between 36% and 75% of
the total number of load cycles (Table 3). Up to this point, the
strand and reinforcement stresses and stress ranges indicated by
the strain gauges remained roughly constant. The stresses and
stress ranges in the strands then increased continuously due to
the reduced strand area following each wire break, accelerat-
ing the fatigue damage to the beams. Finally, the total fatigue
failure of the beams occurred after a significant number of wire                                                   Beam B6
breaks. The wire breaks were detected by sudden increases in
crack width and deflection during the monitoring (Fig. 8). After
testing, the strands were uncovered by removing the concrete
(Fig. 11) and the wire breaks caused by fatigue were counted.

Fatigue life

To evaluate the fatigue life of the embedded prestressing
strands, the stress ranges in the strands and the maximum
                                                                                                                   Beam B7
fatigue load level were plotted against the number of cycles
representing the fatigue life. The fatigue life was considered
to be the number of load cycles at the first wire break because
                                                                                   Figure 10. Failed section of beams B6 and B7.
from this point the ultimate capacity under static loading is no
longer ensured.
                                                                                   fatigue load level of 58%, was comparable to previous fatigue
Figure 12 compares the fatigue life of the prestressing strands                    test results from the literature with a similar stress range and
with previous fatigue tests of pretensioned concrete beams                         load level. However, compared with the normative S-N curve
from the literature and the normative S-N curve and endur-                         according to EC2 and MC2010, the fatigue life of beam B5
ance limits, confirming a reduced fatigue life compared with                       was highly overestimated by a factor of about 10.
normative specifications, such as similarly indicated in Fig. 1.
                                                                                   Although beam B7 was loaded with an overload of 120% of
The fatigue life of beam B5, which was loaded with a relative-                     the upper cyclic load level every 0.5 million cycles, the first
ly high strand stress range Δσp of 143 MPa (20.7 ksi) and a                        fatigue failure of a wire occurred at almost the same num-

                                                                                                        PCI Journal | January–February 2022                     71
High-cycle fatigue tests of pretensioned concrete beams - PCI.org
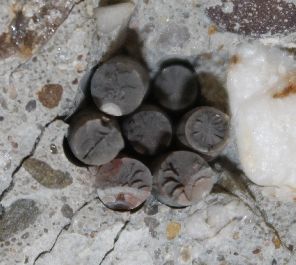
Figure 11. Dismantling of strands in bottom flange of beam B7 after failure.

     ber of load cycles (12.538 × 10⁶) as beam B6 (12.910 × 10⁶)        proportions (for example, the content of fines) influence the
     with the same beam configuration and similar strand stress         fatigue life of pretensioned concrete beams. This correlation
     range. A reduced fatigue life caused by frequent overloads,        has already been observed by the authors in tensile tests on
     mentioned by Harajli and Naaman,14 could not be confirmed.         single strands embedded in concrete as well as fatigue tests on
     Compared with beams B6 and B7, beam B12, which had the             post-tensioned concrete beams (B1 to B4).27,28
     same concrete (C50/60) and a similar strand stress range but
     less tensile reinforcement, failed after a reduced number of       Beams B9 and B10, both constructed using high-strength
     cycles (4.864 × 10⁶). On one hand, the reduced fatigue life        concrete and a small amount of tensile reinforcement (same
     of beam B12 can be explained by a higher fatigue load level        configuration as beam B8), were tested with smaller strand
     (51%) compared with beams B6 and B7 (both 44%) (Fig. 13).          stress ranges Δσp of 61 MPa (8.8 ksi) and 79 MPa (11.5 ksi),
     On the other hand, a smaller amount of tensile reinforcement       respectively. The beam B9 test was stopped after 22.401 × 10⁶
     results in reduced bond characteristics and a higher degrada-      cycles (about 85 days of testing) with no indication of immi-
     tion of bond near concrete cracks. The reduction of fatigue        nent fatigue failure (B9.1). The test was then continued (B9.2)
     life caused by the amount of tensile reinforcement was also        with increased cyclic loading, resulting in a strand stress
     observed in beam B8 (1.485 × 10⁶) and B11 (1.781 × 10⁶),           range Δσp of 130 MPa (18.8 ksi). This caused the beam to fail
     which were constructed using high-strength C80/90 concrete.        after 1.719 × 10⁶ cycles. Although the strand stress range of
                                                                        beam B10 was much smaller, no enhanced fatigue life (1.482
     Although the fatigue life of the high-strength concrete            × 106 cycles) was observed.
     beams (B8 and B11) was much smaller than that of the nor-
     mal-strength concrete beams (B6, B7, and B12), it is assumed       Beam B13, constructed using normal-strength C50/60 con-
     that both the concrete strength and different concrete mixture     crete and more tensile reinforcement, achieved about 25 × 106

72          PCI Journal | January–February 2022
1000                                                                                                                          1.00
                                                                                   EC2 / MC2010
                     800
                                                                                   AASHTO LRFD

                                                                                                              Maximum fatigue load level FFLmax
                     600                                                           ACI 215
                                                                                                                                                  0.80
                             400
     Stress range Δσp, MPa

                             200                                                                                                                  0.60                                                                    B9.1
                                                                                                                                                                                                          B9.2 B5        B12
                                                                                                                                                                                                                       (no failure)
                                                                       B5                                                                                                                                    B8      B6
                                                                 B9.2 B11          B6                                                                                                                        B10 B11 B7
                             100                                 B8              B12 B7                                                           0.40                                                                    B13
                              80                                B10                        B13 (still
                                                                                            testing)                                                                                                                      (still testing)
                              60
                                  Tests on single strands:                             B9.1
                                    Paulson et al. (1983)                                                                                         0.20
                              40                                                    (no failure,                                                                  Concrete failure
                                  Tests on prestressed concrete beams:                                                                                            Prestressing steel failure
                                    Results from literatur (Fig.2)                   see B92).
                                                                                                                                                                  Prestressing steel failure (results from this study)
                                    Results from this study                                                                                       0.00
                              20                                                                                                                              2              3           4            5            6           7             8
                                104              105               106            107               108                                                  10             10          10           10           10          10            10
                                                       Number of load cycles N                                                                                                     Number of load cycles N

Figure 12. Fatigue test results of pretensioned concrete                                                  Figure 13. Fatigue test results of pretensioned concrete
beams based on the stress range in prestressing steel. Note:                                              beams based on the fatigue load level. Note: Concrete failure
AASHTO LRFD = American Association of State Highway and                                                   = results from Venuti (1965) and Slepetz (1968); Prestressing
Transportation Officials’ AASHTO LRFD Bridge Design Speci-                                                steel failure = results from Ozell and Ardaman (1956); Nordby
fications; ACI 215 = the American Concrete Institute’s Consid-                                            and Venuti (1957); Bate (1962); Warner and Hulsbos (1964);
erations for the Design of Concrete Structures Subjected to                                               Venuti (1965); Abeles, Brown, and Hu (1974); Rabbat, Kaar,
Fatigue Loading (ACI PRC-215-92); EC2/MC2010 = European                                                   Russel, and Bruce (1979); Harajli and Naaman (1984); Over-
Committee for Standardization’s Eurocode 2 or fib Model                                                   man, Breen, and Frank (1984); Muller and Dux (1992); and Rao
Code for Concrete Structures 2010. 1 MPa = 0.145 ksi.                                                     and Frantz (1996).

load cycles with no indication of failure. This test will be con-                                             range Δσp of approximately 100 MPa (14.5 ksi). Thus,
tinued up to at least 50 × 106 cycles to determine a possible                                                 the S-N curve according to EC2 and MC2010, as well
fatigue endurance limit.                                                                                      as the endurance limits recommended by the AASHTO
                                                                                                              LRFD specifications and ACI PRC-215, do not thorough-
Overall, the fatigue tests showed that the fatigue life of                                                    ly reflect the presented test results with stress ranges Δσp
pretensioned concrete beams is very sensitive to changes in                                                   of about 100 MPa. As a result, further considerations are
the strand stress range and fatigue load level as well as to                                                  required to derive a feasible fatigue model that provides
the concrete mixture proportions and the amount of tensile                                                    an enhanced and safe estimation of the fatigue life of pre-
reinforcement.                                                                                                tensioned concrete beams at low stress ranges and high
                                                                                                              numbers of load cycles.
Conclusion
                                                                                                          •   With respect to the influence of tensile reinforcement, the
Fatigue tests of pretensioned concrete beams from the liter-                                                  test results suggest that the fatigue life of pretensioned
ature indicate a reduced fatigue life compared with norma-                                                    concrete beams is improved by an increase in tensile
tive fatigue specifications. Because only a small number of                                                   reinforcement.
high-cycle fatigue tests are available, a total of nine additional
fatigue tests were conducted on pretensioned concrete beams                                               •   A significant influence of the concrete mixture propor-
for this study. These tests extended the data set of high-cycle                                               tions on the fatigue life of the beams was observed. This
fatigue test results for pretensioned concrete beams with load                                                is assumed to be more related to the concrete ingredients
levels of about 50% and strand stress ranges Δσp of about                                                     (for example, the content of fines and the type of coarse
100 MPa (14.5 ksi). In addition, the concrete mixture pro-                                                    aggregate) than to the concrete strength.
portions and the amount of tensile reinforcement were varied
within these tests. Based on the presented fatigue tests, the                                             •   The flexural fatigue behavior of pretensioned concrete
following conclusions can be drawn:                                                                           beams can be specified by a typical deflection curve with
                                                                                                              an increasing number of load cycles. The fatigue failure
•   The maximum fatigue load level and the cyclic steel                                                       of the beam is indicated by a rapid increase in deflections
    stress range can be considered the main variables to de-                                                  at about 80% of the number of load cycles before total
    scribe the fatigue failure and fatigue life of pretensioned                                               failure of the beam, which is caused by progressive fail-
    concrete beams.                                                                                           ure of individual wires of the strands.

•   Irrespective of the various influencing parameters, the                                               Acknowledgments
    correlation between steel stress range (or fatigue load
    level) and the fatigue life of pretensioned concrete beams                                            The investigations presented in this paper were conducted at
    continues in the long-life region at least up to a stress                                             the iBMB Division of Concrete Construction of the Tech-

                                                                                                                                                                        PCI Journal | January–February 2022                                      73
nische Universität Braunschweig within a research project         12. Slepetz, J. M. 1968. “Behavior of Rectangular Pre-
     funded by the Deutsche Forschungsgemeinschaft (German                 stressed Concrete Beams Subjected to Heavy Repeated
     Research Foundation) project 351987113. The authors                   Loads.” PhD diss., Duke University, Durham, NC.
     acknowledge this financial support. The authors also grate-
     fully acknowledge Rekers Betonwerk GmbH & Co. KG for              13. Rabbat, B. G., P. H. Kaar, H. G. Russel, R. N. Bruce Jr.
     producing the beams.                                                  1979. “Fatigue Tests of Pretensioned Girders with Blan-
                                                                           keted and Draped Strands.” PCI Journal 24 (4): 88–114.
     References
                                                                       14. Harajli, M. H., and A. E. Naaman. 1984. “Deformation and
     1.   CEN (European Committee for Standardization) Techni-             Cracking of Partially Prestressed Concrete Beams under Stat-
          cal Committee CEN/TC250. 2004. Eurocode 2: Design of             ic and Cyclic Fatigue Loading.” Report UMEE 84R1. Ann
          Concrete Structures – Part 1-1: General Rules and Rules          Arbor, MI: College of Engineering, University of Michigan.
          for Buildings. EN 1992-1-1. Brussels, Belgium: CEN.
                                                                       15. Overman, T. R., J. E. Breen, and K. H. Frank. 1984. Fa-
     2.   fib (Fédération Internationale du Béton). 2013. fib Model        tigue Behavior of Pretensioned Concrete Girders. Report
          Code for Concrete Structures 2010. Berlin, Germany:              300-2F. Austin, TX: Center for Transportation Research,
          Ernst & Sohn.                                                    University of Texas at Austin.

     3.   AASHTO (American Association of State Highway                16. Bökamp, H. 1991. “Ein Beitrag zur Spannstahlermüdung
          and Transportation Officials). 2014. AASHTO LRFD                 unter Reibdauerbeanspruchung bei Teilweiser Vorspan-
          Bridge Design Specifications. 7th ed. Washington, DC:            nung.” PhD diss., RWTH Aachen, Germany.
          AASHTO.
                                                                       17. Muller, J. F., and P. F. Dux. 1992. Fatigue of Prestressed
     4.   ACI (American Concrete Institute) Committee 215. 1992.           Concrete Beams with Inclined Strands. Report CE 135.
          Considerations for the Design of Concrete Structures             Brisbane, Australia: Department of Civil Engineering,
          Subjected to Fatigue Loading. ACI PRC-215-92. Farm-              University of Queensland.
          ington Hills, MI: ACI.
                                                                       18. Rao, C., and G. C. Frantz. 1996. “Fatigue Tests of
     5.   Ozell, A. M., and E. Ardaman. 1956. “Fatigue Tests of            27-Year-Old Prestressed Concrete Bridge Box Beams.”
          Pre-tensioned Prestressed Beams.” Journal of the Ameri-          PCI Journal 41 (5): 74–83.
          can Concrete Institute 53 (10): 413–424.
                                                                       19. Hagenberger, M. J. 2004. “Consideration of Strand
     6.   Nordby, G. M., and W. J. Venuti. 1957. “Fatigue and Stat-        Fatigue for Load Rating Prestressed Concrete Bridges.”
          ic Tests of Steel Strand Prestressed Beams of Expanded           PhD diss., University of Texas at Austin.
          Shale Concrete and Conventional Concrete.” Journal of
          the American Concrete Institute 54 (8): 141–160.             20. Heller, B. E. 2003. “Fatigue Response of Pretensioned Con-
                                                                           crete Beams.” MS thesis, University of Texas at Austin.
     7.   Ozell, A. M., and J. F. Diniz. 1958. “Fatigue Tests of
          Prestressed Concrete Beams Pretensioned with ½ inch          21. Grunert, J. P. 2006. “Zum Tragverhalten von
          Strands.” PCI Journal 3 (1): 79–88.                              Spannbetonfertigteilbalken aus Stahlfaserbeton ohne
                                                                           Betonstahlbewehrung.” PhD diss., TU Braunschweig,
     8.   Bate, S. C. C. 1962. “An Experimental Study of Strand in         Germany.
          Prestressed Concrete Beams under Static and Repeated
          Loading.” Proceedings of the Institution of Civil Engi-      22. Empelmann, M., and C. Sender. 2010. “Sachstandbericht
          neers 23 (4): 625–638.                                           zur Dauerschwingfestigkeit von Spannstählen unter
                                                                           Dynamischer Beanspruchung im Eingebauten Zustand.”
     9.   Warner, R. F., and C. L. Hulsbos. 1964. Probable Fatigue         Bauforschung Band T 3245. Stuttgart: Fraunhofer IRB.
          Life of Prestressed Concrete Beams Part I–IV. Report
          223.24C1-4, Lehigh University, Bethlehem, PA.                23. Maurer, R., G. Heeke, H. Kiziltan, A. Kolodziejczyk, K.
                                                                           Zilch, D. Dunkelberg, and B. Fitik. 2012. “Nachrech-
     10. Venuti, W. J. 1965. “A Statistical Approach to the Analysis       nung von Betonbrücken zur Bewertung der Tragfähigkeit
         of Fatigue Failure of Prestressed Concrete Beams.” Journal        Bestehender Bauwerke.” Report from Bundesanstalt für
         of the American Concrete Institute 62 (11): 1375–1394.            Straßenwesen B89.

     11. Abeles, P. W., E. I. Brown II, and C. H. Hu. 1974. “Fa-       24. Paulson Jr., C., K. H. Frank, and J. E. Breen. 1983. A Fa-
         tigue Resistance of Under-reinforced Prestressed Beams            tigue Study of Prestressing Strand. Report 300-1. Austin,
         Subjected to Different Stress Ranges; Miner’s Hypothe-            TX: Center for Transportation Research, University of
         sis.” ACI Special Publication SP41-11: 237–277.                   Texas at Austin.

74          PCI Journal | January–February 2022
25. Edwards, A. D., and A. Picard. 1972. “Fatigue Character-        Ffat,max,cal = calculated maximum fatigue/cyclic load
    istics of Prestressing Strand.” Proceedings of the Institu-
    tion of Civil Engineers 53 (2): 323–336.                        Ffat,max,exp = experimental maximum fatigue/cyclic load

26. Remitz, J., and M. Empelmann. 2018. “Specific Influenc-         Ffat,min   = minimum fatigue/cyclic load
    es on Fatigue Life of Prestressing Steel.” In Proceedings
    of 12th Japanese German Bridge Symposium, September             Ffat,min,cal = calculated minimum fatigue/cyclic load
    2018, Munich, Germany.
                                                                    Ffat,min,exp = experimental minimum fatigue/cyclic load
27. Remitz, J., and M. Empelmann. 2020. “Cyclic Tensile
    Tests on Prestressing Strands Embedded in Concrete.”            Fu         = ultimate load capacity
    Materials and Structures 53 (3). DOI: 10.1617/s11527
    -020-01484-x.                                                   Fu,cal     = calculated ultimate load capacity

28. Remitz, J., and M. Empelmann. 2015. “Ermüdungsfes-              FFLmax = maximum fatigue load level
    tigkeit von Eingebauten Spanngliedern—Versuche an
    Spannbetonträgern.” Bauingenieur 90 (12): 553–561.              FFLmin = minimum fatigue load level

Notation                                                            Mfat,max = maximum fatigue/cyclic moment

Ap         = cross-sectional area of prestressing strands           Mu         = ultimate moment capacity

As         = cross-sectional area of reinforcing steel              N          = number of load cycles

Ecm        = average concrete modulus of elasticity based on        Ntot       = total number of load cycles until beam failure
            three cylinders tested
                                                                    N1         = number of load cycles until first wire break
fctm,sp    = average concrete splitting tensile strength based on
            three cylinders tested                                  N2         = number of load cycles until second wire break

F          = load applied to the beam per hydraulic cylinder        N3         = number of load cycles until third wire break

Fcr        = cracking load                                          δ          = midspan deflection of the beams

Fcr,cal    = calculated cracking load                               δ2         = midspan deflection of the beams in second load
                                                                                cycle
Fcr,exp    = experimental cracking load
                                                                    Δσp        = cyclic stress range in the prestressing steel/strands
Fdead,t,cal = calculated dead load of the beam at beginning of
             test including prestress losses                        ε          = strain in the beam cross section

Fdead,0    = dead load of the beam at time of prestressing with-    εc         = concrete strain
            out time-dependent prestress losses
                                                                    εp         = strain in the prestressing strands
Fdead,0,cal = calculated dead load of the beam at time of pre-
             stressing without time-dependent prestress losses      εs         = strain in the mild reinforcing steel

Fdead,0,exp = experimental dead load of the beam at time of pre-    σp(0)      = initial prestressing steel/strand stress
             stressing without time-dependent prestress losses
                                                                    σp,t       = prestressing steel/strand stress at start of test (in-
Fdec       = decompression load                                                 cluding prestress losses)

Fdec,cal   = calculated decompression load

Fdec,exp   = experimental decompression load

Ffat,max   = maximum fatigue/cyclic load

                                                                                        PCI Journal | January–February 2022               75
About the authors                                          Abstract

                            Jörn Remitz, MSc, is a research        Pretensioned concrete beams are widely used as bridge
                            assistant in the Institute of          girders for simply supported bridges. Understanding
                            Building Materials, Concrete           the fatigue behavior of such beams is very important
                            Construction and Fire Protection,      for design and construction to prevent fatigue failure.
                            Division of Concrete Construction      The fatigue behavior of pretensioned concrete beams
                            at Technische Universität (TU)         is mainly influenced by the fatigue of the prestressing
                            Braunschweig, Germany.                 strands. The evaluation of previous test results from the
                                                                   literature indicated a reduced fatigue life in the long-life
                             Martin Empelmann, EngD, is a          region compared with current design methods and spec-
                             professor in the Institute of         ifications. Therefore, nine additional high-cycle fatigue
                             Building Materials, Concrete          tests were conducted on pretensioned concrete beams
                             Construction and Fire Protection,     with strand stress ranges of about 100 MPa (14.5 ksi).
                             Division of Concrete Construction     The test results confirmed that current design methods
                             at TU Braunschweig, as well as        and specifications overestimate the fatigue life of em-
                             scientific director of the Civil      bedded strands in pretensioned concrete beams.
        Engineering Materials Testing Institute Braunschweig.
        His research focuses on all aspects of the construction,   https://doi.org/10.15554/pcij67.1-02
        design, maintenance, and retrofit of plain, reinforced,
        and prestressed concrete structures. He is actively        Keywords
        involved in various associations and committees that
        work, for example, on guidelines and standards such as     Cyclic loading, fatigue, prestressed concrete beam,
        Eurocode 2. He is also an independent checking             prestressing strand, S-N curve.
        engineer for structural design.
                                                                   Review policy

                                                                   This paper was reviewed in accordance with the
                                                                   Precast/Prestressed Concrete Institute’s peer-review
                                                                   process.

                                                                   Reader comments

                                                                   Please address any reader comments to PCI Journal
                                                                   editor-in-chief Tom Klemens at tklemens@pci.org or
                                                                   Precast/Prestressed Concrete Institute, c/o PCI Journal,
                                                                   8770 W. Bryn Mawr Ave., Suite 1150, Chicago, IL
                                                                   60631. J

76   PCI Journal | January–February 2022
You can also read