Harbour Region Rate Your Road - March 2021 - NRMA
←
→
Page content transcription
If your browser does not render page correctly, please read the page content below
Harbour Region
Rate Your Road

March 2021
Director’s address
In January 2019, the NRMA launched a report revealing a $2.2 billion council funding
backlog to maintain local roads across NSW. Alongside the report, ‘Rate Your Road’ was
born – a state-wide survey that called on NRMA Members and the community to rate the
condition and safety of their local roads.

Within weeks, Rate Your Road attracted more than 23,000 responses, making it the largest
transport survey in the state’s history. Promising news shortly followed, with the NRMA’s
policies to address the local roads funding backlog adopted by both sides of politics prior
to the 2019 NSW State Election. The NRMA’s policies were designed to elevate the condition
of local roads across the state to at least a satisfactory level to improve safety and assist in
stimulating local economies.

In March 2019, the NSW Government committed $1 billion to help clear the council funding
backlog, replace NSW’s worst timber bridges, and transfer up to 15,000 kilometres of
council-owned regional roads to the state to lessen the financial burden on councils. In May
2020, the Federal Government announced a $1.8 billion commitment to provide a much
needed boost to road infrastructure focusing on regional roads as part of their COVID
recovery package, proving our advocacy has a real impact on Government decision making.

This report presents the results of the Rate Your Road survey for the Harbour Region, which
incorporates 16 Local Government Areas across Sydney’s metropolitan north, the Eastern
Suburbs and the Inner West. Aside from gaining some intriguing insights, the full and public
release of the NRMA’s survey results will assist in guiding government investment.

If you were one of the tens of thousands who participated in Rate Your Road,
thank you for contributing to this outcome.

Tim Trumper
Chair

II   Rate Your Road - Harbour
Table of contents
II                                 6 Harbour Region
Director’s address

III                                7
Contents                           Harbour overview

1                                  8
Introduction                       Centre for Road Safety

2                                  9
About the NRMA                     Rate your Road data collection

3                                  10
Background                         LGA assessment

4                                  12
The Bureau of Infrastructure,      Road specific
Transport and Regional Economics
                                   14
5                                  Other assessments
NRMA regions
                                   15
                                   Local streets

                                   17
                                   Cost of road trauma

III   Rate Your Road - Harbour
Introduction
The NRMA is a national leader in advocating for safer roads and better
transport outcomes for NSW and the ACT. Prior to the 2019 NSW State
Election, the NRMA undertook a comprehensive survey with the public,
asking them to rate roads in their local area against a number of
characteristics including safety, congestion, condition and public transport.

The rate your road survey was developed by the NRMA as a platform for
the public to identify key roads for improvement. The basis of the survey
was that ‘no one knows the roads you use like you do’ and the analysis
may be considered to support all levels of government in guiding
funding commitments.

We want to thank NRMA Members and the public for taking the time to
respond to the survey. The responses we received were extensive and from
right across the state, from Parramatta Road in Sydney, to Billybingbone Road
in Gongolgon, The Snowy River Way in Dalgety, and Dolgelly Road in Garah.

1   Rate Your Road - Harbour
About the NRMA
Better transport infrastructure has been a core focus of the NRMA since 1920
when our founders lobbied for improvements to the condition of Parramatta
Road in Sydney. Independent advocacy was the foundation activity of the
organisation and remains critical to who we are 100 years later.

The NRMA has grown to one of the largest tourism and transport companies
in Australia, representing over 2.6 million Australians principally from NSW and
the ACT. We provide motoring, transport and tourism services to our Members
and the community.

Today, we work with policy makers and industry leaders to advocate for
transport solutions that help solve key pain points such as congestion, access
and affordability and connect people and communities. We’re passionate
about facilitating travel across Australia, recognising the vital role tourism plays
in supporting regional communities.

By working together with all levels of government to deliver integrated
transport and tourism options we can provide for the future growth of our
communities and continue to keep people moving for generations to come.

2   Rate Your Road - Harbour
Background
                                                                                       to relatively hazardous driving conditions, potentially leading to higher crash
                                                                                       rates, leading to property damage, injury and deaths.
Regional and Local roads are the backbone of our transport
                                                                                       In recent years, interstate and intrastate rail freight services have considerably
system, making up approximately 80% of the national road network.
                                                                                       declined due to competitiveness pressures, and with the ongoing drought,
                                                                                       water and fodder are increasingly being moved on regional roads to support
                                                                                       regional areas.

                                                                                       The NRMA’s Funding Local Roads report outlined that in recent years, the funding
In 2019, the NRMA released its Funding Local Roads report which sought to              backlog increased by almost 30% from $1.73 billion in 2014-15, to $2.2 billion in
address and quantify the infrastructure backlog on regional and local roads in         2016-17, with regional Councils responsible for approximately 75% of the backlog.
NSW. Under the national funding system, local government is largely responsible
for funding, upgrading and maintaining thousands of kilometres of roadways.            Whilst this is part of a broader discussion, subsequent reviews into road use have
The local government tends to fund road infrastructure through payable rates,          highlighted that the current road funding environment is unsustainable. Most
and though there are grants from the state and federal government, a significant       recently, Infrastructure Australia has stated that ‘road use, funding and expenditure
shortfall remains.                                                                     is not adequately linked’, highlighting that the current status is ‘inequitable’,
                                                                                       ‘inefficient’, ‘unsustainable’ and ‘not transparent’.
Passenger, and in particular freight traffic, has sharply increased in recent times,
and the damage to the road tends to be exponentially correlated with the volume        The NRMA is committed to advocating on behalf of Members for a fairer funding
and weight of vehicles. The poor condition of roads increases wear and tear to         and financing system for all road and transport users which is sustainable over the
vehicles, increasing servicing costs to the public, and further, poor roads can lead   long term.

3   Rate Your Road - Harbour
Bureau of Infrastructure,
Transport and Regional Economics (BITRE)
0.2 billion tonne kilometres in the ACT. By 2015-16, BITRE estimated NSW had a
The Bureau of Infrastructure, Transport and Regional Economics road freight task of 62.8 billion tonne kilometres, and the ACT, 0.6 billion tonne
(BITRE) provides economic analysis, research and statistics on kilometres in the ACT.
infrastructure, transport and regional development issues to inform
In 2015, it was estimated that NSW had a collective 207,187km of public road, of
government policy development. which 201,397km was paved. Similarly, in 2015, the ACT had 3,448km of roads, of
which 3,348km are paved.
BITRE estimates that road funding in NSW increased from an average of
In the 2018 yearbook produced by BITRE, the following is a summary of the road approximately $6 billion annually during the 2010s, to an average of approximately
network, and the demands we place upon it. $8 billion in recent years. The ACT had road funding of approximately $200 to
$250 million annually across the last 15 years.
In 2017-18, it is estimated that NSW drivers drove a collective 80 billion kilometres,
up from approximately 30 billion kilometres in the early 1970s. ACT drivers drove The headline and per capita fatality rate on the roads has steeply declined since
a collective 4.2 billion kilometres in 2017-18, up from 900 million kilometres in the the 1970s. In 1971, NSW recorded 1,249 road fatalities, decreasing to 392 in 2017.
early 1970s. On a per capita basis, the fatality rate dropped from 26.4 fatalities/100,000
population to five fatalities/100,000 population. Similarly, in the ACT, in 1971, the
The freight task of the roads has grown significantly faster. In the early-to-mid fatality rate was approximately 15 fatalities/100,000 population, decreasing to 2.5
1970s, the freight task was approximately 10 billion tonne kilometres in NSW and fatalities/100,000 population during the 2010s.
4 Rate Your Road - HarbourNRMA regions
NRMA has divided NSW and the ACT into six regions, with each region represented by an NRMA Director.
Region Area Area (km2) Population
Cox Western Sydney and the Blue Mountains 2,718 1,801,605
Harbour Sydney’s metropolitan north, the Eastern Suburbs and the Inner West 599 1,522,003
Hoddle Sydney’s metropolitan south, the Illawarra and the South Coast 18,894 1,221,800
Howe Sydney’s northern suburbs, the Central Coast and the Hunter 30,104 1,385,792
Mann ACT and southern regional and rural NSW 244,497 1,056,053
Northern regional and rural NSW, including Northern Tablelands, North Coast and
Townsend 498,144 858,429
Far North West NSW
5 Rate Your Road - HarbourHarbour 6 Rate Your Road - Harbour
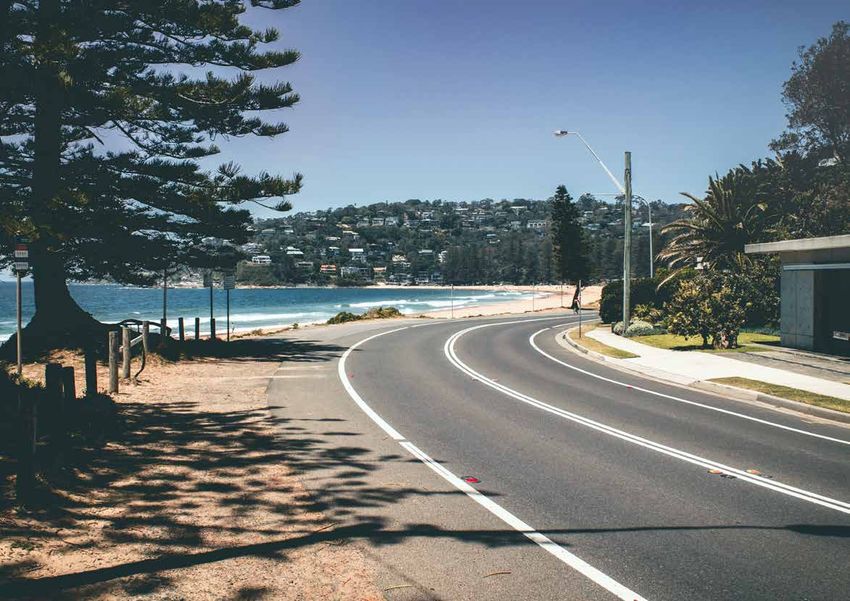
Harbour overview
Burwood                                       Northern Beaches
Canada Bay                                    Randwick
Hunters Hill                                  Ryde
Inner West                                    Strathfield
Ku-ring-gai                                   Sydney
Lane Cove                                     Waverley
Mosman                                        Willoughby
North Sydney                                  Woollahra

Cumulatively, these regions cover an area of 599 square kilometres and are home to 1,522,003
residents as of the 2016 census. For the purposes of this report, a ‘pin’ is a point that a survey
respondent identified for the purposes of completing the survey. More than 5,500 pins were
dropped in the Harbour region.

7   Rate Your Road - Harbour
Centre for Road Safety
Based on the Centre for Road Safety, the following table identifies the number and types of
crashes for the LGAs between the beginning of 2014 and the end of 2018 within the Harbour region:

                                                                                                   2014-2018 Crash History
    LGA
                                                      Fatal Crashes                   Injury Crashes                Non-injury Crashes                   Total Crashes

    Burwood                                                 4                              499                                256                              759
    Canada Bay                                              5                              1,135                              524                             1,664
    Hunters Hill                                            2                              142                                69                               213
    Inner West                                             14                             2,279                              1,150                            3,443
    Ku-ring-gai                                            10                              946                                563                             1,519
    Lane Cove                                               3                              319                                188                              510
    Mosman                                                  1                              208                                128                              337
    North Sydney                                            6                              714                                347                             1,067
    Northern Beaches                                       16                              1,917                              1,111                          3,044
    Randwick                                                9                             1,376                               702                             2,087
    Ryde                                                   10                             1,399                               758                             2,167
    Strathfield                                             7                              739                                441                             1,187
    Sydney                                                 25                             3,759                              1,465                            5,249
    Waverley                                                4                              584                               234                              822
    Willoughby                                              9                              705                                416                             1,130
    Woollahra                                               4                              467                                293                              764

    Total Harbour                                          129                            17,188                             8,645                           25,962

The above table is a staggering reminder of the societal cost of road trauma. In          fatal crash in NSW was $8.586 million, a serious injury resulting in hospitalisation
the Harbour region, 129 people crashes resulted in someone losing their life, and         cost approximately $500,000, a moderate/minor injury crash cost approximately
there were more than 17,100 crashes resulting in injury. The economic cost of these       $90,000 and a property damage only crash cost $10,000. Based on this, in the
accidents is also significant, in 2019, TfNSW estimated that the economic cost of a       Harbour region, the cost of road trauma aggregated to more than $5 billion.

8    Rate Your Road - Harbour
Rate Your Road data collection
Data collection ran for approximately one month between January 2019 and February very poor, poor, average, good or excellent. The survey also allowed people the
2019 with members and the broader public encouraged to participate through NRMA opportunity to input a free text comment. Finally, the survey asked respondents
media and communication channels. The survey was run through a dedicated website to identify their age bracket.
www.rateyourroad.com.au, with more than 23,000 surveys fully completed.
Survey Participation
The survey asked respondents for their residential postcode, the road they wanted In terms of summarising participation in the survey on an area and per capita basis,
to rate, the condition, congestion, safety and public transport on the basis of the following table shows a summary.
Road length Pins/popn/
Population Density Pins/ Pins / 1,000 Pins/100 km
LGA Area km2 (sealed & Pins area
(2016 census) (ppl/km2) 100 km2 population of road
unsealed) X 1,000,000
Burwood 7 36,809 5,258 105.5 24 342.86 0.65 93.14 22.7
Canada Bay 20 88,015 4,400 271.1 290 1,450.00 3.29 164.74 107.0
Hunters Hill 6 13,999 2,333 70.1 27 450.00 1.93 321.45 38.5
Inner West 35 182,063 5,201 570.7 762 2,177.14 4.19 119.58 133.5
Ku-ring-gai 86 118,053 1,372 593.2 1,050 1,220.93 8.89 103.42 177.0
Lane Cove 11 36,051 3,277 139.6 24 218.18 0.67 60.52 17.2
Mosman 9 28,475 3,163 110.3 314 3,488.89 11.03 1,225.25 284.7
North Sydney 11 67,658 6,150 194.4 125 1,136.36 1.85 167.96 64.3
Northern Beaches 254 252,878 995 1,145.2 885 348.43 3.50 13.78 77.3
Randwick 36 140,660 3,907 421.8 148 411.11 1.05 29.23 35.1
Ryde 41 116,302 2,836 455.1 1,134 2,765.85 9.75 237.82 249.2
Strathfield 14 40,312 2,879 142.8 176 1,257.14 4.37 311.85 123.2
Sydney 25 208,374 8,334 494.4 610 2,440.00 2.93 117.10 123.4
Waverley 9 66,812 7,423 147.4 118 1,311.11 1.77 196.24 80.1
Willoughby 23 71,302 3,100 255.6 182 791.30 2.55 110.98 71.2
Woollahra 12 54,240 4,520 160.3 138 1,150.00 2.54 212.02 86.1
Mosman was by far the most strongly represented region by area, population and At the other end of the spectrum the Burwood, Lane Cove, Northern Beaches
a combined population-area metric. Ryde and Strathfield were also regions which and Randwick had fewer pins based on population and area.
had high proportional response rates relative to other LGAs in the region.
9 Rate Your Road - HarbourLGA assessment
To commence with a strategic assessment, the specific location of the pin was located in. This allows a broad comparison between the various local
disregarded and considered only by the Local Government Area that pin was government areas. The results are as follows:
Congestion Public Transport Public Transport
LGA Condition Score Condition Ratings Congestion Score Safety Score Safety Ratings
Ratings Score Rating
Burwood 41.89 23 52.06 21 52.09 21 72.38 21
Canada Bay 52.22 254 41.42 247 44.92 245 62.27 271
Hunters Hill 53.89 22 61.82 23 49.33 20 66.00 22
Inner West 50.60 679 45.17 662 46.94 674 68.80 720
Ku-ring-gai 60.52 988 46.57 929 52.00 952 67.46 1,013
Lane Cove 56.00 20 39.65 21 37.00 21 59.47 20
Mosman 59.58 309 31.80 270 47.81 284 76.33 299
North Sydney 59.52 110 51.21 101 53.06 111 71.87 100
Northern Beaches 52.18 757 47.17 729 47.77 729 68.61 819
Randwick 55.16 122 48.74 120 51.43 122 63.78 126
Ryde 53.51 1,041 39.56 986 48.98 1018 67.10 1,079
Strathfield 52.86 150 37.53 142 52.99 136 56.82 137
Sydney 53.98 534 42.46 496 48.85 494 69.32 535
Waverley 43.52 101 39.84 93 43.98 94 64.98 87
Willoughby 55.51 152 42.72 150 50.61 150 72.03 165
Woollahra 53.55 123 47.88 116 47.87 118 72.39 128
Harbour Region Average 53.59 5,385 44.30 5,106 48.62 5,189 67.65 5,542
Survey Average 48.92 22,580 49.54 21,521 44.92 21,955 - -
10 Rate Your Road - HarbourLGA assessment continued:
Within the Harbour region, Burwood and Waverley tend to have the roads in the North Sydney and Strathfield were reported as having the roads with the greatest
poorest perceived condition. In contrast, Ku-ring-gai, Mosman and North Sydney perceived safety, whilst Lane Cove was reported as having roads which are
tend to have the roads in the best perceived condition. perceived as the least safe.
Hunters Hill has the lowest level of perceived congestion for the Harbour region, Mosman, Burwood, North Sydney, Willoughby and Woollahra reported have the
it is suggested that this may be the case because Hunters Hill is a peninsular, with most satisfaction around public transport services, with Strathfield, Lane Cove and
no impact of through traffic along its length. In contrast, Mosman had the greater Randwick reporting the greatest dissatisfaction with public transport services.
perceived congestion, and it is suggested this can be attributable to limited
transport opportunities through the Spit/Military Road corridor. When comparing the averages, roads in the Harbour region tend to be reported
in a better condition, are more congested, and tend to be perceived safer than
the state average.
11 Rate Your Road - HarbourRoad specific
Whilst a high level assessment is beneficial in that it allows a macro-comparison, the received at least 100 votes, accounting for 56% of votes. Roads which received at
survey allowed individuals to highlight and rate a specific section of road. 12 roads least 25 votes are outlined below (accounting for 70% of votes in the region).
Road Condition Score Congestion Score Safety Score Public Transport Score
Bondi Road 39.73 28.40 36.40 45.45
Botany Road 54.38 34.52 41.37 75.45
Cleveland Street 42.83 22.89 27.37 73.00
Condamine Street 56.76 37.33 48.73 78.67
Eastern Distributor 63.16 27.74 56.88 51.88
Epping Road 53.58 28.63 44.11 61.29
King Street 41.87 35.20 28.46 76.05
Lane Cove Road 53.97 25.45 53.81 60.76
Lyons Road 56.10 37.82 46.36 66.89
Military Road 51.59 31.65 48.67 74.07
Mona Vale Road 55.71 40.97 48.44 60.25
New South Head Road 56.29 41.11 53.56 70.54
Old South Head Road 47.48 37.27 48.83 66.43
Pacific Highway 57.33 35.92 55.11 66.72
Pacific Motorway 56.60 44.00 50.59 54.04
Parramatta Road 47.28 33.61 47.93 70.98
Pennant Hills Road 48.39 26.36 45.57 57.57
Pittwater Road 50.63 37.24 47.95 64.60
Ryde Road 74.66 26.75 64.86 64.67
South Dowling Street 42.77 40.75 42.31 60.59
12 Rate Your Road - HarbourRoad Condition Score Congestion Score Safety Score Public Transport Score
Southern Cross Drive 58.52 31.85 67.69 60.67
Spit Road 56.55 24.00 51.32 63.05
Underwood Road 48.15 22.50 33.60 53.79
Victoria Road 53.69 34.29 55.12 61.81
Wakehurst Parkway 55.05 42.31 50.59 69.02
Warringah Road 43.43 39.23 51.71 58.27
Average of all Harbour Responses 53.59 44.30 48.62 67.65
Of these roads, Ryde Road was reported to have the best condition by far, with In terms of safety, Southern Cross Drive, Ryde Road and the Eastern Distributor
the Eastern Distributor a distant second. Roads reported to be in poor condition were reported to be the safest roads. King Street and Cleveland Street were
included Bondi Road, King Street, Cleveland Street and South Dowling Street. reported to be the least safe roads.
As these tend to be major arterial roads, the congestion scores are broadly poor. Condamine Street, Cleveland Street, Botany Road, King Steet, Military Road and
Relatively speaking, the Pacific Motorway, Wakehurst Parkway and New South Parramatta Road are all streets reported to have good public transport service, in
Head Road were reported to have the least congestion. In contrast, Spit Road, contrast Bondi Road is a distant last.
Underwood Road and Cleveland Street had the worst reported congestion.
These roads tend to be gateways to regions of Sydney with limited other options.
For example, Cleveland Street is one of the few roads which connects the eastern
suburbs, with the inner west.
13 Rate Your Road - HarbourOther assessments
Determining whether there are patterns in the outputs may support the validity of This is reported as a number between 0 and 1. 0 indicates that there is an
the data. The condition, congestion, safety and public transport scores were tested absence of a relationship between data points, whilst a value of 1 means
for their correlation to determine if there are underlying relationships between the that there is a perfect relationship between data points.
outputs. The r-squared was calculated for the relationships between the categories.
Condition Congestion Safety Public Transport
Condition
Congestion 0.0007
Safety 0.559 0.028
Public Transport 0.0017 0.0461 0.0179
There is a moderate correlation between the perceived condition of a road, and condition of the road is perceived as good, its safety will also be perceived as good.
its perceived safety (0.559). In other words, where the condition of the road is In simplistic terms, the 0.559 output means that 55.9% of variation in the perceived
perceived as poor, its safety will also be perceived poorly. In contrast, where the safety of the road can be explained by (attributed to) its condition.
14 Rate Your Road - HarbourLocal streets
It is acknowledged the public did take time to nominate issues that they have with their local streets. As a result of this,
the following table highlights a small random selection of local roads and the qualitative comments which were made with them.
Street Suburb Comment, verbatim
• Many accidents occur at this intersection
Gipps St-Burwood Road Canada Bay • Too many vehicle accidents
• Some bus routes cancelled and people are expected to use on demand public transport
• Joining Centennial Avenue towards Epping Road from Elizabeth Parade is dangerous when mini
vans/small trucks are parked on the left side of Centennial Avenue (adjacent to Stringy bark creek.
These parked vehicles cuts off visibility of vehicles approaching on Centennial Avenue from
Centennial Avenue Chatswood Mowbray road.
• Could be better. Buses to Chatswood have a 15 minute frequency during peak times which is not
sufficient. And these buses are always delayed as they come from Sydney Olympic Park. Would
have been good if there were more buses to Chatswood station.
• Roads surface not sealed smoothly a lot of grooves and bumps on both lanes
Boundary Road Roseville
• Fix the traffic light lapse time for both Archbold road and penthurst street intersection
• Exiting Edgecliffe Ave turning right onto Malabar Road is extremely dangerous due to cars parked
Malabar Road Randwick on the left hand side of Malabar Road making it a blind corner. There is no way of judging
approaching cars until you’re halfway across the intersection
Mitchell St/Murriverie Rd/
North Bondi • Require a Traffic Light or Roundabout here. Also need a Pedestrian crossing.
Hardy St
• Huge volume of traffic in Old Canterbury Road from surrounding highrise large volume of traffic
from Toothill Street trying to get into Old Canterbury Road all of this traffic then funnelled into a
Toothill St-Old Canterbury Road Marrickville
single lane to get under the railway line at the junction with Railway Terrace.
• Railway light rail & bus very close & accessible. Good frequency & reliability.
15 Rate Your Road - HarbourStreet Suburb Comment, verbatim
Highgate St Strathfield • Pot holes everywhere and I have scrapped the underside of my car many times
New Canterbury Road Lewisham • Was going to be resheeted 5 years ago. We are still waiting.
• In morning and afternoon traffic builds up turning right or left into Pittwater road which is also
heavily congested and it can take 10-15min to get onto Pittwater Road
• Both Garden Street and Pittwater Road heavily congested in morning and afternoon
Garden St Pittwater
• The intersection of garden Street with Taiyul road is a accident hotspot and desperately needs a
roundabout to slow down the traffic
• B Line is wonderful
Eastern Road Ku-ring-gai • Cars making right hand turn block the traffic flow
16 Rate Your Road - HarbourCost of road trauma
Costs of road trauma were analysed using Centre for Road Safety data and including (for example), emergency response, hospital care, rehabilitation costs and
Economic Parameter values established by Transport for NSW. crash accident research reporting and loss of economic productivity. The costs are
generally summarised as follows:
The Centre for Road Safety statistics are reported by LGA and cover the 5 years
from the beginning of 2014 to the end of 2018. It is important to be cognisant • Fatal Accident $8,586,767
that these figures represent only the reported crashes, and that over the years, • Serious Injury Accident $574,265
reporting requirements around minor crashes have evolved. • Moderate Injury Accident $97,512
• Minor Injury Accident $89,313
The Economic Parameter Values handbook, aggregates the total economic costs of • Non-Injury Accident (Towaway only) $10,338
different types of road crashes, and includes all costs associated with an accident
Serious Moderate Minor Cost of Trauma Cost of Trauma/ Cost of Trauma/ Cost of trauma/
LGA Deaths Towaway
Injury Injury Injury ($) person ($) km ($) person/km ($)
Burwood 4 111 199 189 256 137,022,056 3,723 1,320,585 35.88
Canada Bay 5 216 453 466 524 258,184,981 2,933 985,663 11.20
Hunters Hill 2 53 51 38 69 56,689,907 4,050 862,757 61.63
Inner West 14 581 901 797 1,150 624,792,176 3,432 1,127,309 6.19
Ku-ring-gai 10 308 311 327 563 328,093,167 2,779 559,954 4.74
Lane Cove 3 93 113 113 188 102,221,715 2,835 790,568 21.93
Mosman 1 54 75 79 128 55,289,468 1,942 506,445 17.79
North Sydney 6 230 231 253 347 232,310,299 3,434 1,348,582 19.93
Northern Beaches 16 631 725 561 1,111 632,035,798 2,499 550,726 2.18
Randwick 9 413 536 427 702 412,112,707 2,930 991,336 7.05
Ryde 10 392 472 535 758 412,623,873 3,548 938,506 8.07
Strathfield 7 136 276 327 441 198,885,130 4,934 1,475,096 36.59
17 Rate Your Road - HarbourSerious Cost of Trauma/ Cost of Trauma/ Cost of trauma/
LGA Deaths Mod Injury Minor Injury Towaway Cost of Trauma ($)
Injury person ($) km ($) person/km ($)
Sydney 25 935 1,458 1,366 1,465 1,030,926,174 4,947 2,259,925 10.85
Waverley 4 176 211 197 234 176,006,493 2,634 1,219,466 18.25
Willoughby 9 214 249 242 416 250,368,455 3,511 1,020,835 14.32
Woollahra 4 146 167 154 293 151,257,498 2,789 953,544 17.58
The headline cost of trauma varies in the Harbour region from over $1 billion in the Adjusting for both population and road network size might be considered a
City of Sydney, to around $55 million in Mosman. There is significant variance of pseudo-equitable outcome. On this specific metric, the Northern Beaches LGA
these due to the population and size of the road network of the respective LGAs. represents the ‘safest’ LGA in the NRMA Harbour region, with a road trauma cost
But on average, the cost of road trauma is approximately $300 million per LGA of $2.18/person/km. In contrast, Hunters Hill is the ‘least safe’ LGA, with a road
(median of $165 million). trauma cost of $61.63/person/km. This means that even after accounting for the
significantly higher population and area of the Northern Beaches LGA, the
When adjusted per head of population, each LGA is in a much narrower band Hunters Hill LGA has nearly 30 times more road trauma on a normalised basis.
of approximately $2,000 to $5,000 per person. It is also important to remember This is despite the Northern Beaches LGA having a headline cost 11 times higher
that LGAs such as Sydney have a significant number of people who are employed than Hunters Hill.
within it, but might not be a resident for the purposes of population.
Some LGAs might have a disproportionately large or small road network, and
a road trauma cost/km may be beneficial. On average, each kilometre of road
network has around $1 million worth of road trauma.
18 Rate Your Road - HarbourAuthorised and Printed by Sam Giddings, 9A York Street Sydney NSW 2000 National Roads and Motorists’ Association Limited ABN 77 000 010 506 is a separate and independent company from Insurance Australia Limited ABN 11 000 016 722 trading as NRMA Insurance. CS-1085
You can also read