Groundwater-surface water interaction revealed by meteorological trends and groundwater fluctuations on stream water level Interazione acque ...
←
→
Page content transcription
If your browser does not render page correctly, please read the page content below
DOI 10.7343/as-2022-574 2022-AS41-574: 19 - 28
journal homepage: https://www.acquesotterranee.net/
Groundwater-surface water interaction revealed by meteorological trends and
groundwater fluctuations on stream water level
Interazione acque sotterranee-acque superficiali rivelate dalle tendenze meteorologiche e dalle
fluttuazioni delle acque sotterranee sul livello di un corso d’acqua
D. Fronzia , M. Gaiolinia, E. Mammolitib, N. Colombania, S. Palpacellia, M. Marcellinia, A. Taziolia
a Department of Material, Environmental Sciences and Urban Planning, Polytechnic University of Marche,
Via Brecce Bianche 12, 60131 Ancona, Italy - email: d.fronzi@staff.univpm.it
b Scuola di Scienze e Tecnologie, Sezione di Geologia, Università di Camerino, via Gentile III da Varano, 62032 Camerino, Italy
Riassunto
L’importanza di considerare acque sotterranee (GW) e superficiali (SW) come due componenti
interconnesse della stessa risorsa è aumentata rapidamente negli ultimi decenni. Al fine di
ARTICLE INFO studiare l’interazione GW-SW in bacini sfruttati da diversi pozzi a scopo idropotabile, è stato
Ricevuto/Received: 10 May 2022 effettuato un monitoraggio continuo integrato delle condizioni idrologiche. Il sottobacino
Accettato/Accepted: 20 June 2022 (14 km2), ubicato nel bacino dell’Aspio (Centro Italia), è drenato da un piccolo corso d’acqua
Pubblicato online/Published online:
(Betelico) ed è caratterizzato dalla presenza di una falda acquifera ospitata nei depositi alluvionali
30 June 2022
(non confinata) ed una ospitata nelle formazioni carbonatiche (semi-confinata). Lo scopo di
Handling Editor:
Marco Pola questo studio è valutare i fattori determinanti del prosciugamento del corso d’acqua avvenuto nel
corso degli ultimi due anni, applicando un’analisi sulla serie temporale di piogge, temperature
Publication note: dell’aria, livello piezometrico e del corso d’acqua e dei tassi di pompaggio dei pozzi. L’andamento
This contribution has been selected delle precipitazioni è stato analizzato su un periodo di 30 anni attraverso il calcolo dello Standard
from Flowpath 2021 congress held in Precipitation Index (SPI) e un’analisi sulla ricorrenza dei fenomeni piovosi intensi, mentre la
Naples 1-3 December 2021
correlazione tra il livello piezometrico e quello del corso d’acqua è stata analizzata per gli ultimi
sei anni. La quota assoluta della falda freatica è stata confrontata con il livello di baseflow del corso
Citation: d’acqua, evidenziando l’interconnessione tra GW-SW nel corso degli anni. Le analisi condotte
Fronzi D, Gaiolini M, Mammoliti E, sul surplus idrico, insieme alla caratterizzazione degli eventi piovosi, supportano l’ipotesi di un
Colombani N, Palpacelli S, Marcellini
M, Tazioli A (2022) Groundwater- prosciugamento del corso d’acqua dovuto principalmente alla diminuzione della ricarica. Questo
surface water interaction revealed by caso di studio sottolinea l’importanza di studiare le interazioni GW-SW in un contesto climatico
meteorological trends and groundwater in continua evoluzione caratterizzato da un andamento delle precipitazioni decrescente (con un
fluctuations on stream water level. aumento di fenomeni intensi), accoppiando sia i vantaggi di un metodo statistico robusto come
Acque Sotterranee - Italian Journal of
Groundwater, 11(2), 19 - 28 l’analisi delle serie temporali che il monitoraggio continuo sul campo.
https://doi.org/10.7343/as-2022-574
Correspondence to:
Abstract
Davide Fronzi The importance of considering groundwater (GW) and surface water (SW) as a single resource of
d.fronzi@staff.univpm.it two interconnected components has rapidly increased during the last decades. To investigate GW-SW
interaction in an aquifer system exploited by several pumping wells, an integrated continuous monitoring
of the hydrological conditions was carried out. The sub-catchment (14 km2), located in the Aspio basin
near Ancona (Central Italy), is drained by a small stream named Betelico, and it is characterised by the
presence of an unconfined alluvial aquifer and a semi-confined limestone aquifer. The aim of this study is
Keywords: aquifer-streams interac-
tion; piezometric level; continuous moni- to evaluate the drivers of stream drying up occurred during the last couple of years. This has been achieved
toring; hydro-meteorological trends. by applying a trend analysis on rainfall, air temperatures, piezometric and stream level, and well pumping
rates. Precipitation trends were analysed over a 30-years period through the calculation of the Standard
Parole chiave: interazione Precipitation Index (SPI) and through heavy rainfall events frequency plots, while the correlation between
acquiferi-corsi d’acqua; livello piezometric stream levels and pumping rate was analysed during the last six years. The groundwater level
piezometrico; monitoraggio in
was compared with the stream baseflow level, highlighting the interconnection between GW-SW over the
continuo; trend idro-meteorologici.
years. The analysis on the water surplus (WS) trend, together with the rainfall events characterisation,
supports the hypothesis of the decrease in recharge rate as the main driver of the stream drying up. This case
Copyright: © 2022 by the authors. study stresses the importance of studying GW-SW interactions in a continuously changing climatic context
License Associazione Acque Sotterranee. characterised by a decreasing precipitation trend, coupling both the advantages of a robust method like trend
This is an open access article
under the CC BY-NC-ND license:
analysis on time series and the field continuous monitoring.
http://creativecommons.org/licenses/by-
nc-nd/4.0/
19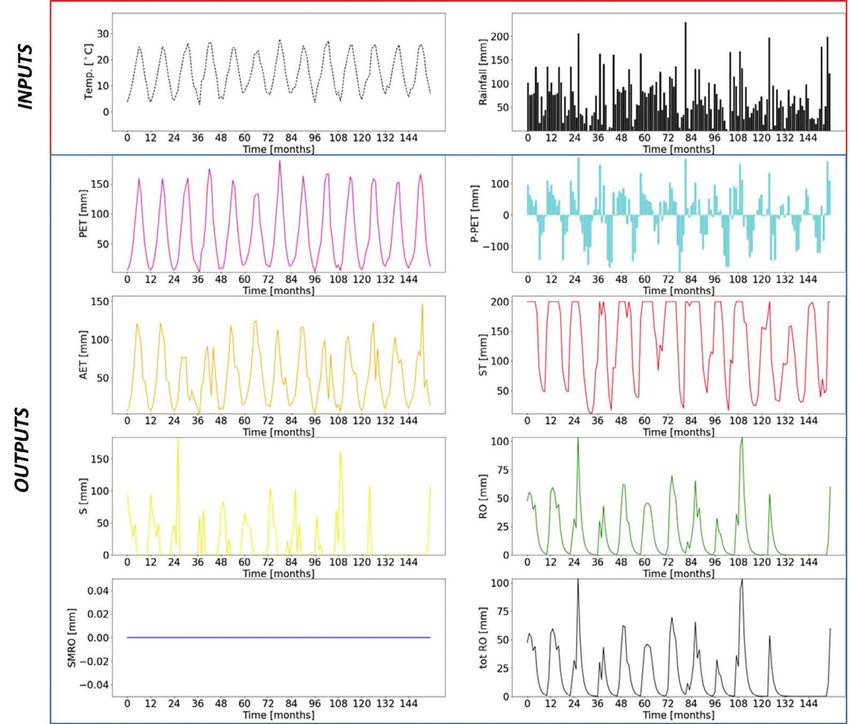
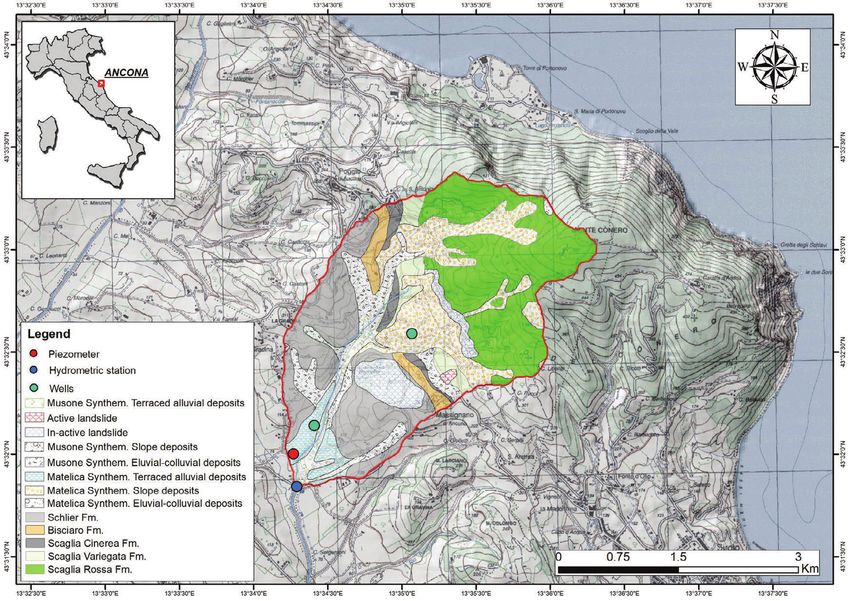
DOI 10.7343/as-2022-574                                                                         Acque Sotterranee - Italian Journal of Groundwater 2022-AS41-574: 19 - 28

Introduction                                                                                  Moreover, GW–SW interactions cover a broad range of
   A large majority of climate models have long projected drier                             hydrogeological and biological processes that are controlled by
summers over much of southern and western Europe under                                      natural and anthropogenic factors at various spatial-temporal
future climate scenarios (Rowell and Jones 2006; Seager et al.                              scales. Indeed, a better knowledge of these processes is vital
2014; Brogli et al. 2019; Grillakis 2019) resulting in intense                              in the protection of groundwater-dependent ecosystems,
surface warming and widespread decrease in precipitation,                                   increasingly required in water resources legislation across the
most intense between 40° and 50°N (Tuel and Eltahir 2021).                                  world (Bertrand et al. 2014).
Such trends threaten to put significant stress on human                                       During the last years, the Betelico stream, draining the
health, water resources, and agriculture (Samaniego et al.                                  small sub-catchment located in the Aspio basin (Central
2018; Lentini et al. 2021).                                                                 Italy), has completely dried up. Considering the agricultural
   Sudden changes in the regime of hydro-meteorological                                     and climatic stresses to the basin (Mussi et al. 2017; Pellegrini
events are the main causes of natural extreme events like                                   2020), this study aims to identify the drivers of the drying
droughts (Turco et al. 2017), fires (Busico et al. 2019; Turco et                           up. An investigation of the interaction between the stream
al., 2019), and floods (Kourgialas and Karatzas 2011; Toosi et                              and the aquifers of the sub-catchment has been conducted,
al. 2019) that could affect many regions of the world.                                      exploiting both the advantages of a trend analysis on climatic
   Understanding the complex behavior of the integrated                                     time series (i.e., rainfall and air temperature) and the field
surface water (SW) – ground water (GW) system is crucial                                    continuous monitoring of stream and groundwater levels.
to the regional water resources management (Rassam et al.
2013), especially in those regions stressed by climate change-                              Data and methods
related issues (Aryal et al. 2019; Bhatta et al. 2019; Pranzini                             Characterisation of the study area
et al. 2020). The interaction between SW and GW plays an                                      The study area comprises a sub-catchment (5 km2) of the
important role in the eco-hydrological system (Sophocleous                                  Aspio watershed, located in the Marche Region (central Italy),
2002; Gilfedder et al. 2012). Surface water diversion,                                      in the proximity of the Conero Mt. regional park (Fig. 1). This
groundwater pumping, and irrigation due to agricultural                                     sub-catchment is drained by the Betelico stream, a tributary
activities could significantly alter the flow regime of both SW                             on the left side of the Aspio river.
and GW (Barlow et al. 2000; McCallum et al. 2013; Shah                                          From a geological standpoint the watershed belongs to
2014; Siebert et al. 2010).                                                                 the Umbria-Marche stratigraphic succession, consisting of

Fig. 1 - Simplified geological map of the study basin with location of the monitoring system.
Fig. 1 - Carta geologica semplificata del bacino di studio con ubicazione dei punti di monitoraggio.

20
Acque Sotterranee - Italian Journal of Groundwater 2022-AS41-574: 19 - 28                                                   DOI 10.7343/as-2022-574

the Mesozoic-Cenozoic limestone sequence, the Miocene-                                  The permeability of the Scaglia Rossa aquifer is regulated
Pleistocene clastic sedimentary formations (Tazioli et al. 2015).                    by the presence of fissures and microkarst. The shallow aquifer
   In particular, the oldest geological formation outcropping                        is responsible for the presence of perennial surface water in the
in the catchment is the Scaglia Rossa Fm. (Upper Cretaceous-                         stream and feeds the watercourse through a diffuse presence of
Middle Eocene). This formation is constituted by stratified                          silty-sands, sandy-silts and gravels with sands layers (Tazioli
mycritic limestones and limestones, marly, flinty limestones                         et al. 2017). Both the aquifers are tapped by the local water
(Mussi et al. 2017). The Scaglia Rossa Fm. gradually increases                       supply company with two well fields, providing water in some
of clayey-marly lithotypes passing to the Scaglia Variegata Fm.                      small towns of the area.
followed by the Scaglia Cinerea Fm. During the Miocene, the                             The climate is temperate and sublittoral, with an average
sedimentation continued with the deposition of the Bisciaro                          precipitation of about 900 mm/y (Mussi et al. 2017) and the
Fm. and the Schlier Fm. These formations (composed of marly                          recharge is entirely due to meteoric precipitation.
and siliceous marly limestone and clayey marls, calcareous                              According to the 2016 Corine Land Cover (CLC), forests
marls, and clays with rare arenaceous intercalations outcrop                         represent 50% of the entire sub-catchment, 49.5% is occupied
extensively on the western side of the Conero Mt. in which                           by agricultural areas, while only 0.5% of the territory is
the Betelico catchment extends. The continental deposition is                        occupied by urban settlements. Those land-use percentages, if
marked by the presence of terraced alluvial deposits, stratified                     they are compared to the ones determined for the entire Aspio
slope debris deposits and landslide deposits. The Holocene is                        watershed (Busico et al., 2020), underlie a peculiar natural
characterised by the deposition of the alluvial and the eluvial-                     condition of the Betelico catchment with respect to the other
colluvial deposits in the flattering areas near the watercourse.                     sub-basins.
From a geo-structural point of view, the Conero Mt. ridge is
an asymmetric anticline with NW-SE axis direction and NE                             Field monitoring and data analysis
vergence (Nanni et al. 1997; Scisciani 2009; Cello and Tonti                           The catchment was monitored over the last six years, and
2014; Sarti and Coltorti 2014). The anticline is characterised                       both the piezometric and hydrometric levels were continuously
by almost vertical strata on the eastern side (Adriatic Sea side),                   measured (Fig. 1) employing hydrometric pressure transducer
while on the western side (in which the Betelico catchment                           (CTD diver Eijkelkamp, accuracy ± 0.5 cmH2O and resolution
extends) the strata display an inclination of less than 25°.                         0.2 cmH2O) compensated by atmospheric pressure and using
   The hydrogeological setting of the basin consists of two                          an acquisition time interval of 10 minutes then grouped at
main aquifers (Fig.2): the first one is hosted in the Scaglia                        daily scale (mean daily value). Unfortunately, starting from
Rossa Fm., and the second one is hosted in the continental                           December 2020, the pressure transducer located in the
Quaternary deposits. The main aquifer is represented by the                          piezometer was vandalised and broken, so throughout the
Scaglia Rossa Fm., and it is confined on the bottom by the                           year 2021, the piezometric level was periodically manually
marly units of the Marne a Fucoidi Fm., (not outcropping in                          measured.
the sub-basin). Moving westward from the top of Conero Mt.,                            Hourly rainfall and mean monthly temperature data were
the Scaglia Rossa Fm. is semi-confined by the hydrogeological                        downloaded from the official hydro-pluviometric database
complex composed by the Scaglia Variegata, Scaglia Cinerea,                          managed by the Regione Marche Civil Protection Agency,
Bisciaro and Schlier formations, which constitute a single                           available at the SIRMIP-online portal (https://www.regione.
aquiclude at the top. This hydrogeological complex, together                         marche.it/Regione-Utile/Protezione-Civile/Console-Servizi-
with Pliocene and Pleistocene clay layers, hydraulically                             Protezione-Civile/SIRMIP-online). The rainfall data have
separates the Scaglia Rossa aquifer from the shallow                                 been retrieved for a period >30 years starting from January
Quaternary aquifer.                                                                  1991 to December 2021, while the temperature data have
                                                                                     been downloaded from January 2008 to December 2021 (no
                                                                                     missing data are present). Both the rainfall and temperature
                                                                                     are recorded in a station located 9 km (air-distance) from
                                                                                     the Betelico basin, having the catchment mean elevation
                                                                                     (~125 m a.s.l.). Starting from the year 2015 until 2020, the
                                                                                     mean monthly well pumping rates provided by the water
                                                                                     supply company are available. The retrieved data were analysed
                                                                                     and processed through “WaterbalANce” (Mammoliti et al.
Fig. 2 - Schematic hydrogeological section of the study area. Legend: 1- Maiolica    2021), a WebApp that exploits the “Thornthwaite-Mather”
geological formation; 2- Marne a Fucoidi aquiclude; 3- Scaglia Rossa aquifer;        method to compute the water balance (Steenhuis and Molen
4- Scaglia Variegata, Scaglia Cinerea, Bisciaro and Schlier aquiclude; 5- Alluvial
aquifer; 6- Fault 7- Piezometric level. Modified from Mussi et al., 2017.            1986). The App allows to gain the mean annual water surplus
                                                                                     (WS) to be compared to the mean annual well abstraction and
Fig. 2 - Sezione idrogeologica schematica dell’area di studio. Legenda: 1-           establish the percentage of influence of wells abstraction over
Formazione della Maiolica; 2- Acquiclude delle Marne a Fucoidi; 3- Acquifero         the total water surplus. To run the app, latitude (LAT), soil
della Scaglia Rossa; 4- Acquiclude della Scaglia Variegata, Scaglia Cinerea,
Bisciaro e Schlier; 5- Acquifero Alluvionale; 6- Faglia 7- Livello piezometrico.
                                                                                     moisture storage capacity (SM), snowfall rainfall temperature
Modificata a partire da Mussi et al., 2017.                                          threshold (SRT), and runoff coefficient (beta) were set based

                                                                                                                                                 21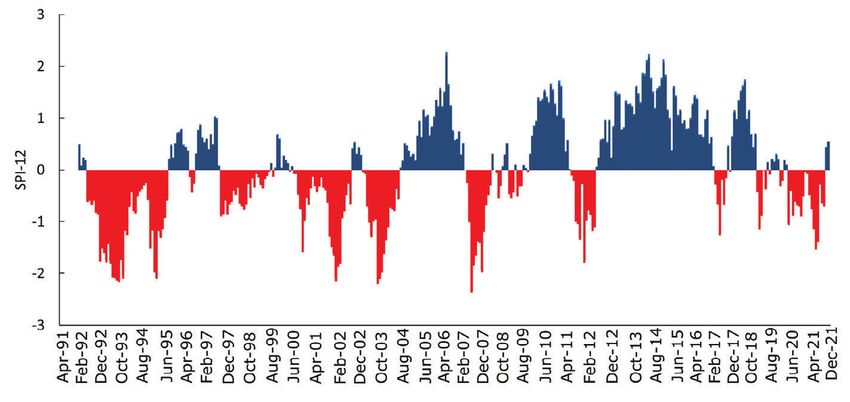
DOI 10.7343/as-2022-574                                                                Acque Sotterranee - Italian Journal of Groundwater 2022-AS41-574: 19 - 28

on the geographical, geological, and climatic features of the                      then transformed into a normal distribution. For a given data
area (Tazioli et al. 2015; Tazioli et al. 2017; Mussi et al. 2017).                time series of precipitation xi as x1, x2 …xn, the SPI is defined
Respectively, LAT = 43 degrees, the SM = 200 mm, SRT =                             by the equation:
−1 °C and beta = 50% were used. The SM value was selected                                                      xi − x
according to the soil moisture reference tables published by                       		 SPI =
Thornthwaite and Mather, (1957), used by (Mammoliti et al.
                                                                                                                      σx
2021) for similar areas of central Italy. The beta coefficient                     where: x is the arithmetic mean of rainfall and σx is the
(50%) is fixed for all the simulation period, hence it represents                  standard deviation.
a conservative situation for the runoff estimation over the                           For a defined timescale, SPI equal to 0 implies that there
entire water surplus.                                                              is no deviation from the mean. Positive values of SPI indicate
  To determine the occurrence of particularly dry or wet                           wet periods, while negative values indicate dry periods (Valigi
conditions and their relations with the piezometric and                            et al. 2020; Fronzi et al. 2020).
hydrometric levels, the Standardized Precipitation Index (SPI)                        The severity of drought events increases when the SPI is
(McKee et al. 1993) was calculated considering the 31 years                        continuously negative and reaches an intensity of at least
interval (1991-2021).                                                              −1; “n” varying from 1 to 24 months is the best statistical
  The SPI is the number of standard deviations that the                            range of application (Guttman 1998, 1999). Therefore, the
observed value would deviate from the long-term mean, for a                        rainfall data were elaborated using a 12-month time scale
normally distributed random variable. In the SPI computation,                      (SPI-12) since it better represents long-term precipitation
cumulated rainfalls over different time scales (1, 2, 3 … n                        patterns (Fiorillo and Guadagno 2010; World Meteorological
months) were fitted to a gamma probability distribution and                        Organization 2012).

Fig. 3 - Graphical example of WaterbalANce inputs: Temp.= mean monthly temperature (°C), Rainfall = monthly precipitation (mm) and outputs: PET = monthly potential
evapotranspiration (mm), delta = P-PET (mm), AET = monthly actual evapotranspiration (mm), ST = monthly soil moisture (mm), S = monthly water surplus (mm),
RO = monthly runoff (mm), SMRO = monthly snow melt runoff (mm), TOT RO = monthly total runoff (mm).
Fig. 3 - Esempio grafico degli inputs di WaterbalANce: Temp.= temperatura media mensile (°C), Rainfall = precipitazione mensile (mm) e
outputs: PET = evapotraspirazione potenziale mensile (mm), delta = P-PET (mm), AET = evapotraspirazione reale mensile (mm), ST = ritenzione
idrica del suolo mensile (mm), S = eccedenza idrica mensile (mm), RO = deflusso superficiale mensile (mm), SMRO = deflusso superficiale mensile
dovuto allo scioglimento nivale (mm), TOT RO = deflusso superficiale mensile totale (mm).

22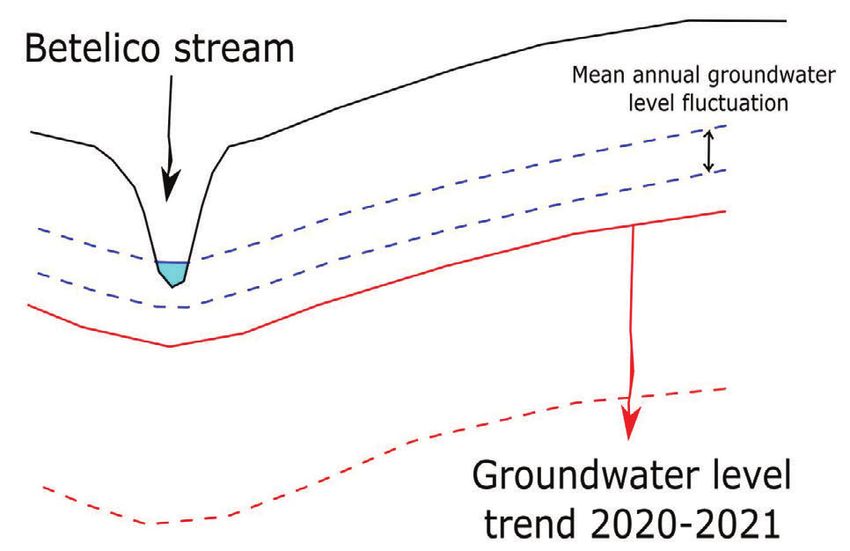
Acque Sotterranee - Italian Journal of Groundwater 2022-AS41-574: 19 - 28 DOI 10.7343/as-2022-574
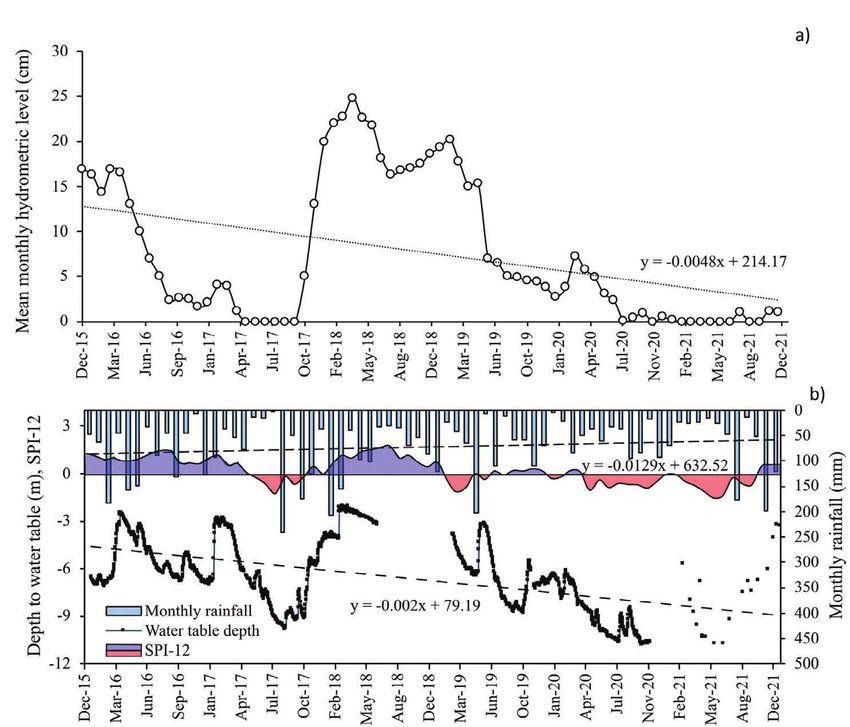
Moreover, in order to integrate the SPI results, the The monitoring results of the Betelico stream perfectly
precipitation events were classified over the same interval reflect field observations with the hydrometric level
accounting for the number of storm events (i.e., the number approaching zero centimeters in August 2020 without rising
of events with a precipitation rate larger than 10 mm/ again, except in October 2020, August, November, and
hour) that have occurred every year (Ryu et al. 2021). Such December 2021, although remaining below 1 centimeter. The
analysis informs about the tendency of rainfall events to general decreasing trend in the hydrometric level is evidenced
foster recharge or runoff and therefore it better exemplifies by the linear regression (black dotted line in Fig. 4a) with a
the WS component. In fact, wetter conditions do not always slight negative angular coefficient.
produce more groundwater recharge (Taylor et al. 2013) that At the same time, the water table level, even though
is governed by precipitation characteristics such as duration, characterised by sudden fluctuations strictly related to the
magnitude and intensity (Tashie et al. 2016). In particular, rainfall events (Fig. 4b), shows a decrease trend during the
heavy-intensity rainfall events over short time periods cause last six years, reaching the most negative value (-10 m below
groundwater recharge reduction, while promoting runoff the ground level) in November 2020.
generation (Freeze and Cherry 1979; Dourte et al. 2012; The rainfall regime of the catchment is outlined by a
Huang et al. 2012). seasonal oscillation, with the maximum monthly rainfall
Additionally, the linear trend for the meteo-climatic usually recorded during the spring and autumn seasons
data (i.e., monthly rainfall and temperature data), the (frequently exceeding 100 mm), and the minimum monthly
hydrometric and piezometric level has been obtained by the rainfall recorded during the summer and winter periods. The
linear regression over the analyzed time span and plotted mean annual rainfall value (considering the period 2016-
together with the SPI-12 values. Eventually, the mean annual 2021) is about 855 mm.
wells pumping rate and WS have been plotted together to The whole analysed time period is marked by a slight
identify the key driver of the groundwater level drop and the decrease in the precipitation trend, and the year 2020 is
subsequent drying of the Betelico stream. characterised by an annual precipitation amount of 508 mm,
which is significantly lower than the previous years (Tab. 1).
Results and discussions In addition, in the same year, months showing a cumulative
The mean monthly hydrometric level (Fig.4a) and the rainfall of more than 100 mm have not been observed.
piezometric level, together with the monthly rainfall (Fig.4b) Eventually, Table 1 reports the annual rainfall percentage
have been plotted over the six years of observation time (2016- deviation to the mean value recorded for the same period.
2021). It can be noticed that the last two years are characterised by
Fig. 4 - (a) Mean monthly hydrometric
level for the Betelico stream with the
linear trend (black dotted line); (b)
Daily piezometric level recorded in the
alluvial aquifer together with SPI- 12
values and monthly rainfall over the six
years observation time (2016-2021).
The linear trends for the piezometric level
and the rainfall are represented by the
dashed-dotted line and the dashed line
respectively.
Fig. 4 - (a) Livello idrometrico
medio mensile del Betelico con il suo
trend lineare (linea a puntini neri);
(b) Livello piezometrico giornaliero
registrato nell’acquifero alluvionale,
valori di SPI-12 e piogge mensili
sul periodo di osservazione (2016-
2021). I trend lineari per il livello
piezometrico e le piogge sono
rispettivamente rappresentati dalla
linea a puntini e trattini e dalla linea
a trattini.
23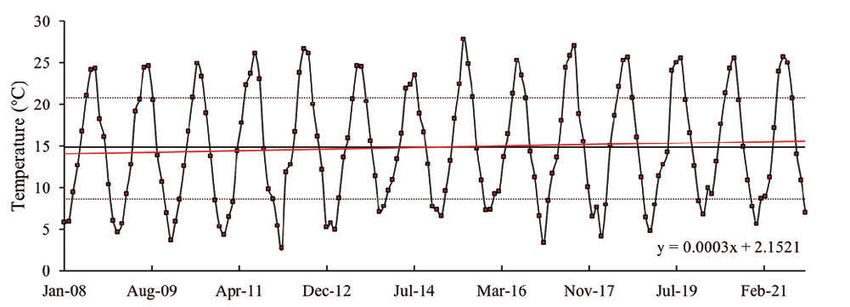
DOI 10.7343/as-2022-574                                                                Acque Sotterranee - Italian Journal of Groundwater 2022-AS41-574: 19 - 28

-41% and -7% respectively of total annual rainfall concerning
the mean precipitation amount in the area. Additionally, the
year 2021 is characterised by approximately 221 mm out of
797 mm related to storm events (precipitation rate > 10 mm
per hour), thus accounting for approximately 28% of the total
annual rainfall. In contrast, the year 2020 is marked by a
lower percentage of rainfall related to extreme events (5%),
however the entire year is significantly less rainy than the                       Fig. 5 - Mean monthly air temperature for the study area with its trend (red line),
annual average rainfall of the whole analysed period.                              mean value for the whole period (black solid line) with 25th and 75th percentiles (black
  The mean value of air temperature is about 15°C while                            dotted lines).
the minimum annual values are recorded during December,                            Fig. 5 - Temperatura dell’aria media mensile per l’area di studio con la sua
                                                                                   tendenza (linea rossa), temperatura media dell’intero intervallo (linea nera
                                                                                   continua) con 25-esimo e 75-esimo percentile (linee nere punteggiate).
Tab. 1 - Annual rainfall from 2016 to 2021 with percentage deviation to the mean
annual value and extreme events rainfall amount with percentage over the annual
rainfall recorded for the same period.                                             dataset (Zuo et al. 2021). However, the comparison with the
                                                                                   piezometric and the hydrometric levels can only be performed
Tab. 1 - Pioggia annuale dal 2016 al 2021 con deviazione rispetto al valore
medio dello stesso periodo espressa in percentuale e cumulata totale di pioggia    for the last 6 years (see Fig. 4b). Specifically, in this time
relativa agli eventi estremi con percentuale rispetto alla pioggia nello stesso    span, 14 months are moderately wet (1.0≤SPI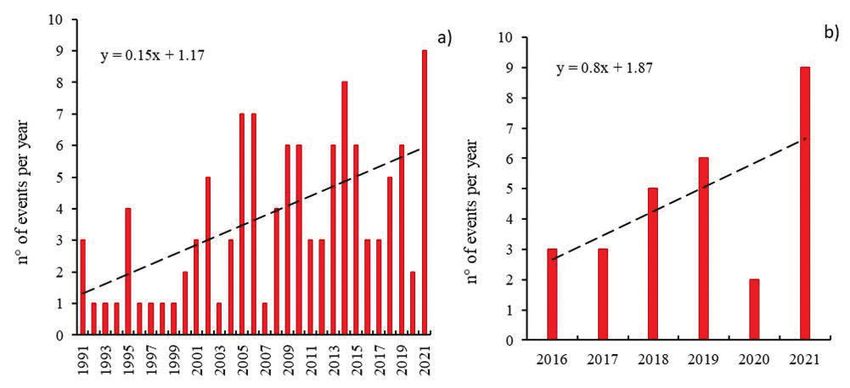
Acque Sotterranee - Italian Journal of Groundwater 2022-AS41-574: 19 - 28                                                  DOI 10.7343/as-2022-574

                                                                                                                  Fig. 7 - Storm rainfall events distribution
                                                                                                                  with linear trend (black dashed line) (a)
                                                                                                                  over the 31 years observation time (1991-
                                                                                                                  2021); (b) magnification for the last six
                                                                                                                  years (2016-2021).
                                                                                                                  Fig. 7 - Distribuzione degli eventi di
                                                                                                                  pioggia temporaleschi con la sua tendenza
                                                                                                                  (linea nera tratteggiata) (a) sull’intero
                                                                                                                  periodo di analisi (1991-2021); (b)
                                                                                                                  ingrandimento per gli ultimi sei anni
                                                                                                                  (2016-2021).

comparison was only possible in the last few years, the SPI                        cannot be attributed to the local water supply company. In
calculation alone doesn’t seem to be illustrative concerning                       particular, the mean annual wells groundwater abstraction
the analysed phenomenon.                                                           from the carbonate aquifer didn’t show significant variation
   Because of this, a frequency analysis of rainfall storm events                  and remained constant at a value of about 1 L/s; while the
was conducted for the whole period 1991-2021. The analysis                         abstraction from the alluvial aquifer has even dropped down
of storm events (Fig. 7) clearly shows an increasing trend                         from a value of almost 3 L/s in 2015 to just over 1 L/s recorded
over the last thirty years, which results to appear even more                      in 2020. Just as example the conversion of the 3 L/s pumping
intense focusing on the last six years observation time (2016-                     rate into mm/y over the Betelico basin (5 km2) leads to a value
2021). During the ‘90s most of the years were characterised                        of 3.8 mm/y, which is almost negligible. Despite these simple
by a storm event per year with some exceptions (1991, 1995),                       considerations, the position of the pumping wells (Fig. 1) and
while it is not unusual to exceed 3 or 4 storm events per year                     their depression cone could have contributed to diminish
from the early 2000’s till today. Specifically, focusing on the                    the Betelico baseflow in 2020, but to quantify such effects a
magnification for the last six years (Fig. 7b), the increasing                     tridimensional numerical flow model should be implemented.
trend is sharp with the only exception of the year 2020, which                        However, analysing the WS it is possible to notice a negative
however, was characterised by low precipitation in general as                      trend over the six years observation time (Fig. 8). The year
shown in Table 1 (508.2 mm).                                                       2020, during which the Betelico stream completely dried out
   The mean annual WS has been plotted together with the                           (Fig. 4a), is characterised by an almost zero WS. This was
mean annual groundwater abstraction from wells over the                            due to low precipitation during that year with a percentage
observation time (Fig. 8), to investigate the most important                       deviation with respect to the mean value for the observation
drivers of the groundwater drawdown and the consequent                             period of - 41 % (Tab. 1). In 2021 the WS increased to more
stream drying-off.                                                                 than 100 mm but was not enough to restore the normal
   Since figure 8 doesn’t show a mean annual wells abstraction                     function of the stream, which still nowadays results to be
increasing trend, the depletion of the groundwater resources                       dried. It is likely that the 9 storm events occurred during
                                                                                   that year (Fig. 7b), accounting for 28% of the 797 mm total
                                                                                   precipitation (Tab. 1) fostered the runoff rather than meteoric
                                                                                   recharge. It must be stressed that this hypothesis is not
                                                                                   accounted in the WaterbalANce WebApp in which the runoff
                                                                                   coefficient (beta) was constantly set for the whole analysed
                                                                                   period to 50%. This aspect should be further investigated.
                                                                                      The mean annual groundwater fluctuations strictly related
                                                                                   to rainfall events that characterised the basin has always
                                                                                   leaded the Betelico stream to periodical dry conditions
                                                                                   (summer 2017 in Fig. 4), without persisting over the entire
                                                                                   year (Fig. 9). This aspect is also highlighted by the SPI-12
                                                                                   analysis, in which a value of -1.27 was observed in August
                                                                                   2017, followed by an increasing trend that lasted until August
                                                                                   2018 (Fig. 6).
                                                                                      Indeed, the whole year 2018 was characterised by a
Fig. 8 - Mean annual wells groundwater abstraction and annual water surplus (WS)   piezometric level increase, reaching the minimum depth
over the simulation time.                                                          below the ground level, with a consequent surface water
Fig. 8 - Emungimento medio annuale ad opera dei pozzi ed eccedenza idrica          recorded in the stream showing a strong GW-SW relationship.
annuale (WS) nel periodo di simulazione.

                                                                                                                                                       25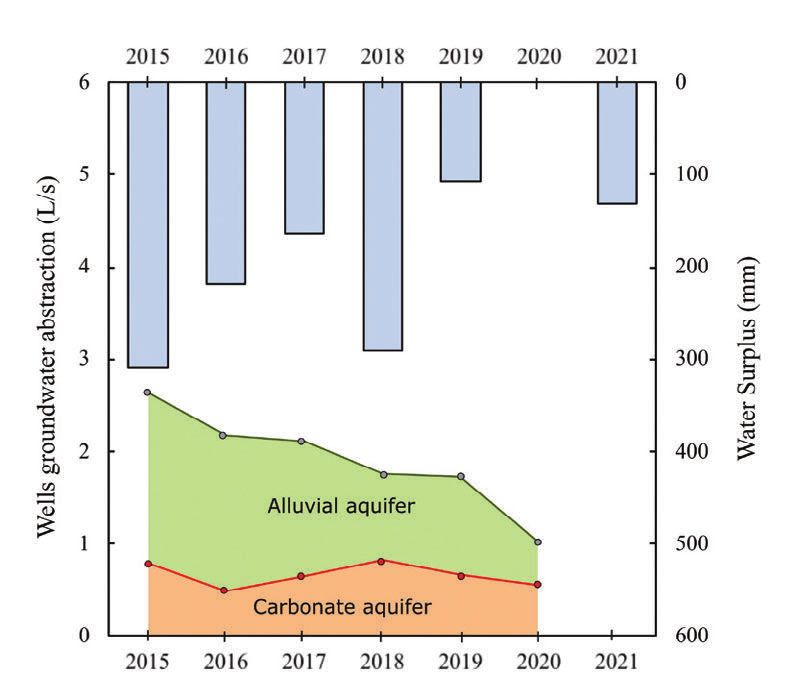
DOI 10.7343/as-2022-574                                                                Acque Sotterranee - Italian Journal of Groundwater 2022-AS41-574: 19 - 28

                                                                                    Acknowledgement
                                                                                    The authors thank the editor and the anonymous reviewers. Figures
                                                                                    are made with the freely available Inkscape software v.1.1.2 (https://
                                                                                    inkscape.org/release/inkscape-1.1.2/),   WaterbalANce       WebApp
                                                                                    (https://thornwaterbalance.com/), and Excel-Microsoft365®.
                                                                                    Competing interest
                                                                                    The authors declare no competing interest.
                                                                                    Author contributions
                                                                                    Collection of data, Fronzi D., Palpacelli S., Marcellini M.; data
                                                                                    processing, Fronzi D., Gaiolini M.; interpretation of results, Fronzi
                                                                                    D., Gaiolini M., Mammoliti E., Colombani N.; writing-original draft
                                                                                    preparation, Fronzi D., Gaiolini M.; writing-review and editing,
                                                                                    Fronzi D., Gaiolini M., Mammoliti E., Colombani N, Tazioli A.;
                                                                                    visualisation, Fronzi D.; supervision, Tazioli A. All authors have read
Fig. 9 - Schematic conceptual model of GW-SW interaction for the Betelico stream.   and agreed to the published version of the manuscript.
Fig. 9 - Modello concettuale schematico di interazione acque sotterranee-acque
superficiali per il Torrente Betelico.
                                                                                    Additional information
                                                                                    Supplementary information is available for this paper at
                                                                                    https://doi.org/10.7343/as-2022-574
   The lack of the meteoric recharge, due to a combined effect                      Reprint and permission information are available writing to
of decreasing precipitation trend and increase in storm rainfall                    acquesotterranee@anipapozzi.it
events, was identified as the key driver of the groundwater                         Publisher’s note Associazione Acque Sotterranee remains neutral with regard
                                                                                    to jurisdictional claims in published maps and institutional affiliations.
drawdown for the last two years (2020-2021).
   The alluvial aquifer piezometric level reached the
most negative value in November 2020 (Fig. 4) without
intercepting the stream bed anymore and feeding its baseflow.
As a consequence, the persisting streams’ dry condition
results to be stressful for the related ecosystem belonging to
the Regional Natural Park of Conero Mt.

Conclusions
  According to the results of this research, a hydrological
trend which may compromise the groundwater dependent
ecosystem in the future years has been highlighted (Hanson
et al. 2021).
  The drivers that led to the water resource depletion were
investigated by analysing the meteo-climatic trends, together
with continuous field monitoring of the main hydrogeological
parameters. Lack of meteoric recharge was identified as
the key factor in the drying up of the watercourse, leading
to an excessive groundwater level drop, which has been
demonstrated to not be strictly related to the pumping wells
present in the area.
  Moreover, this case study stresses the importance of
studying GW-SW interactions in a continuously changing
meteo-climatic context characterised by a decreasing
precipitation trend.
  As further development the field monitoring system was
recently implemented by installing new rain gauges, lysimeters
and tensiometers to better investigate the recharge processes
occurring in the area by using isotopic hydrology techniques.
These new datasets will open a window to the development of
numerical hydrogeological models improving the calibration
procedure and enhancing detailed hydrogeological balance
calculations.

26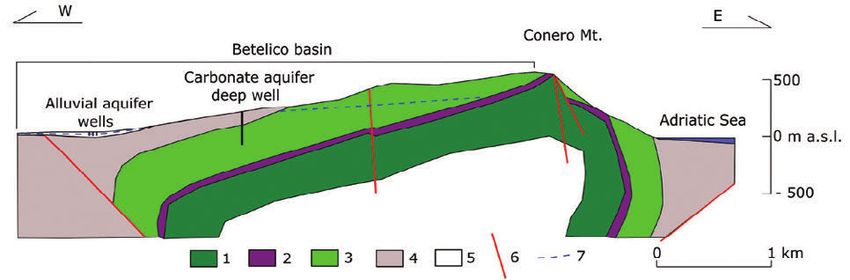
Acque Sotterranee - Italian Journal of Groundwater 2022-AS41-574: 19 - 28 DOI 10.7343/as-2022-574
REFERENCES Huang J, Wu PT, XN Zhao (2012) Effects of rainfall intensity,
underlying surface and slope gradient on soil infiltration under
Aryal A, Shrestha S, Babel MS (2019) Quantifying the sources of
simulated rainfall experiments, Catena, 104, 93–102. DOI:
uncertainty in an ensemble of hydrological climate-impact
10.1016/j.catena.2012.10.013
projections. Theoretical and Applied Climatology, 135(1), 193-209.
Kourgialas NN, Karatzas GP (2011) Flood management and a GIS
DOI: 10.1007/s00704-017-2359-3
modelling method to assess flood-hazard areas-a case study.
Barlow PM, DeSimone LA, Moench AF (2000) Aquifer response to
Hydrological Sciences Journal–Journal des Sciences Hydrologiques,
stream-stage and recharge variations. II. Convolution method
56(2), 212-225. DOI: 10.1080/02626667.2011.555836
and applications. Journal of Hydrology, 230(3-4), 211-229. DOI:
Lentini A, De Caterini G, Cima E, Manni R, Della Ventura G (2021)
10.1016/S0022-1694(00)00176-1
Resilience to climate change: adaptation strategies for the water
Bertrand G, Siergieiev D, Ala-Aho P, Rossi P M (2014) Environmental
supply system of Formia and Gaeta (Province of Latina, Central
tracers and indicators bringing together groundwater, surface water
Italy). Acque Sotterranee-Italian Journal of Groundwater, 10(4), 35-
and groundwater-dependent ecosystems: importance of scale in
46. DOI: 10.7343/as-2021-527
choosing relevant tools. Environmental earth sciences, 72(3), 813-
Mammoliti E, Fronzi D, Mancini A, Valigi D, Tazioli A (2021)
827. DOI: 10.1007/s12665-013-3005-8
WaterbalANce, a WebApp for Thornthwaite–Mather Water
Bhatta B, Shrestha S, Shrestha PK, Talchabhadel R (2019) Evaluation
Balance Computation: Comparison of Applications in Two European
and application of a SWAT model to assess the climate change
Watersheds. Hydrology, 8(1), 34. DOI: 10.3390/hydrology8010034
impact on the hydrology of the Himalayan River Basin. Catena,
McCallum AM, Andersen MS, Giambastiani BM, Kelly BF, Ian
181, 104082. DOI: 10.1016/j.catena.2019.104082
Acworth R (2013) River–aquifer interactions in a semi-arid
Brogli R, Sørland SL, Kröner N, Schär C (2019) Causes of future
environment stressed by groundwater abstraction. Hydrological
Mediterranean precipitation decline depend on the season.
Processes, 27(7), 1072-1085. DOI: 10.1002/hyp.9229
Environmental Research Letters, 14(11), 114017. DOI:
McKee TB, Doesken NJ, Kleist J (1993, January). The relationship of
10.1088/1748-9326/ab4438
drought frequency and duration to time scales. In Proceedings of
Busico G, Giuditta E, Kazakis N, Colombani N (2019) A hybrid GIS
the 8th Conference on Applied Climatology (Vol. 17, No. 22, pp.
and AHP approach for modelling actual and future forest fire risk
179-183).
under climate change accounting water resources attenuation role.
Mussi M, Nanni T, Tazioli A, Vivalda PM (2017) The Mt Conero
Sustainability, 11(24), 7166. DOI: 10.3390/su11247166
limestone ridge: The contribution of stable isotopes to the
Busico G, Colombani N, Fronzi D, Pellegrini M, Tazioli A, Mastrocicco
identification of the recharge area of aquifers. Italian Journal of
M (2020) Evaluating SWAT model performance, considering
Geosciences, 136(2), 186-197. DOI: 10.3301/IJG.2016.15
different soils data input, to quantify actual and future runoff
Nanni T, Coltorti M, Garzonio CA (1997) Carta Geologica,
susceptibility in a highly urbanized basin. Journal of Environmental
idrogeologica e geomorfologica del bacino del Fiume Musone. Il
Management, 266, 110625. DOI: 10.1016/j.jenvman.2020.110625
bacino del Fiume Musone, Geologia, Geomorfologia e Idrogeologia,
Cello G, Tonti E (2014) Note Illustrative della Carta geologica D’Italia
15-47 “Geological, hydrogeological and geomorphological map of the
alla scala 1:50.000. Foglio 282, Ancona. Ispra Roma “Illustrative
Musone River. The Musone River basin, Geology, Geomorphology and
notes of the Italian Geological map scale 1:50.000. Sheet 282, Ancona.
Hydrogeology, 15-47”.
Ispra Roma”.
Pellegrini M (2020) Annual and Monthly Spatial Distribution of
Dourte D, S Shukla, P Singh, and D Haman (2012) Rainfall
Rainfall and Average Air Temperature in a Temperate Region: A
intensity–duration–frequency relationships for Andhra Pradesh,
Dataset of Twenty Years (2000-2019) for Climate Change Studies.
India: Changing rainfall patterns and implications for runoff and
In book: New Insights into Physical Science Vol. 1 Chapter: 1 B P
groundwater recharge, J. Hydrol. Eng., 18, 324–333. DOI: 10.1061/
International DOI: 10.9734/bpi/nips/v1
(ASCE)HE.1943-5584.0000625
Pranzini G, Di Martino F, Della Santa E, Fontanelli K, Fucci G (2020)
Fiorillo F, Guadagno FM (2010) Karst spring discharges analysis
Impact of climate change on the water balance of the Apuo-Versilia
in relation to drought periods, using the SPI. Water resources
plain acquifer (Tuscany, Italy). Acque Sotterranee-Italian Journal of
management, 24(9), 1867-1884. DOI: 10.1007/s11269-009-9528-9
Groundwater, 9(3).
Freeze RA, Cherry JA (1979) Groundwater, 604 pp., Prentice Hall,
Rassam DW, Peeters L, Pickett T, Jolly I, Holz L (2013) Accounting for
Englewood Cliffs, N. J.
surface–groundwater interactions and their uncertainty in river and
Fronzi D, Banzato F, Caliro S, Camb C, Cardellini C, Checcucci R,
groundwater models: A case study in the Namoi River, Australia.
Tazioli A (2020) Preliminary results on the response of some
Environmental Modelling & Software, 50, 108-119. DOI: 10.1016/j.
springs of the Sibillini Mountains area to the 2016-2017 seismic
envsoft.2013.09.004
sequence. Acque Sotterranee-Italian Journal of Groundwater. DOI:
Ryu J, Song HJ, Sohn BJ, Liu C (2021) Global distribution of three
10.7343/as-2020-450
types of drop size distribution representing heavy rainfall from
Gilfedder M, Rassam DW, Stenson MP, Jolly ID, Walker GR,
GPM/DPR measurements. Geophysical Research Letters, 48(3),
Littleboy M (2012) Incorporating land-use changes and surface–
e2020GL090871. DOI: 10.1029/2020GL090871
groundwater interactions in a simple catchment water yield model.
Rowell DP, Jones RG (2006) Causes and uncertainty of future summer
Environmental Modelling & Software, 38, 62-73. DOI: 10.1016/j.
drying over Europe. Climate Dynamics, 27(2-3), 281-299. DOI:
envsoft.2012.05.005
10.1007/s00382-006-0125-9
Grillakis MG (2019) Increase in severe and extreme soil moisture
Samaniego L, Thober S, Kumar R, Wanders N, Rakovec O, Pan M
droughts for Europe under climate change. Science of The Total
Marx A (2018) Anthropogenic warming exacerbates European soil
Environment, 660, 1245-1255. DOI: 10.1016/j.scitotenv.2019.01.001
moisture droughts. Nature Climate Change, 8(5), 421-426. DOI:
Guttman NB (1998) Comparing the palmer drought index and
10.1038/s41558-018-0138-5
the standardized precipitation index 1. JAWRA Journal of the
Sarti M, Coltorti M (2014) Note illustrative della carta geologica d’Italia
American Water Resources Association, 34(1), 113-121.
alla scala 1:50.000. Foglio 293, Osimo. Ispra Roma “Illustrative notes
Guttman NB (1999) Accepting the standardized precipitation index: a
of the Italian Geological map scale 1:50.000. Sheet 293, Osimo. Ispra
calculation algorithm 1. JAWRA Journal of the American Water
Roma”.
Resources Association, 35(2), 311-322.
27DOI 10.7343/as-2022-574 Acque Sotterranee - Italian Journal of Groundwater 2022-AS41-574: 19 - 28
Scisciani V (2009) Styles of positive inversion tectonics in the Central Tazioli A, Aquilanti L, Clementi F, Nanni T, Palpacelli S, Roncolini
Apennines and in the Adriatic foreland: Implications for the A, Vivalda PM (2017) Parameters of flow in porous alluvial
evolution of the Apennine chain (Italy). Journal of Structural aquifers evaluated by tracers. Flowpath 3rd National Meeting on
Geology, 31(11), 1276-1294. DOI: 10.1016/j.jsg.2009.02.004 Hydrogeology Cagliari, 14-16 June 2017.
Seager R, Liu H, Henderson N, Simpson I, Kelley C, Shaw T, Thornthwaite CW, Mather JR (1957) Instructions and tables for
Kushnir Y, Ting M (2014) Causes of increasing aridification of the computing potential evapotranspiration and the water balance.
Mediterranean region in response to rising greenhouse gases. Journal Centerton.
of Climate, 27(12), 4655-4676. DOI: 10.1175/JCLI-D-13-00446.1 Tian Y, Zheng Y, Wu B. Wu X, Liu J, Zheng C (2015) Modeling
Shah T (2014) Towards a Managed Aquifer Recharge strategy for surface water-groundwater interaction in arid and semi-arid regions
Gujarat, India: An economist’s dialogue with hydro-geologists. with intensive agriculture. Environmental Modelling & Software,
Journal of Hydrology, 518, 94-107. DOI: 10.1007/978-981-10- 63, 170-184. DOI: 10.1016/j.envsoft.2014.10.011
4552-3_11 Toosi AS, Calbimonte GH, Nouri H, Alaghmand S (2019) River
Siebert S, Burke J, Faures JM, Frenken K, Hoogeveen J, Döll P, basin-scale flood hazard assessment using a modified multi-criteria
Portmann FT (2010) Groundwater use for irrigation–a global decision analysis approach: A case study. Journal of Hydrology, 574,
inventory. Hydrology and earth system sciences, 14(10), 1863-1880. 660-671. DOI: 10.1016/j.jhydrol.2019.04.072
DOI: 10.5194/hess-14-1863-2010 Tuel A, Eltahir EA (2021) Mechanisms of European summer drying
Sophocleous M (2002) Interactions between groundwater and surface under climate change. Journal of Climate, 34(22), 8913-8931. DOI:
water: the state of the science. Hydrogeology Journal, 10(1), 52-67. 10.1175/JCLI-D-20-0968.1
DOI: 10.1007/s10040-002-0204-x Turco M, von Hardenberg J, AghaKouchak A, Llasat MC. Provenzale
Steenhuis TS, Van der Molen WH (1986) The Thornthwaite-Mather A, Trigo RM (2017) On the key role of droughts in the dynamics
procedure as a simple engineering method to predict recharge. of summer fires in Mediterranean Europe. Scientific Reports, 7(1),
Journal of Hydrology, 84(3-4), 221-229. DOI: 10.1016/0022- 1-10. DOI: 10.1038/s41598-017-00116-9
1694(86)90124-1 Turco M, Jerez S, Augusto S, Tarín-Carrasco P, Ratola N, Jiménez-
Tashie AM, Mirus BB, Pavelsky TM (2016) Identifying long-term Guerrero P, Trigo, RM (2019) Climate drivers of the 2017
empirical relationships between storm characteristics and episodic devastating fires in Portugal. Scientific Reports, 9(1), 1-8. DOI:
groundwater recharge. Water Resources Research, 52(1), 21-35. 10.1038/s41598-019-50281-2
DOI: 10.1002/2015WR017876 Valigi D, Fronzi D, Cambi C, Beddini G, Cardellini C, Checcucci R,
Taylor RG, Scanlon B, Döll P, Rodell M, Van Beek R, Wada Y, Mastrorillo L, Mirabella F, Tazioli A (2020) Earthquake-induced
Longuevergne L, Leblanc M, Famiglietti JS, Edmunds M, Konikow spring discharge modifications: the Pescara di Arquata spring
L, Green TR, Chen J, Taniguchi M, Bierkens MFP, MacDonald reaction to the august–october 2016 Central Italy earthquakes.
A, Fan Y, Maxwell RM, Yechieli Y, Gurdak JJ, Allen DM, Water, 12(3), 767. DOI: 10.3390/w12030767
Shamsudduha M, Hiscock K, Yeh PJ-F, Holman I, Treidel H (2013) World Meteorological Organization (2012) Standardized Precipitation
Ground water and climate change. Nature climate change, 3(4), Index User Guide (M. Sodova, M. Hayes and D. Wood). WMO –
322-329. DOI: 10.1038/nclimate1744 No 1090, Geneva, 18.
Tazioli A, Mattioli A, Nanni T, Vivalda PM (2015) Natural hazard Zuo D, Hou W, Wu H, Yan P, Zhang Q (2021) Feasibility of calculating
analysis in the Aspio equipped basin. In Engineering Geology for standardized precipitation index with short-term precipitation data
Society and Territory-Volume 3 (pp. 431-435). Springer, Cham. in China. Atmosphere, 12(5), 603. DOI: 10.3390/atmos12050603
DOI: 10.1007/978-3-319-09054-2_89
28You can also read