Ground-penetrating radar survey at Falerii Novi: a new approach to the study of Roman cities
←
→
Page content transcription
If your browser does not render page correctly, please read the page content below

Antiquity 2020 Vol. 94 (375): 705–723
               https://doi.org/10.15184/aqy.2020.82

               Research Article

               Ground-penetrating radar survey at Falerii Novi: a new
               approach to the study of Roman cities
               Lieven Verdonck1 , Alessandro Launaro2 , Frank Vermeulen1
               & Martin Millett2,*
               1
                Department of Archaeology, Ghent University, Belgium
               2
                Faculty of Classics, University of Cambridge, UK
               * Author for correspondence: ✉ mjm62@cam.ac.uk

                                                                                      Our understanding of Roman urbanism relies on evi-
                                                                                      dence from a few extensively investigated sites, such as
                                                                                      Pompeii and Ostia, which are unrepresentative of the
                                                                                      full variety of Roman towns. This article presents the
                                                                                      results of the first high-resolution GPR survey of a
                                                                                      complete Roman town—Falerii Novi, in Lazio,
                                                                                      Italy. The authors review the methods deployed and
                                                                                      provide an overview of the results, including discus-
                                                                                      sion of a case-study area within the town. They dem-
                                                                                      onstrate how this type of survey has the potential to
                                                                                      revolutionise archaeological studies of urban sites,
                                                                                      while also challenging current methods of analysing
                                                                                      and publishing large-scale GPR datasets.

                   Keywords: Italy, Falerii Novi, Roman urbanism, GPR, geophysical survey, data fusion

               Introduction
               Ancient Rome lay at the centre of a network of cities that played a pivotal role in the admin-
               istration, social organisation and economy of its empire. By the first century AD, there were
               approximately 2000 cities across the Roman world (Scheidel et al. 2007: 78) and understand-
               ing them is central to our knowledge of this period. Cities, however, are inherently large and
               only very small sample areas can ever be excavated. Furthermore, as many Roman cities have
               continued in occupation to the present day, excavations are rarely the result of rational
               research designs. More often, the evidence is acquired by chance, such as in developer-led
               excavations brought about by development threats within modern townscapes, and shaped
               by later phases of occupation. Consequently, we are reliant on the evidence from a small

               Received: 3 July 2019; Revised: 30 October 2019; Accepted: 7 November 2019
               © Antiquity Publications Ltd, 2020. This is an Open Access article, distributed under the terms of the Creative
               Commons Attribution licence (http://creativecommons.org/licenses/by/4.0/), which permits unrestricted re-use,
               distribution, and reproduction in any medium, provided the original work is properly cited.

                                                                               705
https://doi.org/10.15184/aqy.2020.82 Published online by Cambridge University Press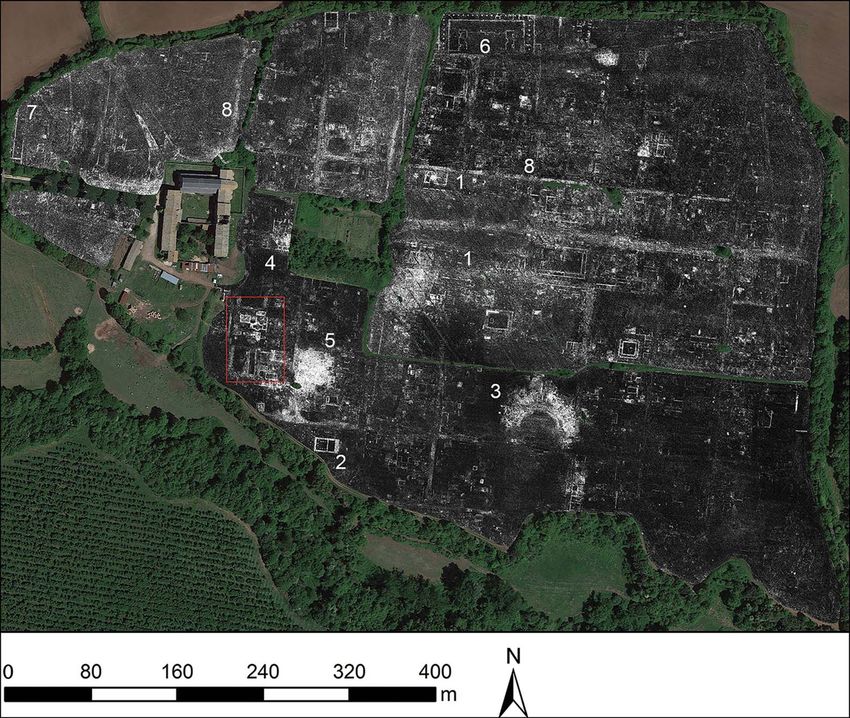
Lieven Verdonck et al.

                number of extensively explored Roman urban sites that have been the subject of large-scale
                clearance or major excavation campaigns, such as Ostia and Pompeii. These sites dominate
                the modern archaeological literature, but they can hardly be considered as typical cities.
                    Over the last 20 years, our understanding of ancient towns has been revolutionised by the
                use of remote-sensing techniques (Linck et al. 2012; Vermeulen et al. 2012; Doneus et al.
                2014), which have enhanced our knowledge of the overall topography of these sites, especially
                when combined with excavation and surface survey. For example, magnetometry (predomin-
                antly fluxgate gradiometry) has produced impressive results, mapping complete Roman towns
                and transforming the evidence base for Roman urban studies (see Johnson & Millett 2013: 4–6;
                Campana 2018: 7–9). Gradiometer surveys, however, usually provide only a composite 2D
                image of near-surface features and, although they can provide spectacular plans of the upper
                layers of urban sites, they generally give only limited information about the deeper, earlier levels.
                Nevertheless, at some sites, such as Falerii Novi (Fabrica di Roma, Lazio, Italy), interrogation of
                magnetometry data has been able to generate new models for the early development of Roman
                towns (Keay et al. 2000; McCall 2007; Millett 2007; Hay et al. 2010; Wallace-Hadrill 2013).
                    Ground-penetrating radar (GPR) is a reliable method that provides high-resolution 3D
                images of buried structures. It relies on the reflection of electromagnetic (radio) waves at tran-
                sitions between materials of a different dielectric permittivity. The amplitudes and travel
                times of the reflected waves are measured, resulting in vertical radargrams or profiles.
                Using several parallel radargrams, horizontal slices at different depths (‘time-slices’ or
                ‘depth-slices’) can be created. Whereas traditionally a small, single antenna has been
                moved manually over the ground surface, over the last decade, multi-channel GPR arrays
                have been developed (Linford et al. 2015)—usually now towed by an all-terrain vehicle.
                Combined with real-time positioning using a global navigation satellite system receiver or
                a tracking total station, GPR now allows for rapid survey of large areas, while maintaining
                a high sample density (Grasmueck et al. 2005).
                    Recent work has demonstrated the value of GPR survey on Roman urban sites (e.g. Ver-
                donck & Taelman 2012; Jardel et al. 2017; Lockyear & Shlasko 2017), but these projects are
                predominantly small scale, covering no more than a few hectares. Since 2015, however,
                we have deployed GPR on a much larger scale to generate high-resolution images of two
                complete greenfield Roman towns in Italy: Interamna Lirenas and Falerii Novi (https://
                www.classics.cam.ac.uk/research/projects/beneath-the-surface-of-roman-republican-cities).
                To explore the value of this approach, this article presents the methods and first results of this
                research at Falerii Novi.
                    Although such rapid data collection allows entire Roman cities to be mapped at an unpre-
                cedented level of detail, interpretation of these large datasets still relies largely on visual
                analysis and the manual digitisation of anomalies. These traditional, time-consuming inter-
                pretative methods are no longer able to exploit fully the potential of geophysical prospection,
                and here we propose possible ways forward. First, the combination and fusion of different
                geophysical datasets can result in an enhanced level of interpretation. We illustrate this
                with an example from Falerii Novi, in which GPR and magnetometry survey data are visua-
                lised in a single image by assigning the two datasets to different colour channels (RGB com-
                positing). Second, computer-aided interpretation provides a means of handling large data
                volumes in a more efficient and objective way. We discuss one class of methods, based on

                © Antiquity Publications Ltd, 2020
                                                                                706
https://doi.org/10.15184/aqy.2020.82 Published online by Cambridge University Press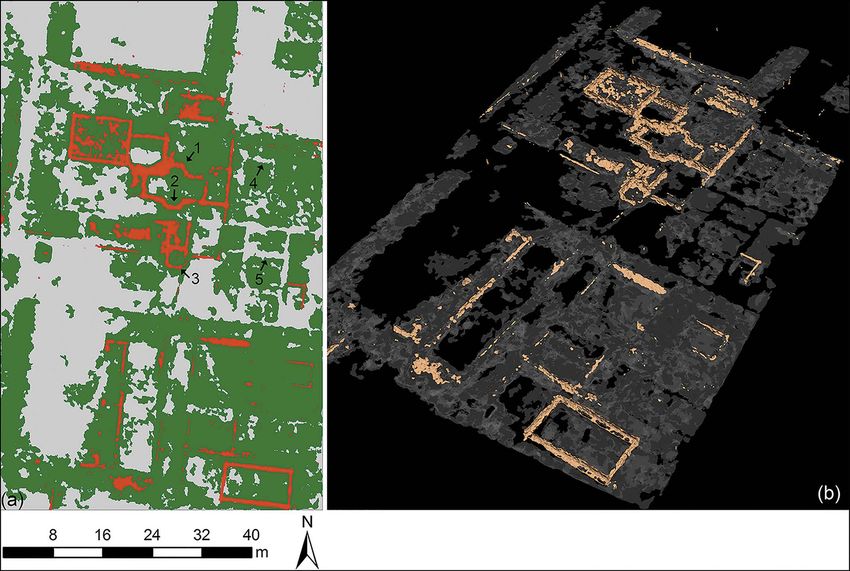
Ground‐penetrating radar survey at Falerii Novi

               mathematical morphology. Finally, we address the issue of how to publish complex,
               large-scale surveys that yield vast quantities of archaeological data.

               Field site
               Located approximately 50km to the north of Rome, Falerii Novi has a walled area of 30.5ha.
               The town was founded in 241 BC, following the destruction by Rome of the nearby Faliscan
               centre of Falerii Veteres. Occupation at Falerii Novi continued through Roman times and
               down to the early medieval period (sixth to seventh centuries AD). It was one of the first
               Roman towns to be subjected to a complete fluxgate gradiometer survey (Keay et al. 2000;
               Hay et al. 2010), providing a very clear plan of the entire site (Figure 1). The town plan
               was informed by the layout of contemporaneous colonies such as Cosa (273 BC), while inte-
               grating elements of its Faliscan predecessor (Millett 2007). Falerii Novi was selected for the
               current project, as this earlier magnetometry survey provides a control for, and a complement
               to, the new GPR data.

               Figure 1. Falerii Novi fluxgate gradiometer survey (Keay et al. 2000); data range −30nT (white) to +30nT (black)
               (aerial photograph: Google Earth; image by L. Verdonck).

                                                                                            © Antiquity Publications Ltd, 2020
                                                                               707
https://doi.org/10.15184/aqy.2020.82 Published online by Cambridge University Press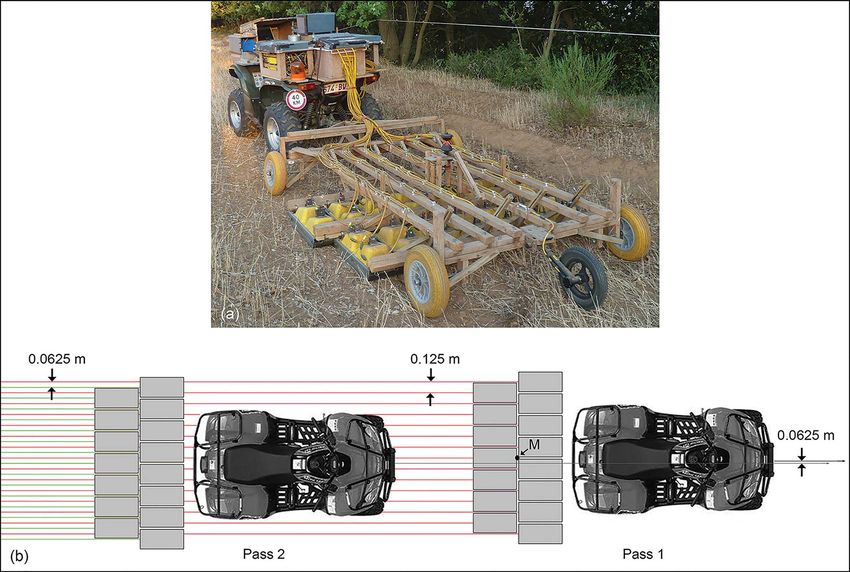
Lieven Verdonck et al.

                Methods
                Field methods, equipment and data processing
                A summary of the instruments and parameters used for the data acquisition is provided in the
                online supplementary material (OSM). The GPR network, towed by an all-terrain vehicle,
                comprises 15 500MHz antennae (Figure 2a). This frequency has previously proved effective
                for the prospection of Roman urban sites (e.g. Verdonck & Taelman 2012). As the width of
                one antenna housing is ∼0.25m, the arrangement of the antennae in two offset rows results in
                a vertical profile spacing of 0.125m (Figure 2b). In order to meet sample density require-
                ments (Grasmueck et al. 2005; Verdonck et al. 2015), a second pass was made, reducing
                the transect spacing to 0.0625m (Figure 2b).
                   GPR performance is dependent on the electrical conductivity of the soil, which is affected
                by the quantity of dissolved salts, clay content and soil moisture (Daniels 2004). At Falerii
                Novi the generally dry conditions in the summer months were well suited to GPR survey,
                but occasional rainfall increased soil conductivity and limited GPR penetration depth. Fol-
                lowing rain, up to seven days were needed before the ground was sufficiently dry to yield opti-
                mal data quality and maintain interpretative potential.
                   We followed a standard GPR data-processing workflow (see the OSM). Background
                removal (the subtraction of the average of all traces in a profile from each individual trace)
                did not entirely remove stripes in the time-slices caused by different amplitudes recorded
                on different network channels. These stripes were suppressed by calculating the average of
                the data recorded by each channel within a swath and then equalising these average values.
                Subsequently, migration (Verdonck et al. 2015) improved lateral resolution, as illustrated
                in Figure 3.

                Manual mapping of anomalies
                The output is represented as a series of time-slices, which map the GPR data as a series of
                images at successive depths below the surface (Figure 4). These time-slices can be animated
                to provide a 3D impression of sub-surface features (see the OSM). For a more detailed arch-
                aeological analysis and interpretation, however, we first examined each separate time-slice
                individually and manually mapped anomalies using GIS (ESRI ArcGIS 10) (see figures in
                the OSM). As a separate subsequent stage, we interpreted the anomalies in terms of architec-
                tural features, interpolating walls and identifying surfaces, while attempting to understand
                the features in the context of known architectural forms, such as temples and baths. Overlay-
                ing the resulting interpretative plans of features at different depths forms the basis for the dis-
                cussion of the urban topography and site development below.

                Illustrating the results
                Our assessment of the Falerii Novi results is at an early stage, but two conclusions are already
                clear. First, the high resolution of the data and the ability to distinguish features at different
                depths provide a much stronger foundation for understanding the town than was previously
                possible. Second, comparing the GPR results with those from the earlier magnetometer

                © Antiquity Publications Ltd, 2020
                                                                                708
https://doi.org/10.15184/aqy.2020.82 Published online by Cambridge University Press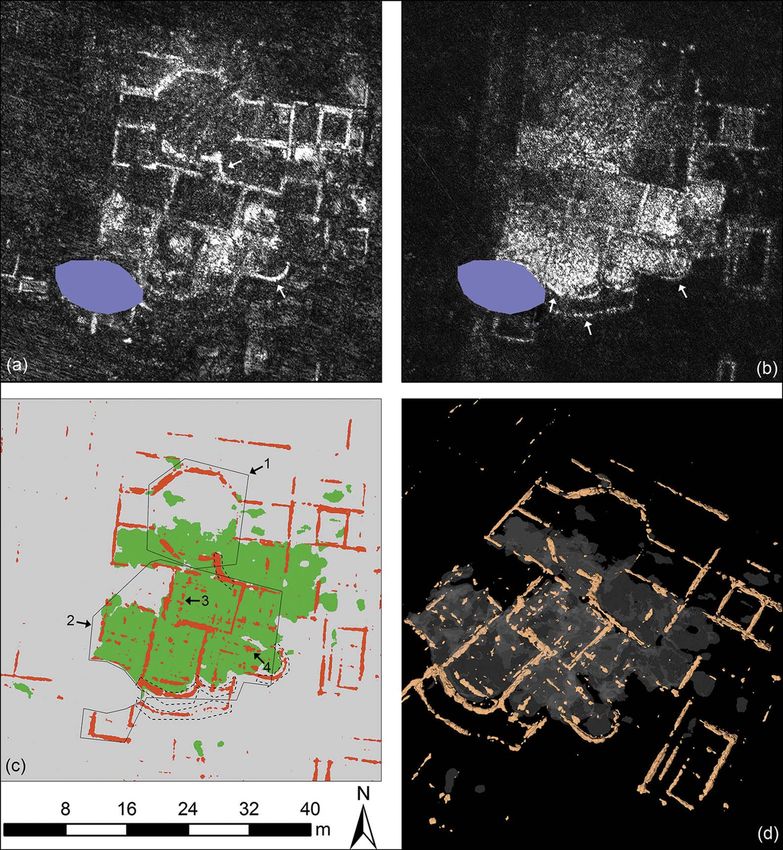
https://doi.org/10.15184/aqy.2020.82 Published online by Cambridge University Press

                                                                                                                                                                                                                                                                                                             Ground‐penetrating radar survey at Falerii Novi
                                                                                      709
                                                                                            © Antiquity Publications Ltd, 2020

                                                                                                                                 Figure 2. a) GPR system used at Falerii Novi; b) antennae mounted in two rows, with the spacing between profiles at 0.125m (red lines). Two passes were made, following
                                                                                                                                 theoretical lines 0.0625m apart (grey lines). The second pass allowed further reduction of the transect spacing to 0.0625m (green lines). M = theoretical midpoint of the
                                                                                                                                 array where the global navigation satellite system or total station prism is mounted (image by L. Verdonck).
Lieven Verdonck et al.

                Figure 3. a) GPR time-slice, between 19–20ns (0.85–0.90m); b) migration enhances the resolution so that data
                become more easily interpretable. Arrows indicate locations with improved resolution (e.g. a structure near 1 can be
                more certainly interpreted as a drain after migration) (image by L. Verdonck).

                survey (Figures 1 & 4; Keay et al. 2000; Hay et al. 2010) shows how neither method is able to
                produce a complete picture of the archaeology; the forum tabernae (shop units) appear, for
                example, in the magnetic data, but not in the GPR survey (Figure 4.1). This underlines
                the need to deploy complementary prospection methods and to integrate the results.
                    Here, we confine discussion to an overview of the full plan, alongside a more detailed case
                study of one sample area. Taking the overall dataset first (Figure 4), the high resolution of the
                data allows us to identify many individual structural elements (e.g. columns), as demon-
                strated by the temple to the west of the south gate (Figure 4.2), permitting detailed architec-
                tural analysis previously only possible through excavation. The GPR data also help with a
                problem encountered with the magnetometer survey, whereby building rubble may mask
                structural detail; the GPR survey provides a clearer view. So, although the theatre is identi-
                fiable in the magnetometry survey (Figure 1), analysis of the GPR data at different depths
                allows the theatre’s structural form to be understood in detail (Figure 4.3). Such information
                reveals how individual buildings developed through time. In particular, the identification in
                the GPR data of floor surfaces and places where stone robbing has removed walls (Figure 5.1)
                allows building plans to be understood more fully.
                    GPR survey at Falerii Novi has revealed previously unrecorded public buildings, such as a
                temple (Figure 4.2), a macellum or market building (Figure 4.4) and a bath complex
                (Figure 4.5). While these buildings fall within the expected repertoire of a Roman city,
                some are architecturally sophisticated—more elaborate than would usually be expected in
                a small town. More unexpected were two very large structures adjacent to the walls.

                © Antiquity Publications Ltd, 2020
                                                                                710
https://doi.org/10.15184/aqy.2020.82 Published online by Cambridge University Press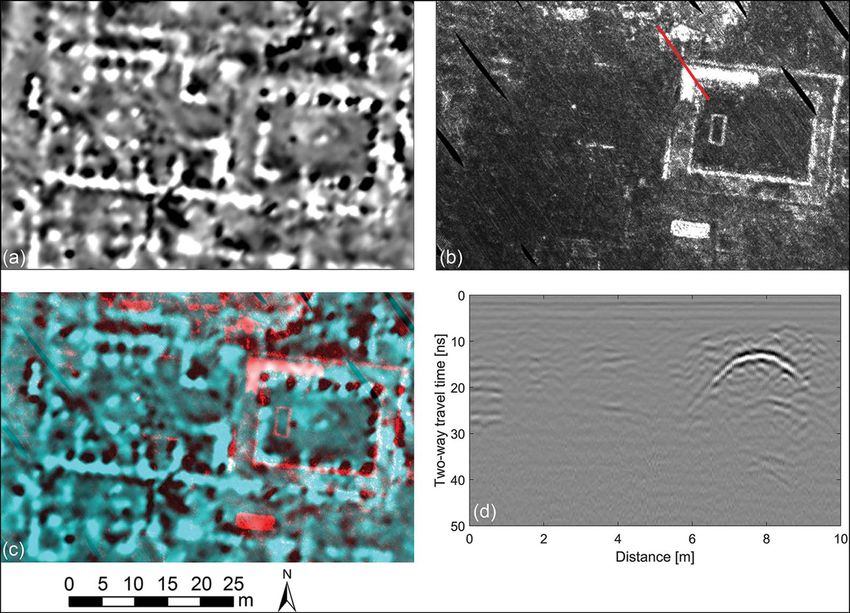
Ground‐penetrating radar survey at Falerii Novi

               Figure 4. GPR time-slice, at an estimated depth of 0.80–0.85m. The red rectangle indicates the location of Figure 5
               (aerial photograph: Google Earth; image by L. Verdonck).

               Immediately to the east of the north gate is an enclosure defined on three sides by a substantial
               porticus duplex (covered passageway with central row of columns) approximately 90 × 40m in
               size (Gros 1996: 96), opening onto the street (Figure 4.6). A pair of structures, each with a
               central niche, face each other within the interior of the complex. While we know of no direct
               parallel to this structure, this was evidently a public monument. Its porticus is similar to that
               of another newly discovered structure, immediately to the north of the west gate, which
               defines the temenos (enclosure) of the capitolium (temple) identified during the previous mag-
               netometry survey (Figure 4.7; Keay et al. 2000: 11–14).
                   As a detailed case study, we present an area in the south-west part of Falerii Novi (Fig-
               ure 5). Figure 6 summarises the manual mapping of all the time-slices (illustrated individually
               in the OSM). This covers parts of Insulae XLI and L, bounded to the west by a north–south
               street that is visible in the GPR data (Figure 6.1), although it is less well defined than some
               other streets (e.g. Figure 4.8), suggesting the removal or loss of the paved surface. The east–
               west-running street separating the insulae cannot be discerned, with evidence suggesting that
               it may have been overbuilt.

                                                                                            © Antiquity Publications Ltd, 2020
                                                                               711
https://doi.org/10.15184/aqy.2020.82 Published online by Cambridge University Press
Lieven Verdonck et al.

                Figure 5. GPR time-slice (case study area), at an estimated depth of 0.75–0.80m (image by L. Verdonck).

                © Antiquity Publications Ltd, 2020
                                                                                712
https://doi.org/10.15184/aqy.2020.82 Published online by Cambridge University Press
Ground‐penetrating radar survey at Falerii Novi
Figure 6. Interpretation of the case-study area (Figure 5) based on manual mapping of the anomalies. This summarises
information from all the time-slices (illustrated in the online supplementary material), showing walls (grey), surfaces
(red) and water pipes (light blue) (streets and Insula numbers from Keay et al. 2000) (image by A. Launaro).
© Antiquity Publications Ltd, 2020
713
https://doi.org/10.15184/aqy.2020.82 Published online by Cambridge University PressLieven Verdonck et al.
Two or three atrium houses occupy the east of the area, all of which open onto the street
that lies approximately 10m to the east. The plans of these houses are revealed by their floor
surfaces, with many of the walls robbed-out. Examination of individual time-slices reveals
structural remodelling over time. To the west, the area is occupied by larger structures,
including a bath house in Insula XLI (Figure 6.2), with its main east–west block including
a plunge bath and a series of apsidal rooms with hypocausts; another apsidal room to the
south may be a later addition. A U-shaped area of flooring to the north of the bath house
(Figure 6.3) may represent a portico surrounding a palaestra (exercise area). While these
baths are modest in scale compared with those to the south-east (Figure 4.5), their architec-
ture is nonetheless elaborate, perhaps suggesting that they were for public use.
To the south, in Insula L, is a very large rectangular building defined along the street to the
west by a passageway with columns on either side (Figure 6.4). A second passageway along its
centre is articulated with buttresses along its east face that were probably both decorative and
structural (Figure 6.5), while a third passageway along the building’s east side (Figure 6.6)
shows no evidence for decorative elaboration. The building lies just within the town wall,
towards the foot of a slope, and is connected to a series of water pipes that run beneath
other buildings (Figure 6: light blue). These pipes connect with the town’s aqueduct and
can be traced across much of the town, running beneath the insulae, and not just along
streets, as might have been expected. The architectural form and the presence of the pipes
indicates that the large rectangular structure was not a cistern, but rather, an open-air natatio
or pool associated with the adjacent baths, thus forming part of a substantial public bathing
facility.
Problems and prospects
The results of the Falerii Novi survey show how high-quality GPR data can be collected across
large areas, potentially revolutionising the study of ancient cities. The recent advances in the
technology for collecting and processing the data, however, generate a series of new problems.
First, is the sheer quantity of data resulting from survey at a dense sample interval. At Falerii
Novi, we collected 71.7 million readings, each consisting of 400 temporal samples, equating
to 28.68 billion data points—approximately 4.5GB of raw data per hectare (in the SEG-Y
32-bit single-precision floating point format). Such a dataset requires a considerable amount
of time to analyse. More than 20 hours per hectare were required to produce the manual arch-
aeological interpretations. This challenge prompted us to investigate methods of computer-
aided interpretation.
The second issue relates to the combination of results from complementary geophysical
prospection techniques that reveal different features, leading to the exploration of how
such data can be combined for interpretation, rather than simply being juxtaposed. Finally,
the question arises of how best to publish such large quantities of complex GPR data.
Image processing and fusion
The quantity and quality of the geophysical data from Falerii Novi make it ideal for assessing
the utility of processing techniques for urban research. Recent work suggests that in addition
© Antiquity Publications Ltd, 2020
714
https://doi.org/10.15184/aqy.2020.82 Published online by Cambridge University PressGround‐penetrating radar survey at Falerii Novi
to a multi-method approach (i.e. combining magnetometry, resistivity, electromagnetic
induction and GPR), ‘data fusion’ enables the geophysicist to define better the position,
extent, depth and physical characteristics of anomalies (Piro et al. 2000; Kvamme 2006;
Bornik et al. 2018). Various approaches to data fusion have been investigated, such as graph-
ical integration, and operations on binary and continuous data (Kvamme 2006). Using
graphical overlays and colour composite images is an easy and efficient method for integrating
geophysical data in a 2D environment. Two or more images are merged to generate a single
composite image that contains information from all input images. Figure 7 shows a
red-green-blue colour composite, where the magnetometer data (Figure 7a) are assigned to
the green and blue channels, and the GPR data (Figure 7b) to the red channel. To perform
the integration, both datasets were converted to a scale ranging from 0–255, and then
resampled to a common sample density of 0.1 × 0.1m. The magnetometer data were also
inverted so that walls are represented by high values, as is the case for the GPR data. Despite
the difference in spatial resolution between the magnetometer and GPR data, the image com-
bination (Figure 7c) allows the integration of the GPR information about a cistern (Figure 7d)
with the more complete image of the house from the magnetometer data.
Figure 7. a) Extract from the fluxgate gradiometer survey, showing a house; data range −30nT (white) to +30nT
(black) (Keay et al. 2000); b) extract from the GPR survey over the same area; c) RGB-image generated by assigning
the GPR data to the red channel, and the gradiometer data to the green and blue channels. While the gradiometer
survey provided a more complete image, the GPR data add high-resolution information on the peristilium, including
a probable cistern, whose vault is clearly visible in the vertical GPR profile (d), the location of which is indicated by
the red line in (b) (image by L. Verdonck).
© Antiquity Publications Ltd, 2020
715
https://doi.org/10.15184/aqy.2020.82 Published online by Cambridge University PressLieven Verdonck et al.
Ideally, the output image should be more comprehensive than the input images and thus
better suited for interpretation and further processing, while the fusion algorithm should be
efficient and reliable. Image pixels are the final output of the geophysical data acquisition and
processing chain. Pixel-based methods (Kvamme 2006; Ogden et al. 2010; Verdonck et al.
2019) have produced significant results, resulting in a clearer depiction of structures that
would otherwise be less visible in individual datasets. Nevertheless, several critical issues
must be considered with such imagery. As the process seeks a targeted and combined—
and to a certain extent simplified—depiction of the archaeological remains, the fused output
may come at the price of some information loss (Filzwieser et al. 2018).
GIS tools are also frequently used to integrate and visualise GPR datasets. They are well
suited for detailed interpretative mapping, as they support globally referenced positioning
and flexible integration of field data in the form of overlays. The use of GPR data in GIS,
however, remains limited to the display and overlay of horizontal 2D time-slices. Although
this provides an accessible interface for visualising and interpreting the results, it does not
take full advantage of the potential of 3D data. Future work using both GIS and other tech-
niques is therefore required to explore true 3D visualisation for data analysis and interpret-
ation. Although tests have so far been less than successful (Ogden et al. 2010: 14), there
must be future opportunity for the adaptation and application of interactive segmentation
techniques. Image fusion, for instance, is frequently used in the medical sciences to improve
image quality while simultaneously decreasing the amount of data and reducing information
redundancy (James & Dasarathy 2014). Such an approach, critically deployed, would be of
enormous value for archaeologists mapping ancient urban sites.
Computer-aided object detection
An important issue in processing GPR data relates to the creation of interpretative drawings.
Today, this usually involves the manual definition of anomalies. This is time-consuming,
raising the question of how it might be automated. When analysing GPR data from
Roman urban sites, one method is to exploit the linear and orthogonal character of many
anomalies, which usually represent walls or wall foundations.
This can be achieved by matching linear templates to an image (Verdonck 2016): a pre-
defined model, representative of the (linear) shape and the dimensions of the targeted wall
structures, is slid across a GPR time-slice. Where the template matches the GPR image,
the presence of walls can be expected. In mathematical morphology, a similar concept (the
structuring element, SE) is used to probe the image, and perform image-processing opera-
tions. The size and shape of the SE makes the operation sensitive to particular objects in
the image (by ‘objects’ we mean structures such as walls or floors). In mathematical morph-
ology, two fundamental operations are erosion and dilation, which shrink and expand the
objects in an image, respectively. In binary images, erosion can be used to eliminate objects
smaller than the size of the SE. The larger objects are shrunk, and restored to their original
size by dilating the image with the same SE. Therefore, the morphological opening (MO)
operator (erosion followed by dilation) can be used to extract objects larger than the SE
(Gonzalez & Woods 2002). In this way, irrelevant small objects (‘noise’) are eliminated,
© Antiquity Publications Ltd, 2020
716
https://doi.org/10.15184/aqy.2020.82 Published online by Cambridge University PressGround‐penetrating radar survey at Falerii Novi
while the larger objects of archaeological interest, which conform to the SE, are preserved, so
that the image is effectively cleaned.
A problem arises, however, when applying the MO to GPR time-slices. Using a linear SE,
wall structures that are interrupted—by a doorway, for example—are not extracted, as they do
not contain the complete SE. A shorter SE may detect the individual wall sections on either
side of the doorway, but this also increases the risk of extracting small objects not belonging to
walls (i.e. false positives). A more flexible operator is the ‘rank-max opening’ (RMO), where
not only the size of the SE is defined, but also the rank—the maximum number of pixels
allowed to be lacking from an image object (Soille 2002). For linear SEs, the orientation
also needs to be determined. Finally, when working with greyscale images, such as GPR time-
slices, a threshold is used to obtain a binary image after applying the RMO.
We used the RMO to extract wall objects from the Falerii Novi case-study area (Figure 5).
Thirty-two time-slices with a thickness of 0.05m and encompassing a total depth of 1.60m
were analysed. Three parameters of the linear SE were specified. Its length was set to 4m, and
its rank to 25 per cent (i.e. allowing gaps of up to 1m). Two perpendicular orientations, cor-
responding to the main orientations of the walls in Figure 5, were set to N6°E and N84°W.
When applying these linear SEs to the horizontal GPR-slices, curved features such as the ones
near numbers 1–3 (Figure 8a) were not detected. Therefore, we also applied a vertical linear
SE to the vertical radargrams, with a length of 0.9m and a rank of 25 per cent. Both results
were combined to give the result shown in red in Figure 8a.
In the GPR data (Figure 5), however, it is not only the linear anomalies that contain arch-
aeological information, but also the wider reflective areas that mostly represent floors. These
were extracted by applying a median filter with a large window (up to 1 × 1m) to the time-
slices. The output was thresholded to obtain a binary image. Of the resulting regions, those
smaller than a predefined area were removed. The result is shown in green in Figure 8a.
This workflow was followed for each horizontal time-slice and each vertical profile. The
resulting images were stacked to obtain two binary volumes, one based on the time-slices,
the other on the profiles. Of these two volumes, the Boolean union was calculated, and
the outcome was imported in the rendering software Autodesk 3ds Max, to create the 3D
representation shown in Figure 8b. When employing this workflow, most positive GPR
anomalies (i.e. reflections, indicated by the white areas in Figure 5) were detected successfully,
although some anomalies interpreted as walls during manual mapping (Figure 6) were con-
sidered as floors by the computer algorithm. Of the negative GPR anomalies present in Fig-
ure 5 (weak reflections contrasting with a strongly reflecting background), some were
extracted (Figure 8a, 4–5), while others remained undetected. In a different area of the
site, where a bath house is located (Figure 4.5), two factors complicated the extraction of
wall objects. First, the walls are on a variety of different orientations. Two regions were there-
fore delimited (Figure 9c, 1–2), where the extraction occurred separately using linear SEs
with different orientations. Second, at deeper levels, the walls appeared barely separable
from the strongly reflective areas inside the rooms (Figure 9b). This resulted in false positives
when extracting wall structures from the time-slices (e.g. Figure 9c, 3–4). Further separate
regions (the dashed lines in Figure 9c) were required to detect the curved walls indicated
by the arrows in Figure 9a–b. Object detection was further complicated by the fact that,
for the area shown in Figure 9, it was not possible to use uniform values for the length of
© Antiquity Publications Ltd, 2020
717
https://doi.org/10.15184/aqy.2020.82 Published online by Cambridge University Presshttps://doi.org/10.15184/aqy.2020.82 Published online by Cambridge University Press
© Antiquity Publications Ltd, 2020
Lieven Verdonck et al.
718
Figure 8. Computer-aided object detection in the GPR data from the case-study area (Figure 5): a) the wall objects detected in each individual GPR slice and profile were
combined and projected onto a 2D map (red). Detected floors are shown in green; b) 3D representation showing the same result, with the floors semi-transparent (image by
L. Verdonck).Ground‐penetrating radar survey at Falerii Novi
Figure 9. GPR time-slices from a bath complex, at an estimated depth of (a) 0.40–0.45m and (b) 1.30–1.35m; c)
result of the computer-aided detection of walls (red) and floors (green). The solid and dashed lines indicate areas for
which parameter values were set separately; d) 3D representation showing the same result (image by L. Verdonck).
the SEs and the thresholds (these values were determined for each time-slice separately). The
process, therefore, is one of interactive rather than automatic detection: the algorithm pro-
poses a segmentation image based on the parameter values entered by the user, who then
improves the segmentation by iteratively changing the parameter values. While time-saving
may currently be limited for complex datasets, growing computing power seems certain to
make such interactive approaches increasingly beneficial, for example, enabling the interpret-
ation map to change instantaneously when the user moves a slider to adjust a parameter value.
© Antiquity Publications Ltd, 2020
719
https://doi.org/10.15184/aqy.2020.82 Published online by Cambridge University PressLieven Verdonck et al.
Publication and archiving
A final issue concerns how best to publish such substantial datasets. Too often, major geo-
physical surveys are simply presented as images, usually at small-scale and without much dis-
cussion of the structures revealed. Our aim is to publish a comprehensive analysis of the
architecture and history of an entire Roman town. While this will take some time to realise,
we envisage that it will take the hybrid form of a print summary and an online atlas, enabling
the reader to interrogate the images. In the meantime, we include OSM along with this article
to enable readers to explore the evidence. Simultaneously, our data have been deposited, in
accordance with the guidelines for archiving geophysical data (Schmidt & Ernenwein 2011),
as an open-access archive with the Archaeology Data Service (Millett et al. 2019), so that they
are available for other researchers to access and use. The raw and processed GPR profiles,
including position information, have been converted from proprietary formats to the seismic
SEG-Y rev 1 format, which can be accessed using freely available SEG-Y readers (e.g. SeiSee).
The time-slices are stored as GeoTIFF files, accompanied by full metadata, including project
information, field methodology, instrument settings and data treatment.
Conclusions
Together with our similar GPR survey at Interamna Lirenas, the work at Falerii Novi has sig-
nificant implications for the study of Roman cities. Building on the earlier use of magnetom-
eter surveys, it offers the possibility of investigating a series of towns as total entities, thereby
moving away from a reliance on a small number of extensively explored sites and a large num-
ber of limited area excavations that provide only small samples of much larger sites. It is
important to note, however, that while Falerii Novi is well suited to both magnetometry
and GPR survey, other sites may not be so conducive. GPR, for example, may perform
less well on conductive soils. It is therefore crucial to choose the (geophysical) prospection
techniques most appropriate to the soil, geology and archaeological preservation at each
site. Furthermore, although GPR survey provides both high-resolution imagery and the abil-
ity to distinguish structures at different depths, it can never provide the chronological detail or
the granular evidence of a site’s development accessible through excavation. Conversely, the
same extent of high-resolution spatial coverage can never be achieved by excavation. The two
approaches are thus complementary, and we must rethink how the two methods might better
complement each other, abandoning the positivist concept of ‘ground-truthing’ to reconsider
what information we require to understand entire towns, and how it could most appropriately
be collected. Extrapolating from a single example (our work at Falerii Novi) is clearly hazard-
ous, but both the magnetic and GPR surveys at Falerii Novi suggest that the greatest potential
from the combination of different methods is to be found in the peripheral areas of the town.
Before these surveys, we had only information from nineteenth- and twentieth-century exca-
vations, along with an epigraphic and sculptural analysis (di Stefano Manzella 1979). These
limited data, together with inferences from the site’s topography, comparison with other
towns, and general understandings of concepts of Roman urban planning, formed the
basis for speculation about Falerii Novi’s layout. Our new survey results now show how
Falerii conforms to such concepts (e.g. the forum’s design and location), but also how it
© Antiquity Publications Ltd, 2020
720
https://doi.org/10.15184/aqy.2020.82 Published online by Cambridge University PressGround‐penetrating radar survey at Falerii Novi
elaborates other ideas. The magnetometer survey, for instance, had revealed a sacred topog-
raphy, with temples located around the town’s periphery. The GPR work has greatly
enhanced our understanding of this landscape, showing how other monumental buildings
articulated this marginal space—particularly adjacent to the town’s gates (e.g. the porticus
in Figure 4.6 and the temenos in Figure 4.7). Although we are yet to understand how this
sacred landscape functioned, the survey provides new insights into the variety of planning
concepts underlying what are sometimes incorrectly considered to be ‘standardised’
Roman town plans. By providing a contrast with more familiar towns such as Pompeii,
this work also raises important questions about the planning of Roman towns more generally.
The detailed investigation of complex sites, such as Roman cities, produces increasingly
large amounts of data. Interpretation through traditional, manual methods is unfeasible for
sites tens of hectares in extent. While new techniques, such as computer-aided object detec-
tion, will be indispensable, their application to archaeological geophysics is currently still in
its infancy. In this article, the potential and limitations of computer-aided methods are illu-
strated by examining one class of algorithms, based on mathematical morphology. Further
we have shown how the fusion of multiple geophysical datasets can aid in archaeological
interpretation. There is little doubt that the future application of new analytical methods
such as these will fundamentally change the ways in which Roman urbanisation is
understood.
Acknowledgements
This research was a collaboration between the universities of Cambridge and Ghent, funded
by the Arts and Humanities Research Council (AH/M006522/1). Lieven Verdonck was
funded by a post-doctoral fellowship from the Fund for Scientific Research—Flanders
(FWO). We are grateful for support from Soprintendenza Archeologia, Belle Arti e Paesaggio
per l’Area Metropolitana di Roma, la Provincia di Viterbo e l’Etruria Meridionale.
Supplementary material
To view supplementary material for this article, please visit https://doi.org/10.15184/aqy.
2020.82
References
Bornik, A., M. Wallner, A. Hinterleitner, landscapes. Cham: Springer.
G. Verhoeven & W. Neubauer. 2018. https://doi.org/10.1007/978-3-319-89572-7_5
Integrated volume visualisation of archaeological Daniels, D.J. 2004. Ground-penetrating radar (2nd
ground penetrating radar data, in R. Sablatnig & edition). London: The Institution of Electrical
M. Wimmer (ed.) Proceedings of the 16th Engineers. https://doi.org/10.1049/PBRA015E
Eurographics Workshop on Graphics and Cultural Doneus, M., G. Verhoeven, C. Atzberger,
Heritage (GCH 2018), Vienna, 12th–15th M. Wess & M. Ruš. 2014. New ways to
November 2018: 231–34. Geneva: The extract archaeological information from
Eurographics Association. hyperspectral pixels. Journal of Archaeological
Campana, S.R.L. 2018. Mapping the archaeological Science 52: 84–96.
continuum: filling ‘empty’ Mediterranean https://doi.org/10.1016/j.jas.2014.08.023
© Antiquity Publications Ltd, 2020
721
https://doi.org/10.15184/aqy.2020.82 Published online by Cambridge University PressLieven Verdonck et al.
Filzwieser, R. et al. 2018. Integration of Linford, N., P. Linford & A. Payne. 2015. First
complementary archaeological prospection data results from a new ground-coupled multi-element
from a Late Iron Age settlement at Vesterager— GPR array. Archaeologia Polona 53: 631–35.
Denmark. Journal of Archaeological Method and Lockyear, K. & E. Shlasko. 2017. Under the park:
Theory 25: 313–33. recent geophysical surveys at Verulamium.
https://doi.org/10.1007/s10816-017-9338-y Archaeological Prospection 24: 17–36.
Gonzalez, R.C. & R.E. Woods. 2002. Digital https://doi.org/10.1002/arp.1548
image processing (2nd edition). Upper Saddle River McCall, W.F. 2007. Falerii Novi and the
(NJ): Prentice-Hall. Romanisation of Italy during the Mid-Republic.
Grasmueck, M., R. Weger & H. Horstmeyer. Unpublished PhD dissertation, University of
2005. Full-resolution 3D GPR imaging. North Carolina at Chapel Hill.
Geophysics 70: 12–19. Millett, M. 2007. Urban topography and social
https://doi.org/10.1190/1.1852780 identity in the Tiber Valley, in R. Roth & J. Keller
Gros, P. 1996. L’architecture Romaine 1: les (ed.) Roman by integration: dimensions of group
monuments publics. Paris: Picard. identity in material culture and text (Journal of
Hay, S., P. Johnson, S. Keay & M. Millett. 2010. Roman Archaeology Supplementary Series 69):
Falerii Novi: further survey of the northern 71–82. Portsmouth (RI): Journal of Roman
extra-mural area. Papers of the British School at Archaeology.
Rome 78: 1–38. Millett, M., L. Verdonck, N. Leone &
https://doi.org/10.1017/S0068246200000799 A. Launaro. 2019. Beneath the surface of Roman
James, A.P. & B.V. Dasarathy. 2014. Medical Republican cities (data set). York: Archaeology
image fusion: a survey of the state of the art. Data Service. https://doi.org/10.5284/1052663.
Information Fusion 19: 4–19. Ogden, J., K. Strutt, S. Keay, G. Earl & S. Kay.
https://doi.org/10.1016/j.inffus.2013.12.002 2010. Geophysical prospection at Portus: an
Jardel, K., A. Schmidt, M. Dabas & R. Sala. evaluation of an integrated approach to
2017. Changing faces: archaeological interpreting subsurface archaeological features, in
interpretations and the multi-stage B. Frischer, J. Webb Crawford & D. Koller (ed.)
archaeological prospection of the Roman town Proceedings of the 37th Computer Applications to
of Aregenua, in B. Jennings, C. Gaffney, Archaeology Conference (CAA 2009): 1–17.
T. Sparrow & S. Gaffney (ed.) 12th International Williamsburg (VA): Colonial Williamsburg
Conference on Archaeological Prospection, Foundation.
Bradford, 12th–16th September 2017: 138–39. Piro, S., P. Mauriello & F. Cammarano. 2000.
Oxford: Archaeopress. Quantitative integration of geophysical methods
Johnson, P. & M. Millett (ed.). 2013. for archaeological prospection. Archaeological
Archaeological survey and the city. Oxford: Oxbow. Prospection 7: 203–13.
https://doi.org/10.2307/j.ctvh1dwwz https://doi.org/10.1002/1099-0763(200012)
Keay, S.J., M. Millett, S. Poppy, J. Robinson, 7:43.0.CO;2-T
J. Taylor & N. Terrenato. 2000. Falerii Novi: Scheidel, W., I.M. Morris & R.P. Saller (ed.).
a new survey of the walled area. Papers of the 2007. The Cambridge economic history of the
British School at Rome 68: 1–93. Greco-Roman world. Cambridge: Cambridge
https://doi.org/10.1017/S0068246200003871 University Press.
Kvamme, K.L. 2006. Integrating multidimensional https://doi.org/10.1017/CHOL9780521780537
geophysical data. Archaeological Prospection 13: Schmidt, A. & E. Ernenwein. 2011. Guide to good
57–72. https://doi.org/10.1002/arp.268 practice: geophysical data in archaeology (2nd
Linck, R., J.W.E. Fassbinder & S. Buckreuss. edition). York: Archaeology Data Service.
2012. Integrated geophysical prospection by Available at:
high-resolution optical satellite images, synthetic http://guides.archaeologydataservice.ac.uk/g2gp/
aperture radar and magnetometry at the example Geophysics_Toc (accessed 121 April 2020).
of the UNESCO World Heritage Site of Palmyra Soille, P. 2002. On morphological operators based
(Syria). Proceedings of Archaeology and on rank filters. Pattern Recognition 35: 527–35.
Geoinformatics 7: 1–26. https://doi.org/10.1016/S0031-3203(01)00047-4
© Antiquity Publications Ltd, 2020
722
https://doi.org/10.15184/aqy.2020.82 Published online by Cambridge University PressGround‐penetrating radar survey at Falerii Novi
di Stefano Manzella, I. 1979. Falerii Novi negli challenges in the archaeological interpretation of
scavi degli anni 1821–30. Rome: L’Erma’ di geophysical data, in R. Persico, S. Piro &
Bretschneider. N. Linford (ed.) Innovation in near-surface
Verdonck, L. 2016. Detection of buried wall geophysics: instrumentation, application and data
remains in ground-penetrating radar data using processing methods: 151–94. Amsterdam:
template matching. Archaeological Prospection 23: Elsevier.
257–72. https://doi.org/10.1002/arp.1540 https://doi.org/10.1016/B978-0-12-812429-1.
Verdonck, L. & D. Taelman. 2012. 00006-4
Ground-penetrating radar survey at Ammaia, in Vermeulen, F., S. Keay, G.-J. Burgers & C. Corsi
C. Corsi & F. Vermeulen (ed.) Ammaia I: the (ed.). 2012. Urban landscape survey in Italy and
survey. A Romano-Lusitanian townscape revealed: the Mediterranean. Oxford: Oxbow.
69–81. Ghent: Academia. https://doi.org/10.2307/j.ctvh1dk2b
Verdonck, L., D. Taelman, F. Vermeulen & Wallace-Hadrill, A. 2013. Planning the
R. Docter. 2015. The impact of spatial sampling Roman city: grids and divergences at Pompeii
and migration on the interpretation of complex and Falerii Novi, in H. Eckardt & S. Rippon
archaeological ground-penetrating radar data. (ed.) Living and working in the Roman world:
Archaeological Prospection 22: 91–103. essays in honour of Michael Fulford (Journal of
https://doi.org/10.1002/arp.1501 Roman Archaeology Supplementary Series 95):
Verdonck, L., P. de Smedt & J. Verhegge. 2019. 75–93. Portsmouth (RI): Journal of Roman
Making sense of anomalies: practices and Archaeology.
© Antiquity Publications Ltd, 2020
723
https://doi.org/10.15184/aqy.2020.82 Published online by Cambridge University PressYou can also read