Gene flow in a pioneer plant metapopulation (Myricaria germanica) at the catchment scale in a fragmented alpine river system
←
→
Page content transcription
If your browser does not render page correctly, please read the page content below
www.nature.com/scientificreports
OPEN Gene flow in a pioneer
plant metapopulation
(Myricaria germanica)
at the catchment scale
in a fragmented alpine river system
Sabine Fink1*, Andrea Hoppler‑Wiedmer1, Veronika Zengerer1, Gregory Egger2,3,
Martin Schletterer3,4 & Christoph Scheidegger1
River alterations for natural hazard mitigation and land reclamation result in habitat decline
and fragmentation for riparian plant species. Extreme events such as floods are responsible for
additional local species loss or population decline. Tributaries might provide refugia and subsequent
source populations for the colonization of downstream sites in connected riverine networks with
metapopulations of plant species. In this study, we analyzed the metapopulation structure of the
endangered riparian shrub species Myricaria germanica along the river Isel, Austria, which is part of
the Natura 2000 network, and its tributaries. The use of 22 microsatellite markers allowed us to assess
the role of tributaries and single populations as well as gene flow up- and downstream. The analysis of
1307 individuals from 45 sites shows the influence of tributaries to the genetic diversity at Isel and no
overall isolation by distance pattern. Ongoing bidirectional gene flow is revealed by the detection of
first-generation migrants in populations of all tributaries as well as the river Isel, supporting upstream
dispersal by wind (seeds) or animals (seeds and pollen). However, some populations display significant
population declines and high inbreeding, and recent migration rates are non-significant or low. The
genetic pattern at the mouth of river Schwarzach into Isel and shortly thereafter river Kalserbach
supports the finding that geographically close populations remain connected and that tributaries
can form important refugia for M. germanica in the dynamic riverine network. Conservation and
mitigation measures should therefore focus on providing sufficient habitat along tributaries of various
size allowing pioneer plants to cope with extreme events in the main channel, especially as they are
expected to be more frequent under changing climate.
Riparian habitats along rivers are of major importance for biodiversity worldwide as they offer high species
diversity1 and many ecosystem f unctions2. Centuries of river alterations for land reclamation have resulted in
habitat reduction and fragmentation especially for sessile riparian plant s pecies3,4. Extreme events such as large
opulations5 and are likely to increase under changing
floods are often responsible for local extinction of plant p
climate6–8. Tributaries might provide refugia and subsequent source populations for the colonization of down-
stream sites in connected riverine n etworks5,9–11.
Connectivity between tributaries and downstream rivers is especially important for plant species inhabiting
the ever-changing dynamic riverine zone, as local loss or population decline is frequent already at yearly return-
ing floods12, despite plants being highly adapted to changing environmental conditions13. To counteract genetic
diversity loss by reduced local density, functional metapopulation networks connecting populations up- and
downstream of rivers are necessary14.
1
Swiss Federal Institute for Forest, Snow and Landscape Research, WSL, Zürcherstrasse 111, 8903 Birmensdorf,
Switzerland. 2Institute of Geography and Geoecology (IFGG), Karlsruhe Institute of Technology (KIT), Josefstrassse
1, 76437 Rastatt, Germany. 3Institute of Hydrobiology and Aquatic Ecosystem Management, University of Natural
Resources and Life Sciences (BOKU), Gregor‑Mendel‑Strasse 33, 1180 Vienna, Austria. 4Tiroler Wasserkraft AG
(TIWAG), Eduard‑Wallnöfer‑Platz 2, 6020 Innsbruck, Austria. *email: sabine.fink@wsl.ch
Scientific Reports | (2022) 12:8570 | https://doi.org/10.1038/s41598-022-12172-x 1
Vol.:(0123456789)
www.nature.com/scientificreports/
Figure 1. Austria (a) with the river Isel and its tributaries in East Tyrol, before they flow into the river Drau
(b). The sites where Myricaria germanica has been sampled along the Tauernbach, Kleine Isel, Schwarzach,
Kalserbach, and Daberbach as well as the populations along Isel are shown (c): Populations of different size were
sampled (size of black dots representative of number of individuals). The river (blue) and riverscape morphology
including canyons (light grey river course), dams and embankments (dark grey triangles), and the digital terrain
model (DTM from Land Tirol, data.tirol.gv.at) are shown in the background.
Studies on genetic diversity have shown the importance of upstream as well as downstream dispersal for
riparian species15. Many plant species in habitats close to the waterline display seed morphologies suitable
for wind and water dispersal16, as well as animal-mediated dispersal mechanisms17,18. Despite many means of
propagation, riparian metapopulations are generally genetically highly structured and e.g. show isolation by
distance patterns11,19–21. Water mediated dispersal (hydrochory) might enhance connectivity to distant popula-
tions downstream21,22, but gene flow along catchments can be highly impacted by barriers such as canyons or
reservoirs23.
Neutral genetic markers allow to investigate if gene flow and therefore functional connectivity is still present
along river n etworks24,25, if there is local population d
ecline26, or ongoing m
igration27 despite fragmented habitat.
This information is crucial to assess the importance of tributaries and the contribution of single populations to
genetic diversity further up- or downstream28,29.
In this study, we investigate connectivity along the river Isel and its tributaries by analysing genetic diversity
patterns for the characteristic and endangered riparian shrub species, the German tamarisk, Myricaria german-
ica13,30. This catchment offers a high number of populations of the pioneer plant of the dynamic riverine z on31
despite natural canyons, many hydro-morphological river alterations in the past (land use and flood protection)
as well as barriers linked to hydropower. The analysis of 45 sites with both small and large (more than 30 indi-
viduals) populations within the catchment allows to assess the influence of tributaries on the genetic diversity
as well as the connectivity between sites. If gene flow between populations persists, the tributaries and the main
reach should reveal similar genotype compositions, and only low population differentiation.
As isolation by distance patterns and high genetic structure in riparian metapopulations indicate short dis-
tance wind-mediated upstream and downstream dispersal to have a higher impact than long-distance water-
mediated dispersal24, the highly variable microsatellite markers are applied to reveal the primary mechanism of
dispersal and if unidirectional or bidirectional gene flow along the river network is more frequent. Moreover, we
determine the presence of migrants and migration rates, as ongoing gene flow would support intact functional
connectivity along Isel and its tributaries.
Results
A total of 1307 individuals were analyzed from 45 sites (Fig. 1). Sites and populations including age structure
were described in detail in the project documentation (see Supplementary Information Table 1 and in32,33).
Populations showed high numbers of polymorphic loci out of the 22 loci analyzed (Table 1). Private alleles were
not found for any population, and genetic diversity analyzed as expected heterozygosity estimates were low for
most populations with a maximum of 0.34 for one site at Isel (I-05). Inbreeding coefficients are high for several
sites along Isel (I-06: 0.63; I-01: 0.86), Schwarzach (S-08: 0.72; S-04: 0.76, see Table 1). Contrary to that, two
sites, one at Isel and one at Schwarzach, have negative F
IS-values indicating a proportion of outbred individuals
(I-04 and S-07 see Table 1).
FST-values revealed high values and significant differentiation between most populations (Supplementary
Information, Table 2). Of the 44 populations analysed, 12 showed indications for heterozygote excess as analysed
Scientific Reports | (2022) 12:8570 | https://doi.org/10.1038/s41598-022-12172-x 2
Vol:.(1234567890)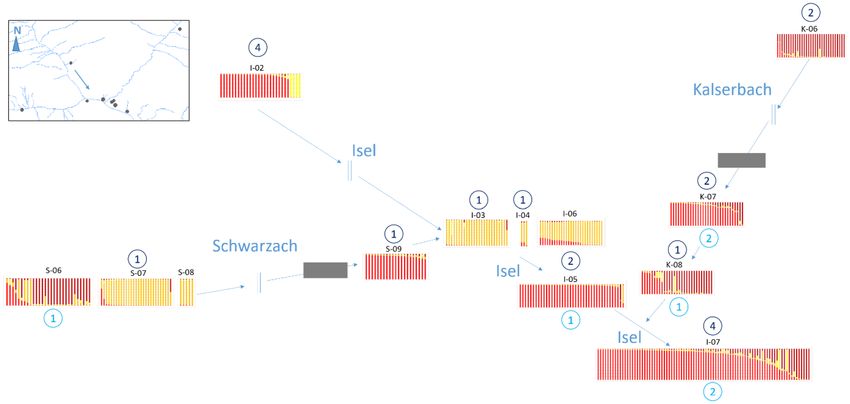
www.nature.com/scientificreports/
ID River River km** Year n Polymorphic Loci HE FIS
KI-01 Kleine Isel 47,4 2018 37 10 0.297 0.353
KI-02 Kleine Isel 0,4 2018 28 5 0.284 0.286
KI-03 Kleine Isel 38,2 2018 50 8 0.256 0.393
KI-04 Kleine Isel 34,1 2018 14 5 0.258 0.141
KI-05 Kleine Isel 34,1 2018 28 5 0.309 − 0.033
KI-06 Kleine Isel 33,4 2018 20 7 0.202 0.163
KI-07 Kleine Isel 32,0 2018 14 4 0.251 0.216
KI-08 Kleine Isel 30,7 2014 35 10 0.249 0.430
I-01 Isel 24,1–22,5 2014 28 13 0.296 0.864
I-02 Isel 21,6 2018 2 4 0.222 0.200
I-03 Isel 20,2 2018 25 6 0.192 0.497
I-04 Isel 20,1 2018 5 2 0.159 − 0.111
I-05 Isel 19,9–19,6 2014 40 12 0.215 0.313
I-06 Isel 19,8 2018 27 3 0.224 0.625
I-07 Isel 19–18,3 2016 87 15 0.285 0.368
I-08 Isel 17,8–16,1 2016 81 15 0.280 0.326
I-09 Isel 12,1 2016 29 14 0.292 0.412
I-10 Isel 10,8–10,5 2014 31 15 0.335 0.482
I-11 Isel 10,5–9,9 2016 37 14 0.316 0.254
I-12 Isel 7,3 2016 3 10 0.258 0.556
I-13 Isel 5,0–4,6 2016 56 15 0.278 0.300
T-01 Tauernbach 0,0–0,1 2014 31 10 0.253 0.319
T-02 Tauernbach 0,0–0,1 2018 34 11 0.203 0.330
T-03 Tauernbach 5,3 & 5,1 2018 9 11 0.257 0.475
T-04 Tauernbach 2,7–2,5 2014 32 12 0.285 0.350
T-05 Tauernbach 3,0 – 2,6 2018 36 9 0.307 0.336
S-01 Schwarzach 28,6–28,9 2016 31 11 0.288 0.624
S-02 Schwarzach 23,5–23,7 2016 33 11 0.252 0.497
S-03 Schwarzach 14,9–15,0 2014 31 11 0.225 0.448
S-04 Schwarzach 6,7 2016 3 9 0.306 0.765
S-05 Schwarzach 3,3–3,4 2014 31 11 0.288 0.437
S-06 Schwarzach 3,3–3,4 2018 29 9 0.279 0.480
S-07 Schwarzach n/a 2018 5 2 0.078 − 0.333
S-08 Schwarzach 3,5–3,7 2018 29 5 0.302 0.716
S-09 Schwarzach 0,3 2016 21 11 0.223 0.426
K-01 Kalserbach 16,9–17,0 2016 33 12 0.295 0.471
K-02 Kalserbach 15,8–16,1 2016 31 10 0.258 0.386
K-03 Kalserbach 0,5–0,6 2018 22 0 0.276 0.202
K-04 Kalserbach 7,5 -10,0 2018 42 0 0.332 0.134
K-05 Kalserbach 8,1–8,2 2014 30 13 0.315 0.410
K-06 Kalserbach 6,6–5,9 2014 31 14 0.320 0.444
K-07 Kalserbach 0,2–0,3 2014 29 13 0.320 0.594
K-08 Kalserbach 0,0–0,1 2014 30 12 0.243 0.262
D-01 Daberbach* 0,4 2016 1 4 0.182 0.000
D-02 Daberbach 0,4 2018 24 9 0.281 0.487
Table 1. Overview of sampling sites in the years 2014 to 2018, and number of samples (n), polymorphic
loci, expected heterozygosity (HE) per site and inbreeding coefficient of populations (FIS). **River kilometer
according to the Austrian riverine network (Berichtsgewässernetz, https://maps.wisa.bmlrt.gv.at/). *Small
tributary to Isel in the downstram area, analysed as part of the Isel river stretch.
under various mutation models and applying different tests in bottleneck (Table 2). Most populations with indi-
cation for limited genetic diversity were found at Kleine Isel (4 out of 7 sites), followed by Isel (3 populations),
Schwarzach (2 populations), Tauernbach (2 populations) and Kalserbach (1 population, see Table 2).
Scientific Reports | (2022) 12:8570 | https://doi.org/10.1038/s41598-022-12172-x 3
Vol.:(0123456789)www.nature.com/scientificreports/
SMM TPM
River Site S-Test p STD-Test p W-Test p Mean HE S-Test p STD-Test p W-Test p
Kleine Isel KI-01 0.01 0.00 1.00 0.24 0.01 0.00 0.99
Kleine Isel KI-02 0.48 0.07 0.87 0.23 0.48 0.16 0.84
Kleine Isel KI-03 0.30 0.14 0.63 0.20 0.30 0.32 0.48
Kleine Isel KI-04 0.24 0.28 0.72 0.19 0.28 0.37 0.66
Kleine Isel KI-05 0.08 0.02 0.96 0.25 0.34 0.06 0.91
Kleine Isel KI-06 0.00 0.00 1.00 0.22 0.01 0.00 1.00
Kleine Isel KI-07 0.22 0.01 0.95 0.19 0.20 0.04 0.95
Isel KI-08 0.51 0.48 0.46 0.18 0.52 0.31 0.38
Isel I-01 0.34 0.41 0.61 0.23 0.58 0.44 0.39
Isel I-02 na* na na na na na na
Isel I-03 0.19 0.00 0.96 0.21 0.21 0.00 0.95
Isel I-04 na na na na na na na
Isel I-05 0.39 0.20 0.77 0.15 0.41 0.29 0.72
Isel I-06 0.48 0.32 0.37 0.15 0.44 0.24 0.27
Isel I-07 0.03 0.00 0.99 0.22 0.23 0.04 0.92
Isel I-08 0.07 0.00 0.98 0.21 0.20 0.04 0.96
Isel I-09 0.30 0.21 0.77 0.23 0.32 0.36 0.64
Isel I-10 0.50 0.34 0.60 0.28 0.55 0.48 0.47
Isel I-11 0.19 0.14 0.79 0.25 0.20 0.32 0.64
Isel I-12 na na na na na na na
Isel I-13 0.07 0.00 1.00 0.21 0.09 0.03 0.99
Tauernbach T-01 0.07 0.19 0.12 0.19 0.06 0.11 0.08
Tauernbach T-02 0.10 0.01 0.01 0.21 0.03 0.01 0.00
Tauernbach T-03 na na na na na na na
Tauernbach T-04 0.08 0.02 0.01 0.22 0.02 0.01 0.00
Tauernbach T-05 0.48 0.50 0.36 0.25 0.55 0.37 0.34
Schwarzach S-01 0.18 0.12 0.12 0.23 0.16 0.05 0.09
Schwarzach S-02 0.53 0.28 0.68 0.19 0.28 0.48 0.58
Schwarzach S-03 0.25 0.41 0.68 0.16 0.26 0.49 0.55
Schwarzach S-04 na na na na na na na
Schwarzach S-05 0.38 0.13 0.04 0.23 0.01 0.07 0.00
Schwarzach S-06 0.57 0.08 0.79 0.21 0.40 0.18 0.71
Schwarzach S-07 na na na na na na na
Schwarzach S-08 0.60 0.16 0.55 0.24 0.59 0.33 0.45
Schwarzach S-09 0.01 0.00 0.99 0.15 0.01 0.00 0.99
Kalserbach K-01 0.27 0.16 0.19 0.23 0.26 0.08 0.09
Kalserbach K-02 0.24 0.14 0.12 0.19 0.22 0.09 0.10
Kalserbach K-03 0.05 0.07 0.87 0.22 0.05 0.12 0.84
Kalserbach K-04 0.08 0.04 0.96 0.27 0.08 0.15 0.86
Kalserbach K-05 0.58 0.43 0.39 0.25 0.21 0.39 0.27
Kalserbach K-06 0.51 0.49 0.50 0.26 0.52 0.30 0.29
Kalserbach K-07 0.05 0.09 0.86 0.26 0.05 0.24 0.77
Kalserbach K-08 0.01 0.00 0.99 0.18 0.01 0.02 0.97
Daberbach D-01 na na na na na na na
Daberbach D-02 0.45 0.42 0.50 0.26 0.42 0.43 0.45
Table 2. Results of test for bottleneck using assumptions of the stepwise mutation model (SMM) and a
two-phase model (TPM, combination of 90% of SMM and 10% of IAM) for sites along Isel and its tributaries.
p-values of sign test (S-Test), standardized difference test (STD-Test), and one-tailed Wilcoxon sign-rank
test (W-Test) as well as the mean expected heterozygosity (mean HE) for der TPM model are given, with
significant values (< 0.05) highlighted in bold. *na for sites with < 10 indviduals.
The results of the AMOVA analysis revealed that the lowest genetic diversity was found between rivers
(8.14%, df = 7, Sum of squares = 570.676) and between populations within each river (13.99%, df = 38, Sum of
squares = 600.508). Highest variance was within individuals (45.94%, df = 1307, Sum of squares = 1192.5) and
within populations (31.93%, df = 1315, Sum of squares = 2748.048).
Scientific Reports | (2022) 12:8570 | https://doi.org/10.1038/s41598-022-12172-x 4
Vol:.(1234567890)www.nature.com/scientificreports/
Figure 2. Genetic structure along Isel and its tributaries. For each sampled site, the percentage of genotypes
assigned to each of the four groups is shown (displayed in red, orange, yellow and brown, sorted by site see
Table 1). The tributaries Tauernbach (north, mainly yellow and red), Kleine Isel (north-west, mainly orange),
Schwarzach (west, mainly red) and Kalsersbach (east, mainly brown) all contribute to the high diversity at
Isel. The high genetic diversity in the area where Schwarzach and Kalserbach flow into Isel is subsequently
lost further downstream, where a majority of genotypes is assigned to one group (red), before the inflow of
Daberbach (contribution of yellow group).
The analysis in Structure Harvester revealed that the most likely number of groups of genotypes could be
assigned to K = 4 (Supplementary Inforamtion, Fig. 1). The resulting genotype assignment at the population level
revealed some gradients, with considerable changes in genotype group assignment of Kleine Isel, Tauernbach
and Kalserbach compared to Isel river (Fig. 2, details for values see also Supplementary Information Table 3),
but no unique gene pool was found for any river. By comparing genetic differentiation (FST) and distances along
rivers, no isolation by distance pattern was detected (correlation between pairwise FST and geographic distance,
R2 = 0.0176, Mantel test, p = 0.6).
A total of 80 individuals of the 1307 analyzed were more probable to originate from other populations than
they were found in (p < 0.01). Of the 45 sites studied, 30 showed individuals which are most likely first-generation
migrants from another population (Table 3, p < 0.01). Most migrants per site were detected in two population
at Isel (I-08 and I-09), and potential sources were traced to upstream tributaries but also to other sites at Isel
downstream. Similar to the findings for Isel, sources of migrants were assigned to both up- as well as down-
stream sites for all tributaries (Table 3 and Fig. 3). We detected mainly of non-significant recent migration rates
(Supplementary Information, Table 4). The only significant values > 0.2 were obtained for geographically close
populations at Kleine Isel (KI-02, KI-04, KI-05, KI-06, KI-07), as well as the close populations at the junction of
Isel and Schwarzach (I-07, I-08, S-09, Supplementary Information, Table 4).
Discussion
Genetic diversity of the Isel metapopulation. The German tamarisk displays many populations along
the Isel catchment despite changes in river morphology and dynamics by humans (see Fig. 1 as well as i n31). Our
comprehensive study on both large and small populations shows that genetic diversity is especially high at the
large populations at the Isel river where also patterns of population demography indicate ongoing rejuvenation.
Contrary to the general situation at the main Isel reach (downstream of Matrei i.O.), many populations of
various size within the catchment show high inbreeding. As the German tamarisk is capable of selfing23, even
large populations might display low genetic diversity due to few founders and genetic d rift34, similar to other
shrub species in dynamic e nvironments35. This is apparent in a population at Isel, occurring after the junction
with Schwarzach and Kalserbach, which has a long history of German tamarisk presence31,36. Despite a large
population size, the central position in the riverine network and no barrier limiting dispersal, signs of inbreed-
ing and a bottleneck were detected at this site. This stresses the importance of genetic analyses to assess the
comprehensive diversity of a single p opulation37, and the full impact of a site to a metapopulation network5,14.
Genetic diversity patterns are reflecting habitat fragmentation due to river morphology and c onnectivity38–40,
providing valuable insights for conservation measures when linked to demographic and topographic d ata41.
In the headwaters (Kleine Isel) and the tributary Tauernbach, detected reduced genetic diversity is reflecting
limited connectivity due to topographical characteristics31,42,43. Similarly, the signs of bottlenecks at two sites
close to the confluence with Isel of Schwarzach (S-09) and of Kalserbach (K-08) are most probably due to the
location downstream of canyons, which are responsible for habitat fragmentation and non-functional connection
Scientific Reports | (2022) 12:8570 | https://doi.org/10.1038/s41598-022-12172-x 5
Vol.:(0123456789)www.nature.com/scientificreports/
Individuals sampled Immigrant and sources
Site River Total Upstream Downstream
KI-01 Kleine Isel 2 1 × K, 1 × I
KI-02 Kleine Isel
KI-03 Kleine Isel
KI-04 Kleine Isel
KI-05 Kleine Isel
KI-06 Kleine Isel
KI-07 Kleine Isel 1 1×T
KI-08 Isel 3 3×I
I-01 Isel 4 4×T
I-02 Isel
I-03 Isel 1 1×T
I-04 Isel 1 1 × KI
I-05 Isel 3 2×K 1×I
I-06 Isel
I-07 Isel 6 4×K 2×I
I-08 Isel 6 2 × K, 2 × S, 1 × T 1×I
I-09 Isel 3 2×I 1×I
I-10 Isel 4 1 × I, 1 × K 2×I
I-11 Isel
I-12 Isel 1 1×I
I-13 Isel 4 2×K 2×I
T-01 Tauernbach 2 1 × I, 1 × T
T-02 Tauernbach 6 6×T
T-03 Tauernbach
T-04 Tauernbach 1 1×I
T-05 Tauernbach
S-01 Schwarzach 5 5×S
S-02 Schwarzach 1 1×I
S-03 Schwarzach
S-04 Schwarzach 1 1×I
S-05 Schwarzach 3 3×I
S-06 Schwarzach 1 1×I
S-07 Schwarzach 1 1×T
S-08 Schwarzach
S-09 Schwarzach 1 1×S
K-01 Kalserbach 4 4×K
K-02 Kalserbach 1 1×S
K-03 Kalserbach
K-04 Kalserbach
K-05 Kalserbach 1 1×K
K-06 Kalserbach 2 2×K
K-07 Kalserbach 2 1×S 1×I
K-08 Kalserbach 3 2×S 1×K
D-01 Dabernbach
D-02 Dabernbach 4 2 × T, 1 × I 1×I
Table 3. Detection of first-generation migrants in populations along Isel and its tributaries, and their most
probable upstream and downstream source populations (p < 0.01). KI = Kleine Isel, I = Isel, T = Tauernbach,
S = Schwarzach, K = Kalserbach, D = Dabernbach.
to upstream populations by wind-mediated dispersal (see in23). However, the genetic diversity pattern at the
catchment revealed that downstream transport via canyons (i.e. by floating seeds or vegetative dispersal by plant
ramnets) has been possible through the Kalserbachklamm, the Defregger-Klamm and the Prosseggklamm,
similar to findings for other riparian s pecies44.
Scientific Reports | (2022) 12:8570 | https://doi.org/10.1038/s41598-022-12172-x 6
Vol:.(1234567890)www.nature.com/scientificreports/
Figure 3. Genetic structure and number of migrants at the junction of Schwarzach (left), Kalserbach (right)
and Isel (center) along the rivers (blue lines). The four genotype groups are represented in different colours (red,
orange, yellow and brown) and number of immigrants from a source upstream (dark blue) and downstream
(light blue) are shown in circles. Although two sites (one at Schwarzach and one at Kalserbach) are separated
from the next source population upstream by canyons (grey blocks), they show immigrants from upstream.
Geographically close populations next to the inlet of Kalserbach all show migrants from downstream sites.
The role of tributaries on gene flow. Contrary to findings of high differentiation along rivers for other
riparian plant species (by diaspore m imics45, studies on woody riparian g uildes46, and studies on floodplain
meadow species47), the tributaries of Isel do not display unique gene pools or clear isolation by distance pat-
terns, as e.g. found for fish48. Still, some tributaries showed higher percentage of certain groups of genotypes
(e.g. Tauernbach, see Fig. 2) as well as some gradients along the river (e.g. Schwarzach, west–east gradient fol-
lowing flow direction, see Fig. 2). Similar to findings for M. germanica populations in other c ountries23,49 as well
as other riparian s pecies20,21, the studied populations were highly differentiated in pairwise comparisons. This
pattern reflects a typical metapopulation for a species with various dispersal mechanisms (see in24), which has
been found for other riparian plant species in the dynamic riverine z one50.
Recent migrants were detected both between large as well as small populations, although contemporary
migration rates were small. This indicates that individuals of tributaries might have been sources for long distance
dispersal downstream (e.g. by vegetative dispersal) during extreme flood e vents24, despite being isolated under
steady-state-conditions (e.g. Daberbach, see Fig. 2). First-generation immigrants (as detected at two sites) can
lead to increased genetic diversity in future generations if the habitat is suitable for local species e xpansions51.
Especially interesting for metapopulation studies along rivers are junctions, as they form unique riparian habi-
tats and allow to assess the impact of single inlets on the genetic diversity at the catchment52. The genetic structure
of populations at junctions can further reveal functional connectivity up- and downstream at a small s cale25. At
the junction of Schwarzach and Kalserbach with Isel, the populations of the tributaries are more related to the
populations at Isel downstream than to the other sites at the tributaries upstream, partly also due to the canyons
(Fig. 3). With all populations showing at least one migrant in this geographically limited area, the junction is
a hotspot of gene flow both up-and downstream, and therefore a focal point in the metapopulation network53.
Directional gene flow and importance of barriers to dispersal. First-generation migrants can
reflect vegetative as well as propagule dispersal, as the German tamarisk is capable of both18. While vegetative
dispersal is unidirectional by water flow, seed dispersal by wind is common for the German tamarisk54 and is
playing an important role for functional connectivity for many riparian s pecies15. The lack of an isolation by dis-
tance pattern and the detection of migrants both from upstream and downstream sources suggest bidirectional
gene flow mainly by wind dispersal, similar to previous fi ndings49. Hydrochory is less likely, given the high num-
ber of human-made barriers such as check dams along the Isel catchment, which likely inhibit water-mediated
dispersal 4,23,55.
Long-distance wind dispersal seems to be rare (but see15), but for the German tamarisk it has even been
previously detected even between catchments49. Additionally, gene flow over long distances is possible also by
pollen mediated dispersal18, and insect pollinators can cross barriers to both water- and wind-mediated gene
flow. The current genetic structure indicates that M. germanica can partially overcome both natural canyons and
man-made check dams along Isel and its tributaries, although limitations in gene flow might only be detectable
after a certain time26.
Scientific Reports | (2022) 12:8570 | https://doi.org/10.1038/s41598-022-12172-x 7
Vol.:(0123456789)www.nature.com/scientificreports/
Unexpected re-colonization of isolated sites could be linked to human-mediated dispersal by gravel extrac-
tion or relocation during or after construction along rivers, as seen at a site within a series of sediment check
dams at Ködnitzbach (a tributary to Kalserbach), where a large population was established at the small gravel
bar within the highly impacted river stretch K-03, see Fig. 2 and32. This is similar to findings of another study
after sediment check dam construction56. The fate of such populations remains unclear, as subsequent lack of
sediment and hydrological dynamics can influence population persistence, e.g. by preventing r ejuvenation57.
Management and conservation implications. Due to the lack of a long-term monitoring of the meta-
population at Isel36, indirect evidence for ongoing functional connectivity as provided by this study is necessary
for management planning for the river stretches within the Natura 2000 area. Although habitat fragmentation is
present (e.g. natural canyons, lateral embankments and check dams), the metapopulation network is function-
ally connected. Still, management strategies are necessary, as M. germanica populations are frequently found in
dynamic riverine zones, which are subject to major loss during extreme events (such as H Q30 or H
Q100 flood
events). As populations with mainly young individuals show less genetic diversity than sites with older plants,
the main focus of conservation strategies should be on protecting large populations with diverse age classes. As
all tributaries contribute to the gene pool, sheltered and currently more isolated sites (e.g. Daberbach) might
provide important refugia and sources for subsequent re-colonization after extreme events as exemplified b y58.
For management planning, knowledge on species’ dispersal mechanisms is especially important for species
inhabiting rivers and r iverscapes59. Wind-mediated dispersal with a continuous supply of seeds during s ummer54
together with pollen mediated gene flow mainly allow for shorter dispersal distances60. Smaller populations or
less persistent sites in highly dynamic riverine zones might provide important short-term nodes in the metap-
opulation network52, and currently unsuitable habitat should be restored to provide a better network. The overall
habitat loss, e.g. due to hydro-morphological changes like channelization, is the major threat for M. germanica,
and therefore, re-introduction projects are often initiated in revitalization projects such as river widenings
e.g.61–63. If human mediated re-introductions of individual plants or seeds are considered, they should only use
material originating from the closest populations along the tributary, given the genetic differentiation detected
in this study. A future monitoring of sites and population structures as well as changes in genetic diversity would
allow to assess the status and development of the German tamarisk along Isel based on the presented study.
Conclusions. Our study on the genetic diversity of M. germanica along the Isel and its tributaries provides
a first comprehensive overview of the metapopulation, and highlights the importance of tributaries within the
catchment for maintaining gene flow. Both large and small populations might play important roles in the meta-
population network, but are equally subject to population declines. Conservation management of the Isel and its
tributaries should therefore focus on enabling habitat formation or restoring habitat for the German tamarisk,
with a special focus on the migration hotspots at the junctions. This ensures the survival of M. germanica under
expected more frequent and more intense extreme events such as floods due to changing climate despite frag-
mented habitat.
Methods
Study species. The German tamarisk, Myricaria germanica (L.) Desv., is the main indicator for the pro-
tected habitat “Alpine rivers and their ligneous vegetation with Myricaria germanica”, Natura 2000 code 3230 for
a study on the habitat, e.g.64. In Tyrol, M. germanica is protected since 2005 (Tiroler Naturschutzgesetz, Article
23, attachment IV lit.b) and the manipulation of the plant as well as habitat changes resulting in loss of indi-
viduals is prohibited (Ordinance of Nature protection, Verordnung der Tiroler Landesregierung 2006, Article 1
and 2). Over the last decade, the species showed a severe decline along European rivers30,36. As a typical pioneer
species on gravel banks and bars, the German tamarisk is threatened, if sediment and hydrological dynamics
are restricted.
The shrubs can reproduce vegetative by re-rooting of branches, but also produce seeds that germinate within
48 h after seed landing65. Juvenile plants reach age of first flowering after 1–2 years see also16,64, and the sentenced
flowers are pollinated by insects18. Additionally, the plant is reported to be capable of s elfing23. As it provides
nutrition for insects such as honey bees, recommendations for the cultivation of the shrub along rivers in order
to improve the honey yield were promoted in Tyrol in the mid-twentieth c entury66. Seeds of the German tama-
risk have a pappus, facilitating both wind- and water-mediated d ispersal43,67. For wind-mediated dispersal, the
majority of seeds were found close to the mother plant, but dispersal kernels show long tails54, with rare long-
distance dispersal of several k ilometers43. While water-mediated dispersal is known as long distance dispersal for
many riparian p lants68, dams and canyons are reported to inhibit water-mediated dispersal of M. germanica23.
Study site: Isel and tributaries. This study focuses on the river Isel (ca. 50 km) in East Tyrol, Austria,
and its tributaries: North to South: Tauernbach (17 km), Schwarzach (43 km) and Kalserbach (17 km) as well
as the small stream Daberbach (3 km, Fig. 1). The river Isel is usually referred to as “Kleine Isel” upstream of
the junction with Tauernbach and thereafter as “Isel” further downstream. In 2015, the Isel and stretches along
the tributaries Kalserbach and Schwarzach (“Osttiroler Gletscherflüsse Isel, Schwarzach und Kalserbach”) were
designated as Natura 2000 area (see https://natura2000.eea.europa.eu/Natura2000, site code AT3314000).
In the Isel catchment mean annual temperatures of 0.5–1 °C and precipitation of 1400–1500 mm per year
were recorded, with high amounts of snow and ice in W inter69. Along the tributaries of the Isel, many construc-
tions to prevent natural hazards such as sediment check dams are established, and there are also some barriers
related to hydropower (see Fig. 1). The Isel and its tributaries have been monitored in the past for the presence
Scientific Reports | (2022) 12:8570 | https://doi.org/10.1038/s41598-022-12172-x 8
Vol:.(1234567890)www.nature.com/scientificreports/
of M. germanica31,36 and mainly provide habitat for the study species where the shoreline of the river is not
stabilized by lateral embankment or where the formation of gravel banks is possible due to wide river s ection31.
The Tauernbach mainly consists of deep canyons upstream and has artificial side banks along the down-
stream regions, but the stretch below the canyon Prosseggklamm (see Fig. 1) offers habitat to pioneer vegeta-
tion including the study species31. Similarly, large canyons in the lower course the Kalserbach (Kalserklamm)
and the Schwarzach (Defregger Klamm) display German tamarisks upstream and downstream of the canyons
(Fig. 1). However, long stretches of these tributaries are also stabilized by lateral embankments, reducing the
habitat availability for the German tamarisk. Therefore, the study region covers both sites with large, long-term
persistent populations but also more remote sites with few individuals.
Field work. Field work along Isel and its tributaries was performed from 2014 to 2018, and a total of 45 sites
were sampled (Table 1). All individual plants were recorded using GPS (Garmin Oregon 700). To assess the
population structure at each site, plants were assigned to four age categories as defined in previous s tudies69. For
large populations with over 30 individuals, at least 30 samples per sites were collected, while all individuals were
sampled at sites with few shrubs (see Table 1). For each sampled individual, plant leave material was collected,
dried with Silica gel (Silica Gel Orange, ROTH, Nr. P077.1) and subsequently stored at − 20 °C. All methods were
performed in accordance with relevant guidelines and regulations.
Genetic analysis. For each sample, 15 mg ± 3 mg leave material was lyophilized (BETA 1-8 L0 plus, Christ,
at 40 bar and − 55 °C) prior to total DNA extraction ( DNeasy®96 Plant Kit, Qiagen, Cat.No. 69181). Following the
protocol of70 using Multiplex PCR Master Mix», 2x (Qiagen, No. 1066295), 22 microsatellite loci were analysed
using PCR. All PCR products were diluted (1:2) with ultrapure water, and 1 µL of the mix was added to 9.5 µL
HiDi-LIZ solution (Applied Biosystems, Lot. 1,401,295) and size standard mixture (concentration 15 µl/mL,
GeneScanTM-500 LIZ®, Applied Biosystems, Lot. 1,401,359) for the analysis on a 3730xl DNA Analyzer (ABI,
Applied Biosystems).
Data analysis. Using the software GeneMapper (Applied Biosystems, V5.0), fragment analysis of the 22
microsatellite loci was performed using scoring bin sets of previous studies for details see23,49,70. Fragment length
raw data is available from the authors upon request. The resulting multilocus genotype data of each individ-
ual was formatted and analyzed using the packages “poppr” and “tidyr” in the program R71: polymorphic loci,
private alleles, the expected heterozygosity as well as the inbreeding coefficient ( FIS) were calculated to assess
genetic diversity. Additionally, the program Arlequin 3.572 was used to calculate FST-values for population dif-
ferentiation, and pairwise comparisons to detect significantly differentiated populations.
To identify if single populations underwent a drastic decrease in effective population size, we used the pro-
gram Bottleneck73 for populations with at least 10 individuals. We performed all three tests available in Bottle-
neck, the sign test, standardized difference test73 and the one-tailed Wilcoxon sign-rank test74 to evaluate if the
populations showed a heterozygosity excess or deficit. Expected heterozygosity was based on simulations for
the genetic distribution for each populations under the assumption of two models, as the microsatellite motifs
did not allow to make a prior choice on a single model70: the stepwise mutation model (SMM) and a two-phase
model (TPM) allowing for a combination of 90% of SMM and 10% of infinite allele model.
Molecular variance (AMOVA) within and between populations using Isel and each of its tributaries as a pre-
defined geographic structure (resulting in 6 groups) was performed in Arlequin 3.572. The genetic structure of
the study site was assessed in the program structure 2.3.4, testing for K = 1–45 g roups75, with 1 08 iterations and a
burn-in of 1 04. The output of this Bayesian approach to identify the number of groups the multilocus genotypes
could be assigned to was tested for statistical support in the program Structure H arvester76.
Limitations to gene flow in the study sites as seen in an isolation by distance pattern was tested by a Mantel
test based on the comparison of genetic differentiation ( FST) of populations with more than 10 individuals and
geographic distances along rivers Manteltest in GenAIEx 6.50377. Distances along rivers between the chosen
populations were determined using the package “riverdist” in R 71. To assess if migration between sites is ongo-
27
ing, we applied a Bayesian a pproach to identify migrants using the software G eneClass78. In this program, we
estimated the likelihood of first-generation migrants by assessing the likelihood of an individual multilocus
genotype to originate from the population it was sampled from compared to the likelihood that it is sampled
from another population in the catchment see also i n78. Probability computations (based on Monte-Carlo simula-
tions) were done using the algorithm of P aetkau79 with 100′000 simulated individuals and a 0.01 type I error rate.
To analyze the extent of migration between populations, we used the program BayesAss 3.0.480 implementing
Markov chain Monte Carlo techniques to simulate recent migration rates from allele frequencies of multilocus
genotypes. Following the manual for BayesAss, we first identified suitable mixing parameters for migrations
rates, allele frequencies and inbreeding coefficients to allow for acceptance rates between 20 and 40%, as sug-
gested from empirical a nalyses81. We run simulations with 1 08 iterations and 1 04 million burn-in, and diagnosed
for convergence of chains using the software Tracer 1.782. Runs were repeated with different random seeds and
we then identified a suitable run calculating Bayesian Deviance using the R script as described in83. To identify
significant migration rates, we checked if the 95% Confidence Intervals (CI) excluded 0 84.
Ethics approval. All sampling permits were issued by the Office of the Tyrolean Regional Government
(Amt der Tiroler Landesregierung). Sampling in 2014 and 2016 was carried out on behalf of the Office of the
Tyrolean Regional Government. Sampling in 2018 was carried out based on the permit (for sampling parts of
protected plants) NSCH/N-269/6–2017 from 06.09.2017 (district authority Lienz) and the decision of the State
Administrative Court of Tyrol LVwG-2017/41/2267–19 from 23.05.2018.
Scientific Reports | (2022) 12:8570 | https://doi.org/10.1038/s41598-022-12172-x 9
Vol.:(0123456789)www.nature.com/scientificreports/
Received: 12 November 2021; Accepted: 3 May 2022
References
1. Sabo, J. et al. Riparian zones increase regional species richness by harbouring different, not more, species. Ecology 86, 56–62 (2005).
2. Lind, L., Hasselquist, E. & Laudon, H. Towards ecologically functional riparian zones: A meta-analysis to develop guidelines for
protecting ecosystem functions and biodiversity in agricultural landscapes. J. Environ. Manage. 249, 109391–109391 (2019).
3. Merritt, D., Nilsson, C. & Jansson, R. Consequences of propagule dispersal and river fragmentation for riparian plant community
diversity and turnover. Ecol. Monogr. 80, 609–626 (2010).
4. Jansson, R., Nilsson, C. & Renöfält, B. Fragmentation of riparian floras in rivers with multiple dams. Ecology 81, 899–903 (2000).
5. Mari, L. et al. Metapopulation persistence and species spread in river networks. Ecol. Lett. 17, 426–434 (2014).
6. Blöschl, G. et al. Changing climate both increases and decreases European river floods. Nature 573, 108–111. https://doi.org/10.
1038/s41586-019-1495-6 (2019).
7. Tabari, H. Climate change impact on flood and extreme precipitation increases with water availability. Sci. Rep. 10, 13768. https://
doi.org/10.1038/s41598-020-70816-2 (2020).
8. Wobus, C. et al. Climate change impacts on flood risk and asset damages within mapped 100-year floodplains of the contiguous
United States. Nat. Hazards Earth Syst. Sci. 17, 2199–2211 (2017).
9. Meyer, J. L. et al. The contribution of headwater streams to biodiversity in river networks1. J. Am. Water Resour. Assoc. 43, 86–103.
https://doi.org/10.1111/j.1752-1688.2007.00008.x (2007).
10. Van Looy, K. & Piffady, J. Metapopulation modelling of riparian tree species persistence in river networks under climate change.
J. Environ. Manage. 202, 437–446 (2017).
11. Sochor, M. et al. Can gene flow among populations counteract the habitat loss of extremely fragile biotopes? An example from the
population genetic structure in Salix daphnoides. Tree Genet. Genomes 9, 1193–1205 (2013).
12. Garssen, A. G. et al. Effects of increased flooding on riparian vegetation: Field experiments simulating climate change along five
European lowland streams. Glob. Change Biol. 23, 3052–3063. https://doi.org/10.1111/gcb.13687 (2017).
13. Ellenberg, H. Vegetation Mitteleuropas mit den Alpen in Ökologischer, Dynamischer und historischer Sicht. 6., vollst. neu bearb. und
stark erw. Aufl edn, (Ulmer, 2010).
14. Hanski, I. Metapopulation Biology: Ecology, Genetics, and Evolution (Academic Press, New York, 1997).
15. Wubs, E. R. J. et al. Going against the flow: A case for upstream dispersal and detection of uncommon dispersal events. Freshw.
Biol. 61, 580–595 (2016).
16. Chen, F.-Q. & Xie, Z.-Q. Reproductive allocation, seed dispersal and germination of Myricaria laxiflora, an endangered species in
the Three Gorges Reservoir area. Plant Ecol. 191, 67–75 (2007).
17. Bonn, S. Ausbreitungsbiologie der Pflanzen Mitteleuropas: Grundlagen und kulturhistorische Aspekte. (Quelle und Meyer Verlag,
1998).
18. Müller-Schneider, P. Verbreitungsbiologie der Blütenpflanzen Graubündens: Diasporology of the Spermatophytes of the Grisons. Vol.
85. (Switzerland) (1986).
19. Aradottir, A., Svavarsdottir, K. & Bau, A. Clonal variability of native willows (Salix pylicifofia and Salix lanata) in Iceland and
implications for use in restoration. Icel. Agric. Sci. 20, 61–72 (2007).
20. Egelund, B., Pertoldi, C. & Barfod, A. S. Isolation and reduced gene flow among Faroese populations of tea-leaved willow (Salix
phylicifolia, Salicaceae). N. J. Bot. J. Bot. Soc. B. Isles 2, 9–15 (2012).
21. Van Puyvelde, K. & Triest, L. ISSRs indicate isolation by distance and spatial structuring in Salix alba populations along Alpine
upstream rivers (Alto Adige and Upper Rhine). Belg. J. Bot. 140, 100–108 (2007).
22. Ngeve, M. N., Van der Stocken, T., Sierens, T., Koedam, N. & Triest, L. Bidirectional gene flow on a mangrove river landscape and
between-catchment dispersal of Rhizophora racemosa (Rhizophoraceae). Hydrobiologia 790, 93–108. https://doi.org/10.1007/
s10750-016-3021-2 (2017).
23. Werth, S., Schoedl, M. & Scheidegger, C. Dams and canyons disrupt gene flow among populations of a threatened riparian plant.
Freshw. Biol. 59, 2502–2515 (2014).
24. Pollux, B. J. A., Luteijn, A., Van-Groenendael, J. M., Ouborg, N. J. & Ouborg, N. J. Gene flow and genetic structure of the aquatic
macrophyte Sparganium emersum in a linear unidirectional river. Freshw. Biol. 54, 64–76 (2009).
25. Davis, C., Epps, C., Flitcroft, R. & Banks, M. Refining and defining riverscape genetics: How rivers influence population genetic
structure. Wiley Interdiscip. Rev. Water 5, e1269 (2018).
26. Vega-Retter, C. et al. Dammed river: Short- and long-term consequences for fish species inhabiting a river in a Mediterranean
climate in central Chile. Aquat. Conserv.Mar. Freshw. Ecosyst. 30, 2254–2268. https://doi.org/10.1002/aqc.3425 (2020).
27. Rannala, B. & Mountain, J. L. Detecting immigration by using multilocus genotypes. Proc. Natl. Acad. Sci. U.S.A. 94, 9197–9201
(1997).
28. Altermatt, F., Alther, R. & Mächler, E. Spatial patterns of genetic diversity, community composition and occurrence of native and
non-native amphipods in naturally replicated tributary streams. BMC Ecol. 16, 23. https://doi.org/10.1186/s12898-016-0079-7
(2016).
29. Paz-Vinas, I. et al. Systematic conservation planning for intraspecific genetic diversity. Proc. R. Soc. Lond. B: Biol. Sci. 285, 20172746.
https://doi.org/10.1098/rspb.2017.2746 (2018).
30. Sitzia, T., Kudrnovsky, H., Müller, N. & Michielon, B. Biological flora of Central Europe Myricaria germanica (L.) Desv. Perspect.
Plant Ecol. Evol. Syst. 52, 125629. https://doi.org/10.1016/j.ppees.2021.125629 (2021).
31. Egger, G., Steineder, R. & Angermann, K. Verbreitung und Erhaltungszustand des FFH-Lebensraumtyps 3230 “Alpine Flüsse mit
Ufergehölzen von Myricaria germanica” an der Isel und deren Zubringern (Osttirol, Österreich). Carinthia II 204, 391–432 (2014).
32. Schletterer, M., Gewolf, S., Egger, G. & Fink, S. Forschungsprojekt Tamariske: Genetische Untersuchung von Populationen an der
Isel – Dokumentation der Beprobungen 2018. 32 (Innbruck, 2019).
33. Scheidegger, C. & Wiedmer, A. Genetische Untersuchung zur Deutschen Tamariske in Tirol. (Eidg. Forschungsanstalt WSL, Bir-
mensdorf, 2014).
34. Hedrick, P., Lacy, R., Allendorf, F. & Soule, M. Directions in conservation biology: Comments on caughley. Conserv. Biol. 10,
1312–1320 (1996).
35. Sampson, J., Byrne, M., Gibson, N. & Yates, C. Limiting inbreeding in disjunct and isolated populations of a woody shrub. Ecol.
Evol. 6, 5867–5880 (2016).
36. Kudrnovsky, H. & Stöhr, O. Myricaria germanica (L.) Desv. historisch und aktuell in Österreich: Ein dramatischer Rückgang einer
Indikatorart von europäischem Interesse. STAPFIA Rep. 99, 13–34 (2013).
37. Hoban, S. et al. Genetic diversity targets and indicators in the CBD post-2020 global biodiversity framework must be improved.
Biol. Conserv. 248, 108654. https://doi.org/10.1016/j.biocon.2020.108654 (2020).
Scientific Reports | (2022) 12:8570 | https://doi.org/10.1038/s41598-022-12172-x 10
Vol:.(1234567890)www.nature.com/scientificreports/
38. Auffret, A. G., Plue, J. & Cousins, S. A. O. The spatial and temporal components of functional connectivity in fragmented land-
scapes. Ambio 44, 51–59. https://doi.org/10.1007/s13280-014-0588-6 (2015).
39. Herrmann, J. et al. Connectivity from a different perspective: Comparing seed dispersal kernels in connected vs. unfragmented
landscapes. Ecology 97, 1274–1282 (2016).
40. Mortelliti, A., Amori, G. & Boitani, L. The role of habitat quality in fragmented landscapes: A conceptual overview and prospectus
for future research. Oecologia 163, 535–547 (2010).
41. Mosner, E., Liepelt, S., Ziegenhagen, B. & Leyer, I. Floodplain willows in fragmented river landscapes: Understanding spatio-
temporal genetic patterns as a basis for restoration plantings. Biol. Conserv. 153, 211–218 (2012).
42. Chambers, J., MacMahon, J. & Brown, R. Alpine seedling establishment: The influence of disturbance type. Ecology 71, 1323–1341
(1990).
43. Bill, H.-C. Besiedlungsdynamik und Populationsbiologie charakteristischer Pionierpflanzenarten nordalpiner Wildflüsse PhD thesis,
Philipps-Universität Marburg, (2000).
44. Lite, S. J., Bagstad, K. J. & Stromberg, J. C. Riparian plant species richness along lateral and longitudinal gradients of water stress
and flood disturbance, San Pedro River, Arizona, USA. J. Arid Environ. 63, 785–813. https://doi.org/10.1016/j.jaridenv.2005.03.
026 (2005).
45. Andersson, E., Nilsson, C. & Johansson, M. E. Plant dispersal in boreal rivers and its relation to the diversity of riparian flora. J.
Biogeogr. 27, 1095–1106 (2000).
46. Aguiar, F. et al. The abundance and distribution of guilds of riparian woody plants change in response to land use and flow regula-
tion. J. Appl. Ecol. 55, 2227–2240 (2018).
47. Leyer, I. Dispersal, diversity and distribution patterns in pioneer vegetation: The role of river-floodplain connectivity. J. Veg. Sci.
17, 407–416 (2006).
48. Crookes, S. & Shaw, P. W. Isolation by distance and non-identical patterns of gene flow within two river populations of the fresh-
water fish Rutilus rutilus (L. 1758). Conserv. Genet. 17, 861–874. https://doi.org/10.1007/s10592-016-0828-3 (2016).
49. Werth, S. & Scheidegger, C. Gene flow within and between catchments in the threatened riparian plant Myricaria germanica. PLoS
ONE 9, e99400 (2014).
50. Jacquemyn, H., Honnay, O., Van Looy, K. & Breyne, P. Spatiotemporal structure of genetic variation of a spreading plant metap-
opulation on dynamic riverbanks along the Meuse River. Heredity 96, 471–478. https://doi.org/10.1038/sj.hdy.6800825 (2006).
51. Mayer, C., Schiegg, K. & Pasinelli, G. Patchy population structure in a short-distance migrant: evidence from genetic and demo-
graphic data. Mol. Ecol. 18, 2353–2364 (2009).
52. Benda, L. E. E. et al. The network dynamics hypothesis: How Channel networks structure riverine habitats. Bioscience 54, 413–427
(2004).
53. Miettinen, A. et al. A large wild salmon stock shows genetic and life history differentiation within, but not between, rivers. Conserv.
Genet. 22, 35–51. https://doi.org/10.1007/s10592-020-01317-y (2021).
54. Fink, S., Lanz, T., Stecher, R. & Scheidegger, C. Colonization potential of an endangered riparian shrub species. Biodivers. Conserv.
26, 2099–2114. https://doi.org/10.1007/s10531-017-1347-3 (2017).
55. Merritt, D. & Wohl, E. Plant dispersal along rivers fragmented by dams. River Res. Appl. 22, 1–26 (2006).
56. Sitzia, T., Michielon, B., Iacopino, S. & Kotze, D. J. Population dynamics of the endangered shrub Myricaria germanica in a regulated
Alpine river is influenced by active channel width and distance to check dams. Ecol. Eng. 95, 828–838 (2016).
57. Wöllner, R., Scheidegger, C. & Fink, S. Gene flow in a highly dynamic habitat and a single founder event: Proof from a plant
population on a relocated river site. Glob. Ecol. Conserv. 28, e01686. https://doi.org/10.1016/j.gecco.2021.e01686 (2021).
58. McLaughlin, B. et al. Hydrologic refugia, plants, and climate change. Glob. Change Biol. 23, 2941–2961 (2017).
59. Chiu, M. C. et al. Branching networks can have opposing influences on genetic variation in riverine metapopulations. bioRxiv
https://doi.org/10.1101/550194 (2020).
60. Catford, J. & Jansson, R. Drowned, buried and carried away: Effects of plant traits on the distribution of native and alien species
in riparian ecosystems. New Phytol. 204, 19–36 (2014).
61. Schletterer, M. & Scheiber, T. Wiederansiedlung der deutschen tamariske (Myricaria germanica (L.) DESV.) an der Leutascher
Ache (Nordtirol, Österreich). B. Naturwiss. Med. Ver. Innsbr. 95, 53–65 (2008).
62. Riehl, S. & Zehm, A. in ANLiegen Natur Vol. 40, 17–20 (ANL Bayern, Laufen, 2017).
63. Egger, G., Angermann, K. & Gruber, A. Wiederansiedlung der Deutschen Tamariske (Myricaria germanica (L.) Desv.) in Kärnten.
Carinthia II 393–418 (2010).
64. Kudrnovsky, H. Alpine rivers and their ligneous vegetation with Myricaria germanica and riverine landscape diversity in the
Eastern Alps: Proposing the Isel river system for the Natura 2000 network. Eco. Mont 5, 5–18 (2013).
65. Lener, F. P. Etablierung und Entwicklung der Deutschen Tamariske (Myricaria germanica) an der oberen Drau in Kärnten Master
thesis (University of Vienna, Vienna, 2011).
66. Schiechtl, H. M. in Alpenländ. Bienenzeitung Vol. 4 125–131 (1957).
67. Bill, H.-C., Poschlod, P., Reich, M. & Plachter, H. Experiments and observations on seed dispersal by running water in an Alpine
floodplain. Bull. Geobot. Inst. ETH 65, 13–28 (1999).
68. Nilsson, C., Brown, R., Jansson, R. & Merritt, D. The role of hydrochory in structuring riparian and wetland vegetation. Biol. Rev.
85, 837–858 (2010).
69. Lener, F. P., Egger, G. & Karrer, G. Sprossaufbau und entwicklung der deutschen tamariske (Myricaria germanica) an der Oberen
Drau (Kärnten, Österreich). Carinthia II(203), 515–552 (2013).
70. Werth, S. & Scheidegger, C. Isolation and characterization of 22 nuclear and 5 chloroplast microsatellite loci in the threatened
riparian plant Myricaria germanica (Tamaricaceae, Caryophyllales). Conserv. Genet. Resour. 3, 445–448 (2011).
71. R Core Team. R: A language and environment for statistical computing. R Found. Stat. Comp., (2016).
72. Excoffier, L., Laval, G. & Schneider, S. Arlequin ver 3.0: An integrated software package for population genetics data analysis. Evol.
Bioinform. Online 1, 47–50 (2005).
73. Cornuet, J. M. & Luikart, G. Description and power analysis of two tests for detecting recent population bottlenecks from allele
frequency data. Genetics 144, 2001–2014 (1996).
74. Luikart, G., Allendorf, F. W., Cornuet, J. M. & Sherwin, W. B. Distortion of allele frequency distributions provides a test for recent
population bottlenecks. J. Hered. 89, 238–247. https://doi.org/10.1093/jhered/89.3.238 (1998).
75. Falush, D., Stephens, M. & Pritchard, J. Inference of population structure using multilocus genotype data: Dominant markers and
null alleles. Mol. Ecol. Notes 7, 574–578 (2007).
76. Earl, D. A. & von Holdt, B. M. STRUCTURE HARVESTER: A website and program for visualizing STRUCTURE output and
implementing the Evanno method. Conserv. Genet. Res. 4, 359–361 (2012).
77. Smouse, P. E., Peakall, R., GenAlEx 6.5: genetic analysis in Excel. Population genetic software for teaching and research—an update.
Bioinformatics 28, 2537–2539. https://doi.org/10.1093/bioinformatics/bts460 (2012).
78. Piry, S. et al. GENECLASS2: A software for genetic assignment and first-generation migrant detection. J. Hered. 95, 536–539.
https://doi.org/10.1093/jhered/esh074 (2004).
79. Paetkau, D., Slade, R., Burden, M. & Estoup, A. Genetic assignment methods for the direct, real-time estimation of migration rate:
A simulation-based exploration of accuracy and power. Mol. Ecol. 13, 55–65. https://doi.org/10.1046/j.1365-294X.2004.02008.x
(2004).
Scientific Reports | (2022) 12:8570 | https://doi.org/10.1038/s41598-022-12172-x 11
Vol.:(0123456789)www.nature.com/scientificreports/
80. Wilson, G. A. & Rannala, B. Bayesian inference of recent migration rates using multilocus genotypes. Genetics 163, 1177–1191
(2003).
81. Rannala, B. (ed University of California Davis) 1–12 (2007).
82. Rambaut, A., Drummond, A. J., Xie, D., Baele, G. & Suchard, M. A. Posterior summarization in bayesian phylogenetics using
Tracer 1.7. Syst. Biol. 67, 901–904. https://doi.org/10.1093/sysbio/syy032 (2018).
83. Meirmans, P. G. Nonconvergence in Bayesian estimation of migration rates. Mol. Ecol. Resour. 14, 726–733. https://doi.org/10.
1111/1755-0998.12216 (2014).
84. Greenland, S. et al. Statistical tests, P values, confidence intervals, and power: A guide to misinterpretations. Eur. J. Epidemiol. 31,
337–350. https://doi.org/10.1007/s10654-016-0149-3 (2016).
Acknowledgements
We thank Christine Schwarzmann and Christian Plössnig from the Office of the Tyrolean Regional Government
and the advisory group on the research project “Genetic diversity at Isel” (Johannes Kostenzer, Norbert Müller,
Christian Ragger, Michael Reischer, Peter Schönswetter, Kordula Schwarzwälder) for advice on the study design.
We are grateful to Luca Hoppler and Susanne Gewolf for their participation in collecting plant material, and
to the Genetic Diversity Center of ETH, especially Aria Minder and Silvia Kobel, for assistance with fragment
analysis. Funding was provided for field work and genetic analysis in 2014 by the Office of the Tyrolean Regional
Government, Austria, for data collection, lab work and analysis in 2018 and 2019 by TIWAG, Austria, and for
data collection in 2016 and genetic analysis in 2020 by FOEN Switzerland, project “riverscape: sediment dynamics
and connectivity”. Sampling in 2014 and 2016 was carried out on behalf of the Office of the Tyrolean Regional
Government. Sampling in 2018 was carried out based on the permit (for sampling parts of protected plants)
NSCH/N-269/6-2017 from 06.09.2017 (district authority Lienz) and the decision of the State Administrative
Court of Tyrol LVwG-2017/41/2267-19 from 23.05.2018.
Author contributions
S.F., C.S., G.E. and M.S. contributed to the study conception and design. Material preparation and data collection
were performed by all authors. Laboratory analysis were performed by A.H.-W., V.Z. and S.F., and subsequent
data analysis were done by S.F. The first draft of the manuscript was written by S.F. and all authors commented
on previous versions of the manuscript. All authors read and approved the final manuscript. The authors have
no conflicts of interest to declare.
Funding
Funding was provided by the Swiss Federal Offices for the Environment for the project “Riverscape—sediment
dynamics and connectivity” granted to CS. Field work was funded by the Office of the Tyrolean Regional Gov-
ernment, Austria (sampling periods 2014–2016) and by TIWAG—Tiroler Wasserkraft AG, Austria (sampling
period 2018).
Competing interests
The authors declare no competing interests.
Additional information
Supplementary Information The online version contains supplementary material available at https://doi.org/
10.1038/s41598-022-12172-x.
Correspondence and requests for materials should be addressed to S.F.
Reprints and permissions information is available at www.nature.com/reprints.
Publisher’s note Springer Nature remains neutral with regard to jurisdictional claims in published maps and
institutional affiliations.
Open Access This article is licensed under a Creative Commons Attribution 4.0 International
License, which permits use, sharing, adaptation, distribution and reproduction in any medium or
format, as long as you give appropriate credit to the original author(s) and the source, provide a link to the
Creative Commons licence, and indicate if changes were made. The images or other third party material in this
article are included in the article’s Creative Commons licence, unless indicated otherwise in a credit line to the
material. If material is not included in the article’s Creative Commons licence and your intended use is not
permitted by statutory regulation or exceeds the permitted use, you will need to obtain permission directly from
the copyright holder. To view a copy of this licence, visit http://creativecommons.org/licenses/by/4.0/.
© The Author(s) 2022
Scientific Reports | (2022) 12:8570 | https://doi.org/10.1038/s41598-022-12172-x 12
Vol:.(1234567890)You can also read