Green jobs mapping study in the Philippines - An overview based on initial desk research - Green Growth ...
←
→
Page content transcription
If your browser does not render page correctly, please read the page content below
Green jobs mapping study in the
          Philippines
 An overview based on initial desk research

          Regional Office for Asia and the Pacific

                                                     i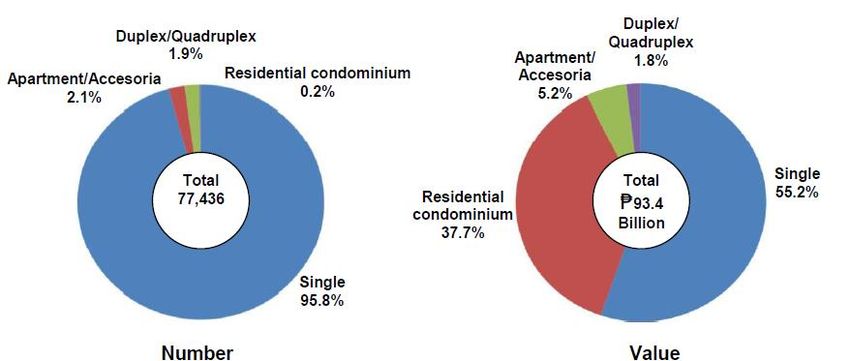
ii
Green jobs mapping study in the
          Philippines
 An overview based on initial desk research

          Regional Office for Asia and the Pacific

                                                     i
Copyright © International Labour Organization 2014
First published 2014

Publications of the International Labour Office enjoy copyright under Protocol 2 of the Universal Copyright
Convention. Nevertheless, short excerpts from them may be reproduced without authorization, on condition that the
source is indicated. For rights of reproduction or translation, application should be made to ILO Publications (Rights
and Permissions), International Labour Office, CH-1211 Geneva 22, Switzerland, or by email: pubdroit@ilo.org.
The International Labour Office welcomes such applications.

Libraries, institutions and other users registered with reproduction rights organizations may make copies in
accordance with the licences issued to them for this purpose. Visit www.ifrro.org to find the reproduction rights
organization in your country.

Green jobs mapping study in the Philippines: An overview based on initial desk research / ILO Regional Office for
Asia and the Pacific. - Bangkok: ILO, 2014
xiv, 74 p.

ISBN: 9789221285427 (web pdf)

ILO Regional Office for Asia and the Pacific

green jobs / environmental protection / skill / occupational change / skilled workers / retraining / training needs /
Philippines

13.01.3
                                                                                 ILO Cataloguing in Publication Data

The designations employed in ILO publications, which are in conformity with United Nations practice, and the
presentation of material therein do not imply the expression of any opinion whatsoever on the part of the
International Labour Office concerning the legal status of any country, area or territory or of its authorities, or
concerning the delimitation of its frontiers.

The responsibility for opinions expressed in signed articles, studies and other contributions rests solely with their
authors, and publication does not constitute an endorsement by the International Labour Office of the opinions
expressed in them.

Reference to names of firms and commercial products and processes does not imply their endorsement by the
International Labour Office, and any failure to mention a particular firm, commercial product or process is not a sign
of disapproval.

ILO publications and electronic products can be obtained through major booksellers or ILO local offices in many
countries, or direct from ILO Publications, International Labour Office, CH-1211 Geneva 22, Switzerland, or ILO
Regional Office for Asia and the Pacific, 11th Floor, United Nations Building, Rajdamnern Nok Avenue, Bangkok
10200, Thailand, or by email: BANGKOK@ilo.org. Catalogues or lists of new publications are available free of
charge from the above address, or by email: pubvente@ilo.org

Visit our website: www.ilo.org/publns or www.ilo.org/asia

Printed in Thailand

                                                                                                                        ii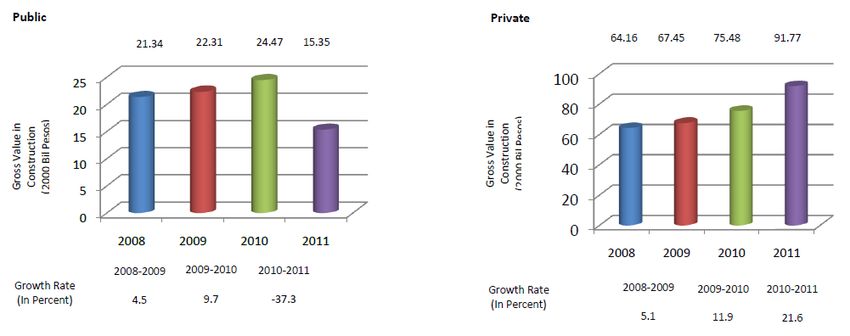
Foreword
Climate change and environmental degradation pose a severe threat to sustainable economic
development in many parts of the Asia-Pacific region including the Philippines. In this regard,
the government of the Philippines has committed to reducing greenhouse gases (GHG). The
transition to a green economy is progressing with the implementation of various environment
and climate change related policies and measures to drive more environmentally sustainable
economic growth in the Philippines. This structural change towards a greener and more
sustainable economic growth path, will create demand for new green technologies, green skills
and green jobs and will have implications on the employment and labour market dynamics in
Philippine economic sectors. It is important to ensure that any new jobs created for workers in
these environment-related sectors and green sub-sectors are decent and sustainable and that
existing decent work deficits are addressed.
This publication was produced under the International Labour Organization’s (ILO) Green Jobs
Programme for Asia and the Pacific which has created the momentum for developing new and
successful partnerships to promote green jobs throughout the country. The mapping study was
conducted to estimate and identify green jobs in the Philippines. It has identified potential
challenges to developing a greener economy with green jobs and decent work. The report
provides ILO constituents with the information and statistical data necessary to assess the
economic and employment impacts of a green development strategy and provides key
information on the sectors which promote environmentally-friendly decent work (green jobs). It
includes policy recommendations for the Government and social partners to identify entry points
for further green job creation that can drive a just transition towards a green economy.
The study is part of the ILO’s wider efforts to develop the research and analytical capacities of
constituents in the Asia-Pacific region in regard to green jobs and green skills. Similar green job
mapping studies have also been undertaken in Bangladesh, Indonesia and Malaysia and it is
envisioned that the results will lay the foundations for further economic studies on the labour
market and the development of green skills programmes at the national level.

ILO Regional Office for Asia and the Pacific

                                                                                                 iii
iv
Contents

Foreword ........................................................................................................................................ iii
Contents .......................................................................................................................................... v
Abbreviations ................................................................................................................................. xi
1. Introduction ................................................................................................................................. 1
   1.1 Defining green jobs ............................................................................................................... 1
   1.2 Structure of the report ........................................................................................................... 3
   1.3 An overview of the approach ................................................................................................ 3
   1.4 Preparing sector profiles........................................................................................................ 5
   1.5 Developing environment screening criteria .......................................................................... 5
   1.6 Decent work criteria .............................................................................................................. 6
   1.7 Estimating employment in green sectors/sub-sectors ........................................................... 9
   1.8 Challenges and assumptions................................................................................................ 10
2. The economy and employment structure in the Philippines ..................................................... 12
   2.1 An overview of the status of employment maintained in the economy .............................. 12
   2.2 Employment profile of the different economic sectors ....................................................... 12
   2.3 The informal sector ............................................................................................................. 15
   2.4 Responding to a changing climate and its implications ...................................................... 18
   2.5 Responding to the threats of climate change ....................................................................... 20
   2.6 List of key economic sectors and industries for the further characterization of green jobs 23
   2.7 Key industry clusters and economic sectors for discussions and surveys........................... 24
3. Proposed key economic sectors and industries for further characterization of green jobs
     including identified sub-indicators and screening criteria ..................................................... 26
   3.1 Agriculture .......................................................................................................................... 26
      3.1.1 Importance of the sector and key trends ....................................................................... 26
      3.1.2 Key trends towards sustainability ................................................................................. 27
      3.1.3 Identified sub-sectors and screening criteria ................................................................ 28
      3.1.4 Estimating environment-related employment .............................................................. 30
      3.1.5 Decent work .................................................................................................................. 31

                                                                                                                                                   v
3.1.6 Estimating green jobs ................................................................................................... 31
3.2 Construction ........................................................................................................................ 32
3.2.1 Importance of the sector and key trends ....................................................................... 32
3.2.2 Key trends towards sustainability ................................................................................. 34
3.2.3 Identified sub-indicators and screening criteria............................................................ 37
3.2.4 Estimating environment-related employment .............................................................. 37
3.2.5 Decent work .................................................................................................................. 38
3.2.6 Estimating green jobs ................................................................................................... 39
3.3 Services ............................................................................................................................... 39
3.3.1 Focus on the retail sub-sector ....................................................................................... 39
3.3.2 Key trends towards sustainability ................................................................................. 40
3.3.3 Identified sub-sectors and screening criteria ................................................................ 40
3.3.4 Estimating environment-related employment .............................................................. 41
3.3.5 Decent work .................................................................................................................. 41
3.3.6 Estimating green jobs ................................................................................................... 41
3.4 Tourism ............................................................................................................................... 41
3.4.1 Importance of the sector and key trends ....................................................................... 42
3.4.2 Key trends towards sustainability ................................................................................. 43
3.4.3 Identified sub-sectors and screening criteria ................................................................ 44
3.4.4 Estimating environment-related employment .............................................................. 45
3.4.5 Decent work .................................................................................................................. 46
3.4.6 Estimating green jobs ................................................................................................... 46
3.5 Transport ............................................................................................................................. 46
3.5.1 Importance of the sector and key trends ....................................................................... 46
3.5.2 Key trends towards sustainability ................................................................................. 48
3.5.3 Identified sub-sectors and screening criteria ................................................................ 49
3.5.4 Estimating environment-related employment .............................................................. 50
3.5.5 Decent work .................................................................................................................. 51
3.5.6 Estimating green jobs ................................................................................................... 52
3.6 Solid waste and wastewater management ........................................................................... 52
3.6.1 Importance of the sector and key trends ....................................................................... 53
vi3.6.2 Key trends towards sustainability ................................................................................. 54
3.6.3 Identified sub-sectors and screening criteria ................................................................ 54
3.6.4 Estimating environment-related employment .............................................................. 55
3.6.5 Decent work .................................................................................................................. 55
3.6.6 Estimating green jobs ................................................................................................... 56
3.7 Energy ................................................................................................................................. 56
3.7.1 Importance of the sector and key trends ....................................................................... 56
3.7.2 Key trends towards sustainability ................................................................................. 58
3.7.3 Identified sub-sectors and screening criteria ................................................................ 58
3.7.4 Estimating environment-related employment .............................................................. 59
3.7.5 Decent work .................................................................................................................. 61
3.7.6 Estimating green jobs ................................................................................................... 61
3.8 Forestry................................................................................................................................ 61
3.8.1 Importance of the sector and key trends ....................................................................... 62
3.8.2 Key trends towards sustainability ................................................................................. 63
3.8.3 Identified sub-sectors and screening criteria ................................................................ 64
3.8.4 Estimating environment-related employment .............................................................. 64
3.8.5 Decent work .................................................................................................................. 65
3.8.6 Estimating green jobs ................................................................................................... 65
3.9 Fisheries .............................................................................................................................. 65
3.9.1 Importance of the sector and key trends ....................................................................... 66
3.9.2 Key trends towards sustainability ................................................................................. 66
3.9.3 Identified sub-sectors and screening criteria ................................................................ 67
3.9.4 Estimating environment-related employment .............................................................. 67
3.9.5 Decent work .................................................................................................................. 68
3.9.6 Estimating green jobs ................................................................................................... 68
3.10 Manufacturing ................................................................................................................... 68
3.10.1 Key trends towards sustainability ............................................................................... 69
3.10.2 Identified sub-sectors and screening criteria .............................................................. 70
3.10.3 Estimating environment-related employment ............................................................ 71
3.10.4 Decent work ................................................................................................................ 71
vii3.10.5 Estimating green jobs ................................................................................................. 71
4. Conclusion and recommendations ............................................................................................ 72
Bibliography ................................................................................................................................. 73
List of tables
Table 1. Regional daily minimum wage rates for non-agriculture and agriculture in 2012 ........... 8
Table 2. Estimates of employed persons by industry and occupation in Philippines 2010–11 .... 14
Table 3. Agricultural employment by employment status and formal/informal sector 2009 ....... 17
Table 4. National Climate Change Action Plan strategic directions for 2011–28 ........................ 22
Table 5. Government budgets for direct and indirect climate change mitigation and adaptation 23
Table 6. Sustainable sub-sectors in the agriculture sector and environmental screening criteria . 29
Table 7. Sustainable sub-sectors in the construction sector and the environmental screening
criteria ........................................................................................................................................... 37
Table 8. Total employment in tourism industries 2005–10 .......................................................... 42
Table 9. Sustainable sub-sectors in the transport sector and the environmental screening criteria
....................................................................................................................................................... 49
Table 10. Number of registered vehicles 2009–11 ....................................................................... 52
List of figures
Figure 1. Definition of green jobs ................................................................................................... 2
Figure 2. Characterization of green jobs ......................................................................................... 9
Figure 3. Steps required prior to estimating green jobs ................................................................ 10
Figure 5. Allocation of GDP by sector in 2011 ............................................................................ 13
Figure 6. Allocation of employment by sector in 2011 ................................................................ 13
Figure 7. Proportion of unpaid family workers in total employment ........................................... 16
Figure 8. Projected changes in temperature by region for 2020 and 2050 ................................... 18
Figure 9. Projected changes by region in rainfall for 2020 and 2050 ........................................... 19
Figure 10. Overall GHG emissions per sector in 2000 ................................................................. 20
Figure 11. Trends in public and private investment 2008–11 ...................................................... 32
Figure 12. Number and value of residential construction by type in 2010 ................................... 33
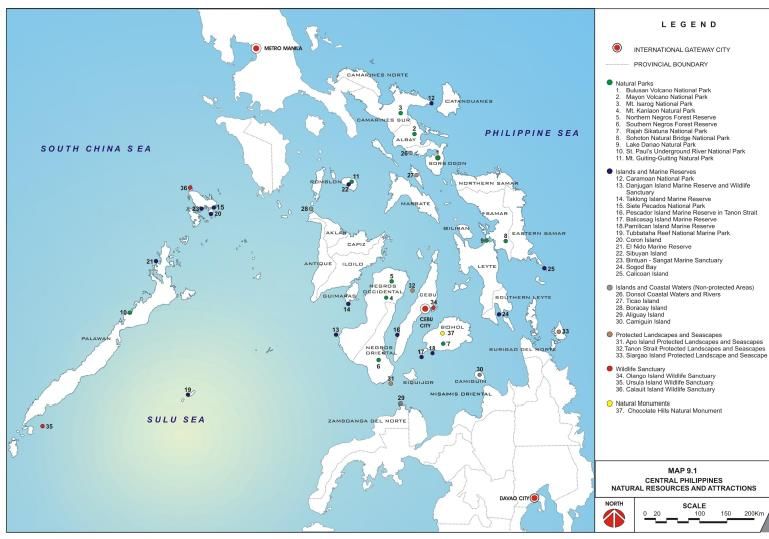
Figure 13. Location of ecotourism sites in the Philippines ........................................................... 44
Figure 14. Historical energy consumption by sector .................................................................... 47
Figure 15. Historical petroleum product consumption by sector .................................................. 47
viiiFigure 16. CO2 emissions by sector .............................................................................................. 57
Figure 17. Philippine capacity and gross generation 2009 ........................................................... 60
ixx
Abbreviations
ARMM     Autonomous Region in Muslim Mindanao
AUV      auxiliary utility vehicle
BERDE    building for ecologically responsive design excellence
BPO      business process outsourcing
BRT      Bus Rapid Transit
CCRF     Code of Conduct of Responsible Fisheries
CDM      Clean Development Mechanism
CFLs     compact fluorescent lamps
CO2      carbon dioxide
DA       Department of Agriculture
DENR     Department of Environment and Natural Resources
DOE      Department of Energy
DOT      Department of Tourism
ECAN     Ecologically Critical Area Network
EDC      Export Development Council
EO       executive order
ESCO     Energy Service Company
FAO      (United Nations) Food and Agriculture Organization
FARMCs   Fisheries and Aquatic Resources Management Councils
FDIs     foreign direct investments
FiT      feed-in tariff
FMU      Forest Management Unit
GCF      gross capital formation
GDP      gross domestic product
GFII     Green Future Innovations Inc.
GHG      greenhouse gas
GIZ      Gesellschaft für Internationale Zusammenarbeit
GMOs     genetically modified organisms
GNP      gross national product

                                                                  xi
GVA gross value added
GWh gigawatt-hours
IEQ indoor environmental quality
IFMAs Integrated Forestry Management Agreements
IGES Institute for Global Environmental Strategies
ILO International Labour Organization
ILS Institute of Labour Studies
IRR implementing rules and regulations
ITTO International Tropical Timber Organization
LCD liquid crystal display
LEISA low external input sustainable agriculture
LFS labour force survey
LGUs Local Government Units
LPG liquefied petroleum gas
LRT Light Rail Transit
MASIPAG Magsasaka at Siyentipiko Para Sa Pag-unlad Ng Agrikultura (Farmer-Scientist
Partnership for Development)
MDGs Millennium Development Goals
MMBFOE million barrels of fuel oil equivalent
MRFs materials recovery facilities
MRT Metro Rail Transit
MtCO2 millions of tonnes of carbon dioxide
Mtoe million tonnes of oil equivalent
MW megawatt
MWh megawatt-hours
NAMRIA National Mapping and Resource Information Authority
NBB National Biofuels Board
NCCAP National Climate Change Action Plan
NCR National Capital Region
NEECP National Energy Efficiency and Conservation Program
NES National Ecotourism Strategy
xiiNGOs non-governmental organizations
NIPAS National Integrated Protected Areas System
NISARD Negros Island Sustainable Agriculture and Rural Development Foundation
NO2 nitrogen dioxide
NOAB National Organic Agriculture Board
NREB National Renewable Energy Board
NREP National Renewable Energy Programme
NSCB National Statistical Coordination Board
NWPC National Wages and Productivity Commission
O&M operations and maintenance
OCCP Organic Certification Center of the Philippines
OFSP Organic FIELDS Support Program
PAs protected areas
PAGASA Philippine Atmospheric, Geophysical and Astronomical Services Administration
PAWB Protected Areas and Wildlife Bureau
PDP Philippine Development Plan
PHILGBC Philippine Green Building Council
PPP public-private partnership
PUB public utility bus
PUJ public utility jeepney
RA Republic Act
RE renewable energy
RPS Renewable Portfolio Standard
SB service bus
SFM sustainable forestry management
SMEs small and medium-sized enterprises
SUV sport utility van
TDGVA tourism direct gross value added
TLAs Timber License Agreements
UNEP United Nations Environment Programme
UNFCCC United Nations Convention for Climate Change
xiiiVCOP Virgin Coconut Oil Association of the Philippines
VOCs volatile organic compounds
xiv1. Introduction
This desk research report undertaken by the Institute for Global Environmental Strategies (IGES)
in collaboration with the International Labour Organization (ILO) is the initial step in mapping
existing green jobs in the Philippine labour market based on available published data from
government as well as non-government sources. This study will contribute to building a common
understanding on the linkages between economic, social and environmental policies in the
Philippines including through a tripartite consultation process at all stages of project
implementation. The mapping study report will bring qualitative and quantitative information on
the number and types of green jobs in key sectors of the economy which will be important to
prepare for the following step of the green jobs research programme in the Philippines.
The main purpose of the desk research is to propose a conceptual framework for the
characterization of green jobs in the Philippines, which include clustering of economic activities
and industries, selection of indicators, as well as for assessing numbers of direct green jobs at the
country and local levels. The desk research was conducted to:
Propose a list of key priority economic sectors and industries for the further characterization
of green jobs;
Propose clusters of key industries and economic sectors for the conduct of focus group
discussions and the conduct of establishment surveys;
Review possible indicators for the characterization of green jobs in selected economic sectors
and industries, including a review of possible green products and services and practices;
Compile existing information on the number of green jobs by selected sector on the basis of
the identified indicators for characterizing green jobs; and
Make recommendations for the conduct of the proposed establishment surveys.
1.1 Defining green jobs
The International Labour Organization (ILO) and the United Nations Environment Programme
(UNEP) define green jobs as the direct employment in economic sectors and activities, which
reduce their negative environmental impacts, ultimately resulting in levels that are sustainable.
This includes but is not limited to jobs that work towards protecting ecosystems and biodiversity,
reducing energy, materials and water consumption, de-carbonizing the economy and minimizing
all forms of waste and pollution. Moreover, a job is to be a green job if it is decent work in the
sense of the ILO.
The above definition is a “framework” definition for green jobs which will require further
refinements at the national level and the setting of technical indicators in the environment and
labour fields for further characterization. The present report will propose environment-related
indicators and labour-based indicators to be considered by ILO constituents and other partners
for a country-based approach on qualification and quantification of green jobs.
1Figure 1. Definition of green jobs
Source: ILO, 2010.
A green job must provide decent work as well as contribute directly to lessen environmental
impacts. Green jobs are identified by applying screening criteria to employment and economic
data. More precisely, the screening criteria to be applied for the identification of green jobs
across the economy relate to the following two dimensions of these jobs:
environmentally sustainable activities, products and services; and
conditions for decency of work.
Environmentally sustainable activities, products and services fall into one or more of the
following six groups:
Mitigation actions. These involve activities, products and services to reduce emissions
of greenhouse gases (GHGs) by sources or enhance their removal from the atmosphere
by sinks. 1 Mitigation actions include enhancing renewable energy supplies, promoting
energy efficiency and energy conservation, prevention of direct emissions of GHGs
through the prevention of deforestation, protection of natural carbon sinks, etc.
Adaptation to climate change and disaster risk management. Actions include coastal
management, adaptation of agricultural practices to climate change, sustainable fisheries
and all forms of activities, structural and non-structural measures, geared to avoid or to
limit adverse impacts of hazards.
Biodiversity, desertification, ecosystem services, and environmental quality based
services. All activities linked to protecting ecosystems and habitats, and prevention of
land degradation from human activities.
Water and natural resource management. Products and services that promote water
efficiency, the sustainable use of wetlands and other systems, conservation of wildlife,
1
A sink refers to forests, vegetation or soils that can absorb CO2.
2sustainable practices in agriculture including organic farming and crop rotations,
sustainable forestry and sustainable practices in forestry management among others.
Pollution prevention and control. Products and services that reduce or eliminate the
creation of waste materials; collect, reuse, remanufacture, recycle, or compost waste
materials or wastewater.
Environmental compliance, education and training, and public awareness. These are
products and services that:
o enforce environmental regulations;
o provide education and training related to green technologies and practices; and
o increase public awareness of environmental issues.
1.2 Structure of the report
This report is structured as follows:
An overview of the approach;
An overview of the Philippine economy and structure of employment;
An overview of the socio-economic implications of climate change in the Philippines;
An overview of the key priority economic sectors and industries for the further
characterization of green jobs;
Review of possible indicators for the characterization of green jobs in selected economic
sectors and industries, including review of possible green products and services and
practices;
Compilation of existing information on number of green jobs by selected sector on the basis
of the identified indicators for characterizing green jobs; and
Some recommendations for the conduct of the proposed establishment survey.
1.3 An overview of the approach
A number of studies have been commissioned by the ILO Country Office for the Philippines and
by the Institute of Labour Studies (ILS) to provide a comprehensive background on the status of
green jobs awareness, potential and readiness in the Philippines. 2 The focus of the many studies
is on the “greening” of existing industries. This desk research for the Green Jobs Mapping Study
in the Philippines begins with the intention of estimating actual green jobs in existing industries
based on available published data and substantiated by consultations and actual surveys. The
2C. Cruz: From jobs to green jobs: A just transition framework, ILS Discussion Paper Series 01-2009 (ILS, Manila, 2009). M.G.
Riguer: Assessing the green potential and readiness: The case of the construction sector, ILS Discussion Paper Series (ILS,
Manila, 2009). A.B. Sibiran-Manalang, et al.: Rapid sector scoping for green jobs in Asia Project (ILO, Manila, 2011). R.E.
Ofreneo: Green jobs and green skills in a brown Philippine economy (ILO, Manila, 2010).
3final result of the study will establish baseline figures which may be used as a basis to draft
appropriate policies promoting green jobs.
While green jobs can exist and flourish in all sectors and industries, the desk research will be
limited to selected key priority sectors considering the time constraints and data availability.
Similarly, the consultations with resource persons to further understand and acquire data on
existing green jobs or green jobs screening criteria will be completed in clusters to more
efficiently cover sectors with near-like circumstances. The approach on how to estimate existing
green jobs will be streamlined so transferability to sectors not considered in the desk research
will be possible.
For this desk research, a preliminary look on the general terms of linkages between the
environment, including implications of climate change and the economy will be reviewed to:
o Propose a list of key economic sectors and industries for the further characterization
of green jobs; and
o Propose clusters of key industries and economic sectors for the conduct of Focus
Group discussions and the conduct of establishment surveys.
The method for the subsequent tasks is explained in more detail, specifically:
The process by which sectors/sub-sectors were identified;
How the screening criteria were developed;
How environment-related employment was estimated, given the available data disclosing
assumptions and key caveats to the job estimates; and
How decent work was defined and its corresponding criteria were developed.
The subsequent sections in this report are structured as follows:
Task Description Output
Task 1 Understanding the overall structure of the domestic Overview of the economic structure
economy and total employment
Task 2 Identifying environment-related economic activity and Sector profiles including total
employment employment generated by the sector
Task 3 Developing screening criteria for identifying economic Screening criteria and list of identified
activities that support “core” environment-related “core” sectors
employment
Task 4 Estimating “core” environmental employment using the Estimates of jobs in ”core” sectors
screening criteria
Task 5 Screening “core” jobs using decent work criteria Decent work criteria and estimates of
green jobs
Task 6 Summary
4Note that Tasks 2 to 5 will be undertaken for all sectors. The environmental screening criteria
will be different depending on the sector being analyzed but the decent work criteria are
applicable to all sectors.
1.4 Preparing sector profiles
This task considers the size and distribution of environment-related employment in the
Philippine context to:
Identify key economic sectors and activities that have strong links to the environment;
and
Prepare sector profiles explaining the structure of each sector of interest.
1.5 Developing environment screening criteria
The screening criteria attempt to cover a comprehensive set of environmental impacts including:
Resource efficiency – reducing the resource use per unit of output;
Energy efficiency – reducing energy consumption per unit of output;
Abatement and mitigation – of waste and emissions;
Adaptation and resilience – sustainable adaptation to environmental risks including
disease, welfare improvement and enhancement or protection of ecosystem services; and
Biodiversity conservation, including marine/coastal conservation.
Screening criteria of different types covering the above mentioned environmental indicators are
applied sequentially to the data gathered for each sector.
The first screening criterion is compliance with international and/or national
environmental laws. Activities and enterprises whose performance is not consistent with
national laws on pollution control, technologies, etc. cannot be considered to be
providing “core environmental” jobs and need to be excluded.
The second step is to consider implementation of voluntary environmental standards
and associated management systems (e.g. jobs sustained by forestry management
practice that is not consistent with internationally or nationally recognized (but voluntary)
standards of good forest stewardship cannot be considered to be “core” environmental
jobs).
The third step is to screen for the existence of government and/or public/private
strategic plans and targets for environmental management. These can signal national
aspirations and desired direction of travel (e.g. plans for promotion of solar photovoltaic
and of conversion of public transport fleets to alternative fuels).
The fourth step is to consider performance benchmarks or minimum performance
thresholds for industries or sectors established by the government and/or private sector
(e.g. examine energy intensity (megawatt-hours, MWh/job) and include in core
5employment only those jobs associated with activities that fall within the top quartile). In
this instance, in circumstances where national or voluntary standards and codes are
absent, the analyst is making a proposal for what constitutes ‘good” environmental
performance. This contrasts with the steps above where a standards-based approached is
being followed.
The final step is to consider activity-based approaches, whereby activities are
considered as providing core environmental jobs because of their low resource use and/or
positive environmental impacts (e.g. bee-keeping/honey production, climate change
adaptation programmes).
It is suggested that a whole life cycle assessment be adopted especially in critical sectors to make
informed decisions through a better understanding of the environmental impacts of a product’s
life from-cradle-to-grave and the processes or activities it underwent. The life cycle assessment
approach assesses the environmental aspects and potential impacts associated with a product,
process or service comprehensively to avoid a narrow outlook on environmental impacts by:
Compiling an inventory of relevant energy and material inputs and environmental
releases;
Evaluating the potential environmental impacts associated with identified inputs and
releases; and
Interpreting the results to help make a more informed decision.
1.6 Decent work criteria
The minimum requirements for decent work are:
Rules and regulations on minimum wage, where these are applied (i.e. in the formal
economy);
Freedom of association and the effective recognition of the right to collective bargaining;
Elimination of all forms of forced or compulsory labour;
Effective abolition of child labour; and
Elimination of discrimination in respect of employment and occupation.
The minimum age for general employment is 15 years in the Philippines. Under the Child
Protection Act of 1992 and the Republic Act (RA) No. 7610, however, children under 15 may be
employed, provided that: the employer secures a work permit from the Department of Labor and
Employment; the protection, health, and safety and morals of the children can be ensured;
measures to prevent exploitation or discrimination in remuneration and work schedules are
instituted; and a continuous programme for training and skill acquisitions of the child is
formulated and implemented.3 The RA No. 7658 amended section Article VIII, section 12, of
Act No. 7610 by prohibiting children below 15 years of age from employment except when they
3 Official Gazette (of the Senate and the House of Representatives of the Philippines), 27 July 1992. Vol. 88, No. 80.
6work in a family-run company or when their participation in public entertainment is essential.4
Moreover, under the Child and Youth Welfare Code, employers are required to submit periodic
reports and maintain a register on child employees. The Bureau of Women and Young Workers
is charged with enforcing child labour laws.5 This Bureau coordinates and collaborates with non-
governmental organizations and other governmental agencies, but has no inspectors. It depends
on inspectors from the Labor Standards Division and the Welfare Division, but with only 197
labour inspectors, the monitoring of child labour laws remains an enormous challenge.
Under RA 6727 or the Wage Rationalization Act of 1989 and RA 6971 or the Productivity
Incentives Act of 1990, the National Wages and Productivity Commission (NWPC) is the key
policy making body which determines minimum wages at the regional, provincial and/or
industry levels and promotes productivity improvement and gain sharing schemes, particularly
among micro, small and medium enterprises.
The current regional daily minimum wage rates for non-agriculture and agriculture jobs in the
Philippines as of May 2012 are presented in table 1. As initially indicated, these are minimum
criteria of decent work. It can be modified following the consensus during the sectoral
consultations and/or focus group discussions to better reflect the appropriateness to the
Philippine context.
4“Philippine Congress passes child labour law,” in the Reuter Library Report, 9 Nov. 1993. Republic of the Philippines,
Congress of the Philippines, Metro Manila, Second Regular Session (26 July 1993).
5 G. Suvarchala: “Legislation to combat child labour: An international perspective,” in Industrial Relations Journal, Vol. 23,
Issue 2, June 1992, pp. 144-154.
7Table 1. Regional daily minimum wage rates for non-agriculture and agriculture in 2012
Region Number & date in Non-agriculture Agriculture
effects
(Pesos)
Plantation (Pesos) Non-Plantation (Pesos)
National WO 16/May 26, 2011 389.00– 426.00 389.00 389.00
Capital Region
(NCR) a/
Cordillera WO 14/January 1, 2011 255.00–272.00 238.00–254.00 238.00–254.00
Administrative
Region (CAR)
b/
I c/ WO 14/January 20, 2011 228.00–248.00 228.00 200.00
II d/ WO 15/May 16, 2012 247.00–255.00 235.00–243.00 235.00–243.00
III e/ WO 16/June 24, 2011 279.00–330.00 264.00–300.00 244.00–284.00
IV-A f/ WO 15/May 15, 2012 255.00–349.50 251.00–324.50 231.00–304.50
IV-B g/ WO 05/Nov. 11, 2010 252.00–264.00 210.00–219.00 190.00–199.00
V h/ WO 15/ April 7, 2012 228.00–252.00 228.00 228.00
VI i/ WO 19/ July 15, 2011 223.00–265.00 233.00 223.00
VII j/ WO16/Sept 22, 2011 260.00–305.00 240.00–287.00 240.00–287.00
VIII k/ WO 16/June 1, 2011 253.00 228.00–234.00 213.50
IX l/ WO 17/ Nov. 25, 2011 267.00 242.00 222.00
X m/ WO 16/July 24, 2011 271.00–286.00 259.00–274.00 259.00–274.00
XI n/ WO 17/Jan. 1, 2012 291.00 281.00 281.00
XII o/ WO 17/April 18, 2012 270.00 248.00 243.00
XIII p/ WO 11/November 11, 258.00 248.00 228.00
2011
Autonomous WO 13/ September 2, 232.00 232.00 232.00
Region in 2011
Muslim
Mindanao
(ARMM) q/
Notes:
a/ Provided PHP 22.00 COLA
b/ Granted PHP12.00 COLA
c/ Granted PHP 5.00 or 8.00 wage increase and integrated the PHP10 COLA under W.O. RB1-13 into the basic pay.
d/ Granted PHP 10.00 wage increase. Integrated to PHP15 COLA under W.O. No. RBII-10 into the basic pay.
e/ Granted additional PHP 14 COLA, the PHP4 under W.O. 15 will be integrated into the basic wage on January 1, 2012.
f/ Granted PHP2-90 wage increase for 5 years (for workers receiving below (P255); PHP12.50 Conditional Temporary
8Productivity Allowance
(for workers receiving above P255).
g/ Granted PHP12 wage increase.
h/ Granted PHP3.00 - P23.00 per day wage increase.
i/ Granted PHP12.00 ECOLA for three months.
j/ Granted PHP20.00 wage increase.
k/ Granted PHP15 COLA to be given in 2 tranches: PHP10 on Jun 1 & P5 on Sept. 1, 2011; integrated into the basic pay the
PHP8 COLA under W.O.14.
l/ Granted PHP12 wage increase.
m/ Integrated the PHP17 COLA effective for 6 months; to be integrated into the basic wage thereafter.
n/ Granted PHP15 COLA; PHP5 effective Jan. 1, 2012 and PHP10 effective May 1, 2012
o/ Integration of the PHP15 COLA under W.O.No. 16, Granted PHP10 COLA for Non-Agri. PHP8 COLA (upon in effect) for
Agriculture sector and additional P4 (Plantation) & P6 COLA (for Non-Plantation) effective Dec. 1, 2012; PHP6 COLA upon in
effect for retail/service establishments & additional PHP4 (for Retail/Service w/more than 10 workers) & PHP6 (for R/S w/ not
more than 10 workers) effective Dec 1, 2012.
p/ Granted PHP11 wage increase and PHP4 COLA
q/ Granted PHP10.00 COLA.
Source: National Wages and Productivity Commission.
1.7 Estimating employment in green sectors/sub-sectors
The same set of social and environmental criteria will be applied both to formal and informal
sectors to estimate green jobs. Green jobs exist both in the formal and informal employment
sectors. Based on the environmental screening criteria and decent work criteria, the
characterization of green jobs is illustrated in figure 2.
Figure 2. Characterization of green jobs
Environment Green Decent jobs
related jobs jobs
At least minimum wage Resource efficiency
Freedom of association Energy efficiency
Right to collective bargaining Abatement and mitigation
No child labour Adaptation and resilience
No discrimination Biodiversity conservation,
including marine conservation
Source: ILO, 2010.
9Figure 3. Steps required prior to estimating green jobs
Source: ILO, 2010.
1.8 Challenges and assumptions
Currently there is no labour market information on existing green jobs in the Philippines
although some policies have already been implemented by public and private organizations
promoting green jobs. Available data are scarce and does not necessarily correspond to the
sector/sub-sector of interest. The main challenges in data handling are the following:
Lack of data of actual job estimates – in many cases there is no information on job
estimates in the sector/sub-sector of interest. There are also no available estimates for
activities within a sector/sub-sector which has potential to generate green jobs, e.g. provision
of energy efficient lighting system in buildings within the construction industry.
Data disaggregation – for example, the job estimate for forestry at the national level is
combined with agriculture and hunting. Similarly, the job estimate for transport is combined
with storage and communications.
Lack of information on what has been implemented on the ground – there is considerable
information on government policy initiatives and strategies, including financing, towards
climate change programmes, for example, but very little information is available on the
actual projects implemented much less on the corresponding green jobs generated.
How to deal with job estimates of “short-term green projects” – for example, there are
cases of isolated or short-term environmental projects such as tree planting on a certain piece
of land which could generate temporary jobs.
To facilitate initial estimation considering the vast data gaps in each sector of interest, the
following methods are employed – using ratios, applying assumptions and considering “what-if”
scenarios in sectors that have no available data on environment-related “core” sub-sectors. In
10some cases, combinations of methods are applied to obtain a range of estimates. The results may
unlikely reflect the actual numbers of jobs created but they may serve as initial ball park figures
for consideration and then modified later after actual surveys and focus group discussions.
Using ratios – in cases where the percentage of the size of environment-related “core” sub-
sector relative to the whole sector size if available, it can be used to deduce the percentage of
employment of the environment-related “core” sub-sector as a fraction of the sector as a
whole. Similarly, data from small scale surveys establishing such ratios could be projected to
the economy as a whole.
Using assumptions – in some cases, it is necessary to use initial default values (e.g. assumed
number of jobs created per hectare in agriculture sector) used in previous studies.
Using “what-if” scenarios – in cases where there are no available data yet the government
has commitments to pursue sustainable practices towards greening the sector of interest,
“what-if” scenarios are applied to explore the effects on green job creation potential of the
said sector.
It should be noted that in this desk research, many assumptions are made to illustrate “what-if”
scenarios and should not be taken as is.
112. The economy and employment structure in the Philippines
This section provides a brief profile of the economic and employment structure of the Philippine
economy including an overview on the following:
an overview of the status of employment maintained in the economy;
employment profiles of the different economic sectors; and
briefing on the informal economy.
2.1 An overview of the status of employment maintained in the economy
The Philippine economy has been growing continuously in recent years albeit erratically.
Philippine gross domestic product (GDP) grew 7.6 per cent in 2010 then dropped to 3.7 per cent
in 2011. Growth has averaged 3 per cent annually since 1981. With population still increasing at
more than 2 per cent per year, per capita incomes have risen only 20 per cent in real terms from
1981 to 2009. The economy weathered the global recession due to minimal exposure to troubled
international securities, lower dependence on exports, relatively resilient domestic consumption,
large remittances from about 4 million Filipino workers overseas and a growing business process
outsourcing industry.
Rates of unemployment remain high averaging 7.5 per cent in 2006–10 and 10 per cent in 1990–
2005.6 There were 36.3 million employed workers and 2.9 million unemployed workers in the
Philippines in 2011. About 564,000 college graduates were unemployed in 2011 and 10.5 million
people were engaged in the informal sector. 7 The informal sector operators are either self-
employed (about 9.1 million) without any paid employees or employer (about 1.3 million) in
family-owned farms or businesses.
The Philippine Development Plan 2011–16 charters a way towards inclusive growth, aiming for
sustained growth that creates jobs, draws the majority into the economic and social mainstream
and continuously reduces mass poverty. Key objectives of the Plan include:
A growth in real GDP averaging 7–8 per cent per year.
Generate an average of one million (1,000,000) net employment annually.
Lower the unemployment rate to 6.8–7.2 per cent.
2.2 Employment profile of the different economic sectors
In 2011, the largest contribution to the Philippines’ GDP came from the service sector (54.4 per
cent) while employing about half (52.2 per cent) of the workforce. The agriculture, forestry and
6 Note that data before and after 2005 cannot be compared because of a change in the unemployment definition adopted that year.
7 Based on the 2008 Informal Sector Survey (2008 ISS) of the Philippines conducted by the National Statistics Office (NSO) with
funding assistance provided by the United Nations Economic and Social Commission for Asia and the Pacific (UNESCAP).
12fishing sectors accounted for less than one-sixth (12.3 per cent) of GDP but absorbed about one-
third (33 per cent) of the country’s total employed. In contrast, the industry sector which
contributed a third (33.3 per cent) to the GDP comprised only a small share (14.9 per cent) of
total employed, as suggested by figures 5 and 6.
Figure 4. Allocation of GDP by sector in 2011
Allocation of GDP by Sector (2011)
Agriculture, forestry and fishery Services Industry
12%
33%
55%
Source: National Statistics Office, Labor Force Survey, 2011.
Figure 5. Allocation of employment by sector in 2011
Allocation of Employment by Sector
(2011)
Agriculture, forestry and fishery Services Industry
15%
33%
52%
Source: National Statistics Office, Labor Force Survey, 2011.
A more detailed breakdown of employment estimates by industry and occupation in the last two
years, 2011 and 2010 are presented in table 2.
13Table 2. Estimates of employed persons by industry and occupation in Philippines 2010–11
Selected indicators 2011 2010
Employed persons
Number (in thousands) 37 191 36 035
Industry sector 100.0 100.0
Agriculture 33.0 33.2
Agriculture, hunting and forestry 29.0 29.1
Fishing 3.9 4.1
Industry 14.9 15.0
Mining and quarrying 0.6 0.6
Manufacturing 8.3 8.4
Electricity, gas and water 0.4 0.4
Construction 5.6 5.6
Services 52.2 51.8
Wholesale and retail trade, repair of motor vehicles, motorcycles and personal and
19.9 19.5
household goods
Hotels and restaurants 3.0 2.9
Transport, storage and communication 7.5 7.6
Financial intermediation 1.2 1.1
Real estate, renting and business activities 3.4 3.2
Public administration and defense, compulsory social security 5.0 5.1
Education 3.2 3.3
Health and social work 1.2 1.3
Other community, social and personal service activities 2.5 2.5
Private households with employed persons 5.2 5.3
Extra-territorial organizations and bodies - -
Occupation 100.0 100.0
14Officials of government and special interest organizations, corporate executives,
14.0 13.8
managers, managing proprietors and supervisors
Professionals 4.7 4.7
Technicians and associate professionals 2.6 2.6
Clerks 5.7 5.6
Service workers and shop and market sales workers 11.1 10.6
Farmers. Forestry workers and fishermen 15.4 15.9
Trades and related workers 7.4 7.7
Plant and machine operators and assemblers 6.0 6.3
Laborers and unskilled workers 32.6 32.3
Special occupations 0.4 0.4
Note: Details may not add up to totals due to rounding up.
Source: National Statistics Office, annual labor and employment estimates for 2010 and 2011.
2.3 The informal sector
Measuring the prevalence of informal employment is important for understanding the
distribution of economic risks and sources of income inequality, including factors contributing to
the economic vulnerability of women. Informal employment is often, but not always, more
precarious with lower earnings. Households which depend on informal employment for their
primary source of income often face higher risks of poverty (Chen et al., 2005). Based on the
2008 Informal Sector Survey, of the 10.5 million informal sector operators counted, 47.4 per cent
were working as farmers, forestry workers and fishermen. Those belonging to the group of
managing proprietors were the second largest group accounting for 31.2 per cent. Those involved
in the wholesale and retail trade accounted for more than one-fourth (29.6 per cent) while those
in transport, storage and communications were about 10 per cent. Informal sector operators are
either self-employed without any paid employee or employer in own-family operated farms or
businesses. The self-employed numbered about 9.1 million while the employer numbered at 1.3
million.
15Figure 6. Proportion of unpaid family workers in total employment
Notes: (a) Data from the Labor Force Survey (LFS) refer to averages of quarterly data, i.e., January, April, July and October
except for 1990 which is the average of January, July and October data as April round not conducted due to the 1990 Population
Census. (b) LFS data from 1990-96 were adjusted based on the 1980 Census-based population projections, those from 1997–
2005 were adjusted based on the 1995 Census-based population projections and those from 2006 onwards were adjusted based on
the 2000 Census-based population projections. (c) In ILO status in employment, the self-employed and unpaid family workers
are classified as own-account workers and contributing family workers, respectively.
Source: National Statistics Office, Labor Force Survey, 2011.
On gender profiles, two-thirds of informal sectors were male, as shown in figure 7. Seventy-five
per cent or three-fourths of the informal sector operators were in age group 35 years old and
over, the largest was the age group 35–44 (27.5 per cent). Meanwhile, the age group 15–24
reported the least share (5.2 per cent). Four out of ten informal sector operators attained at most
elementary level. Those who had attained high school level comprised 36.2 per cent while about
17.7 per cent had reached college level. About two-thirds of informal sector operators were
household heads. By place of work, more than 40 per cent of informal sector operators worked
on the farm or individual agricultural/subsidiary plots. About 16.5 per cent of informal sector
operators worked at home with space inside/attached to the home.
When asked about their job satisfaction, six out of ten informal sector operators answered that
they were satisfied in their job or business. Only 1.7 per cent of informal sector operators were
very unsatisfied in their job or business. More than 10 per cent (11.1 per cent) of informal sector
operators were in Calabarzon followed by informal sector operators in Central Luzon and
Western Visayas with 8.3 per cent and 8.1 per cent, respectively. On the other hand, it reported
the smallest proportion of operators (1.5 per cent).
16You can also read