Green Jobs in Tunisia - Measuring Methods and Model Results
←
→
Page content transcription
If your browser does not render page correctly, please read the page content below
Green Jobs in Tunisia
Measuring Methods and Model Results
Green Jobs
in Tunisia
Measuring
Methods and
Model Results

Ulrike Lehr
Rafik Missaoui
Andreas Bockermann
Sami Marrouki
Anke Mönnig
Ghazi Ben Salem
Copyright © International Labour Organization 2018
First published 2018

Publications of the International Labour Office enjoy copyright under Protocol 2 of the Universal Copyright
Convention. Nevertheless, short excerpts from them may be reproduced without authorization, on condition
that the source is indicated. For rights of reproduction or translation, application should be made to ILO
Publications (Rights and Licensing), International Labour Office, CH-1211 Geneva 2 2, Switzerland, or by
email: rights@ilo.org. The International Labour Office welcomes such applications.
Libraries, institutions and other users registered with a reproduction rights organization may make copies in
accordance with the licences issued to them for this purpose. Visit www.ifrro.org to find the reproduction
rights organization in your country.

Green Jobs in Tunisia – Measuring Methods and Model Results

ISBN 978-92-2-030780-9
__________________________________________________________________________________________________________

The designations employed in ILO publications, which are in conformity with United Nations practice, and
the presentation of material therein do not imply the expression of any opinion whatsoever on the part of the
International Labour Office concerning the legal status of any country, area or territory or of its authorities, or
concerning the delimitation of its frontiers.
The responsibility for opinions expressed in signed articles, studies and other contributions rests solely with
their authors, and publication does not constitute an endorsement by the International Labour Office of the
opinions expressed in them.
Reference to names of firms and commercial products and processes does not imply their endorsement by
the International Labour Office, and any failure to mention a particular firm, commercial product or process is
not a sign of disapproval.
ILO publications and digital products can be obtained through major booksellers and digital distribution
platforms, or ordered directly from ilo@turpin-distribution.com. For more information, visit our website:
www.ilo.org/publns or contact ilopubs@ilo.org.

Design by the International Training Centre of the ILO, Turin – Italy
TABLE OF CONTENTS

1   Background                                                                    1

2   Methodology – IO analysis and modelling                                        5

    2.1   IO tables and IO analysis                                                6

    2.2   Including green activities in the IO table                               7

    2.3   Matrix calculation with IO tables                                       12

3   Identification of Green sectors in Tunisia and construction of the IO table   15

    3.1   Green sectors: Water and waste                                          17

          3.1.1   Water sector                                                    17

          3.1.2   Solid waste sector                                              19

    3.2   Non-green sectors                                                       20

    3.3   Sectors in transition: Partly green                                     21

          3.3.1   The renewable energy and gas sector                             21

          3.3.2   Wind power                                                      21

          3.3.3   Solar energy                                                    22

          3.3.4   The construction sector and energy efficiency                   22

          3.3.5   Green agriculture                                               23

          3.3.6   Other sectors                                                   24

    3.4   Construction of the extended IO table based on identified
          green industries                                                        25

    3.5   Final demand and production shares of green industries                  31

                                                                                       iii
Green Jobs in Tunisia – Measuring Methods and Model Results
4 Green jobs in Tunisia - Today and in the future 35
4.1 Jobs in waste and water management 36
4.2 Ex-post analysis - Green jobs in Tunisia 2005 - 2010 37
4.3 Decent jobs? 38
4.4 Forecast until 2030 – Assumptions and drivers 39
4.5 The baseline scenario (0 – Basis) 42
4.6 Scenario 1: Energy efficiency and renewable energy 44
4.6.1 Scenario description – EE + RE 44
4.6.2 Simulation results – EE + RE 45
4.7 Scenario 2: Investment in the waste sector 47
4.7.1 Description of the scenario - Waste 47
4.7.2 Simulation results - Waste 47
4.8 Scenario 3: Water sector 49
4.8.1 Scenario description - Water 49
4.8.2 Simulation results – Water 49
4.9 Scenario 4: Organic agriculture 50
4.9.1 Scenario description – Organic agriculture 50
4.9.2 Simulation results – Organic agriculture 51
4.10 Scenario 5: Greening Tunisia 52
4.11 Scenario 5: Greening a growing Tunisia 53
5 Conclusions and outlook 55
5.1 Input-output analysis 55
5.2 Typical features of green sectors 55
5.3 Decent jobs and the informal sector 56
5.4 Future work 56
ivTABLE OF CONTENTS
6 References 57
7 Appendix I – The informal labour market 59
7.1 The informal labour market 59
7.2 The case of Tunisia 61
8 Appendix II – Sectoral case studies 63
8.1 Agriculture, forestry and fishing 63
8.1.1 Green jobs in agriculture, forestry and fishing 72
8.1.2 Two different kinds of olive farming, olive oil production and
distribution 72
8.1.3 Labelling 74
8.1.4 Shares of organic farming 75
8.1.5 Green jobs in the agricultural sector in Tunisia 77
8.2 Water sector 77
8.2.1 Typical challenges for water and sewerage operators 77
8.2.2 Future prospects 78
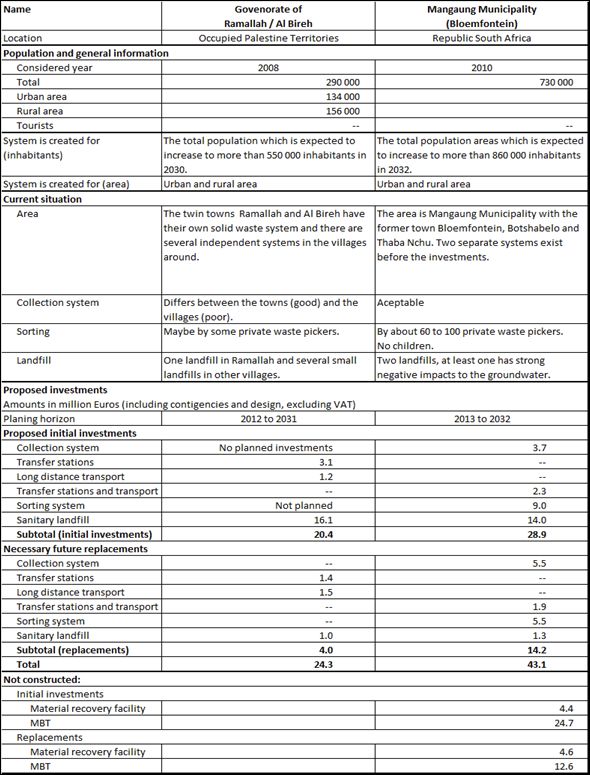
8.3 Waste 82
8.3.1 Possible investments in the solid waste sector 84
8.3.2 Hazardous waste 85
8.3.3 Recycling: End-of-life vehicle dismantling as an example 86
vGreen Jobs in Tunisia – Measuring Methods and Model Results
List of figures
Figure 1: Schematic presentation of an IO table . . . . . . . . . . . . . . . . . . . . . 7
Figure 2: Numerical example: IO table with 3 sectors. . . . . . . . . . . . . . . . . . . 8
Figure 3: IO table expanded for agriculture, simplified version. . . . . . . . . . . . . . 9
Figure 4: Shift from fertilizers to organic agriculture and more labour-intensive
production. . . . . . . . . . . . . . . . . . . . . . . . . . . . . . . . . . . . . 10
Figure 5: Expansion of IOT to all sectors. . . . . . . . . . . . . . . . . . . . . . . . . . 11
Figure 6: Solar water heater market in Tunisia . . . . . . . . . . . . . . . . . . . . . . 22
Figure 7: Adding the green dimension . . . . . . . . . . . . . . . . . . . . . . . . . . 27
Figure 8: The transition matrix for the seven-sector IOT . . . . . . . . . . . . . . . . . . 28
Figure 9: Waste management strategy in Tunisia . . . . . . . . . . . . . . . . . . . . . 35
Figure 10: Ratio of direct to indirect jobs. . . . . . . . . . . . . . . . . . . . . . . . . . 37
Figure 11: Variable input coefficients of the ten largest production sectors
of Tunisia . . . . . . . . . . . . . . . . . . . . . . . . . . . . . . . . . . . . . . 40
Figure 12: Total employment and production (BASIS) – green and conventional. . . 42
Figure 13: Conventional and green production by sectors . . . . . . . . . . . . . . . . 43
Figure 14: Total employment - difference as compared to the baseline scenario. . . 46
Figure 15: Employment impacts in different sectors (in 1000s of employees). . . . . . 46
Figure 16: Overall additional employment from waste management measures . . . . 48
Figure 17: Additional employment by sector . . . . . . . . . . . . . . . . . . . . . . . 48
Figure 18: Additional employment from measures in the water sector. . . . . . . . . 49
Figure 19: Employment changes in water sector . . . . . . . . . . . . . . . . . . . . . 50
Figure 20: Additional employment from organic agriculture . . . . . . . . . . . . . . . 51
Figure 21: Employment changes in the agricultural sector. . . . . . . . . . . . . . . . 51
Figure 22: Additional employment from the green economy. . . . . . . . . . . . . . 52
Figure 23: Employment and the share of green jobs in Tunisia by 2030. . . . . . . . . 52
Figure 24: Nominal and real GDP. . . . . . . . . . . . . . . . . . . . . . . . . . . . . . 53
Figure 25: Additional employment from additional growth. . . . . . . . . . . . . . . . 54
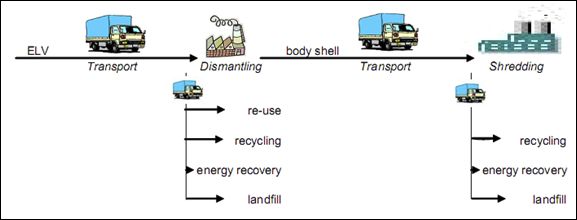
Figure 26: Diagram: Overview of the ELV treatment process . . . . . . . . . . . . . . . 86
viList of tables
Table 1: Green sector identification within the Tunisian IO table . . . . . . . . . . . . 16
Table 2: Assessment of water sector services . . . . . . . . . . . . . . . . . . . . . . 17
Table 3: Assessment of the criteria by cost object of the waste sector. . . . . . . . 19
Table 4: Data on organic farming in Tunisia (2009). . . . . . . . . . . . . . . . . . . 23
Table 5: Sectors of the Tunisian IO table. . . . . . . . . . . . . . . . . . . . . . . . . 25
Table 6: Aggregated IO table for 2010 – Seven-sector IOT . . . . . . . . . . . . . . . 27
Table 7: Intermediate demand in millions of TND. . . . . . . . . . . . . . . . . . . . 30
Table 8: Final demand matrix, green and non-green sectors . . . . . . . . . . . . . 32
Table 9: Rough estimate of the allocation of employees in the solid waste sector,
in a high-level system and in a medium-level system. . . . . . . . . . . . . 36
Table 10: Green Jobs in Tunisia 2005 – 2010, in thousands. . . . . . . . . . . . . . . . 37
Table 11: Labour-intensity comparison of green and conventional parts of sectors,
2030 (employees/millions of TND). . . . . . . . . . . . . . . . . . . . . . . . 44
Table 12: Ranking of 151 countries according to the size of their informal sectors
(measured as percentage of official GDP) . . . . . . . . . . . . . . . . . . . 61
Table 13: Distribution of land area by categories in km², 2011 . . . . . . . . . . . . . . 63
Table 14: Cereal production per variety in 1000 Mg. . . . . . . . . . . . . . . . . . . 64
Table 15: Vegetable production in 1000 Mg . . . . . . . . . . . . . . . . . . . . . . . 65
Table 16: Tobacco production in Mg and related area in km² . . . . . . . . . . . . . 65
Table 17: Beans in 1000 Mg. . . . . . . . . . . . . . . . . . . . . . . . . . . . . . . . . 66
Table 18: Crop production in Tunisia. . . . . . . . . . . . . . . . . . . . . . . . . . . . 66
Table 19: Animal production in Tunisia . . . . . . . . . . . . . . . . . . . . . . . . . . . 66
Table 20: Animal production by type (intended for slaughter) in 1000 Mg . . . . . . . 67
Table 21: Forest and silviculture production (Products of Sub-sector 02 - Forestry
and logging) . . . . . . . . . . . . . . . . . . . . . . . . . . . . . . . . . . . 67
Table 22: Fishing in 1000 Mg . . . . . . . . . . . . . . . . . . . . . . . . . . . . . . . . . 68
Table 23: Inputs to the agriculture, forestry and fishing sector in the year 2010 . . . . 68
Table 24: Outputs from the agriculture, forestry and fishing sector to other sectors,
without final consumption, in the year 2010. . . . . . . . . . . . . . . . . . 69
Table 25: Production of Tunisia’s agro-food industries . . . . . . . . . . . . . . . . . . 70
Table 26: Examples of organic labels – Germany . . . . . . . . . . . . . . . . . . . . . 74
Table 27: Investment plans for selected sites. . . . . . . . . . . . . . . . . . . . . . . 80
Table 28: Allocation of investment in Ulcinj (in percent of total cost objective
investment). . . . . . . . . . . . . . . . . . . . . . . . . . . . . . . . . . . . 81
Table 29: Results achieved in the waste sector. . . . . . . . . . . . . . . . . . . . . . 82
Table 30: Two examples of investment in a solid waste system. . . . . . . . . . . . . 84
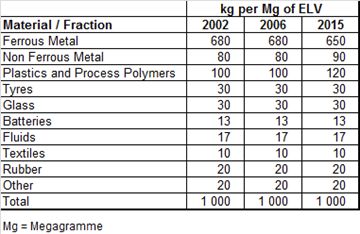
Table 31: ELV composition. . . . . . . . . . . . . . . . . . . . . . . . . . . . . . . . . . 87
viiGreen Jobs in Tunisia – Measuring Methods and Model Results
Acknowledgements
.
viiiBackground
1
Degradation of the environment, including the pollution of water, soil and air, irreversible
loss of biodiversity and depletion of natural resources are global threats to sustainable
development. These threats are aggravated by the impact of climate change, which
is already being experienced in many developing countries, and have led to calls
to make the ways in which we produce, work and travel more compatible with the
ecological limits and boundaries of our planet. On the social level, the challenges
of widespread unemployment, especially among young people, and the issues
of people’s inclusion and participation in a better, healthier and safer life seem
equally unresolved in large parts of the world. In discussions on the Green Economy,1
suggestions were made during the RIO+20 conference on how these challenges can
be addressed by adopting a harmonized approach.
These suggestions are now being translated into practice2. This process requires new
data and indicators: firstly, to identify the more pressing needs; secondly, to measure
the success of the respective policies, legislation and support mechanisms. To identify
progress, a rigorous framework of evaluation has to be established, based on a set of
indicators that can be regularly updated. Green employment is an important indicator
of the successful transition to a green economy. Analysis of the status of green and
decent employment, and of the potential for the future creation of green and decent
jobs, is therefore a necessary first step on the pathway to a green economy.
Against this background, the International Labour Organization (ILO) is supporting a
series of studies in an attempt to develop a method for the measurement of green and
decent employment (the ILO Green Jobs Initiative). This report contributes to the series
in two ways: a) methodologically, by proposing rules for constructing a tool to measure
direct and indirect jobs resulting from the green transition; and b) by presenting a
quantitative analysis based on a case study of Tunisia. The quantitative analysis includes
an ex-post evaluation and a simulation model for different future scenarios for green
jobs.
The method developed in the study is based upon established economic theory and
an established economic tool for analysing structural change. Input-output analysis
(IOA), as it is known, is based upon a matrix or table which connects the activities of
all industries in an economy within a consistent framework and allow deep insights into
the interdependence of all economic sectors. However, industries involved in the green
transition produce new goods in new ways, or through new combinations of already
existing industries. They often cut across established categories. Existing input-output
tables (IOTs) therefore need to be adjusted to these new challenges. Applying
Input-Output (IO) analysis opens up the possibility not only of considering direct jobs,
but also of tracking employment impacts deeper into the economy and calculating
1
UNEP, 2011, Towards a Green Economy: Pathways to Sustainable Development and Poverty
Eradication, www.unep.org/greeneconomy
2
For an overview of the UNEP follow-up activities see http://www.unep.org/greeneconomy/
Home/tabid/104269/language/en-US/Default.aspx
1Green Jobs in Tunisia – Measuring Methods and Model Results
indirect jobs. For the analysis of future developments under different scenarios, IO tables
are used to forecast future demand with the help of projections of GDP and population
growth. Differing uptakes of green products are also allowed for in the demand
equations. The result is a macro-driven, IO-based model which serves to estimate
employment impacts from greening under different assumptions. The model is called
e3.tn and is part of a series of models developed by GWS, a German-based economic
research institute which aims to estimate the economic impacts of environmental and
green-energy policies. Models have also been created for Austria (e3.at), Russia (e3.
ru) and Israel (e3.il). To go even further and take into consideration jobs induced by
additional income would require a full economic model with all the economic linkages
and interdependences. An analysis of induced effects is not included in the present
exercise.
Tunisia, the case study country, has undergone tremendous social and economic
changes in the last five years, since the revolution of 14 January 2011. The targets of
the transition to a green economy overlap with some of the most pressing economic,
environmental and social needs and challenges the country is facing. Tunisia is very
much aware of future environmental challenges and has already responded to some
of them through legislation and institution building. Tunisia has already made institutional
and legislative progress in transforming its energy system (cf. GIZ 2013, GIZ/Alcor 2010).
In other environmental fields, new legislation is still being discussed.
In summary, this report answers the following questions
1. where methods are concerned:
ll Can input-output analysis be applied, and IO tables be extended in a consistent
way, to create a tool for measuring green jobs?
ll What are the necessary steps towards this goal and what are the data needs?
2. and regarding the Tunisian economy:
ll How many people currently work in green sectors?
ll How many people will work in green sectors under different assumptions for future
greening of the Tunisian economy?
ll Are these decent jobs? What about the informal sector?
The report is organized as follows. After this introduction, Chapter 2 is concerned with
developing our approach to the work. Chapter 3 elaborates on the identification
of green sectors and their production structures. Chapter 4 analyses green jobs in
Tunisia ex-post. Chapter 5 describes the model and simulations of future development.
Chapter 6 presents our conclusions.
The results of the analysis are exploratory from several perspectives. Firstly, Tunisia is still in
transition and the process which began in 2011 is far from finished. The sectors identified
as green by stakeholders may be far from comprehensive, but reflect the current
expectation of experts for the economic development of the country.
Secondly, the model developed is a simple macro-driven simulation tool. Its strength
is the IO core, taking into account not only Tunisian statistics but also technological
2Background 1
information on renewable energy and energy efficiency deriving from earlier works
(GIZ 2013). The tool is not, however, effective for analysing the effects of price
mechanisms and other economic incentives. For this type of net analysis, a full
economic model is needed.
Thirdly, the current transition phase in Tunisia has led to an increase in informal labour,
which is not typical of the country. All stakeholders therefore tacitly assume that, once
the country is on a more stable track, the programmes formally established by the
public institutions in charge of managing, for example, the waste sector will lead to
decent working conditions.
With these caveats stated, the results of the study are quite encouraging. In 2010, there
were almost 110,000 green jobs. This figure declined in 2011 due to the recession that
followed the revolution but, according to the latest estimates, has slowly increased
again to around 120,000. Assuming massive investment, 8,000 additional people will
find work in the waste sector; developments in green energy and energy efficiency
can create up to 30,000 additional jobs; and organic agriculture may provide 40,000
additional job opportunities. Taking indirect effects into consideration, a green strategy
should yield 272,000 green jobs in Tunisia by 2030. In the remainder of this report, we will
show how these figures were arrived at and what assumptions have been crucial.
3Methodology – IO analysis and
modelling 2
Who has a green job? In an environmental economics framework, anybody whose
work improves environmental quality, reduces pollution, increases resource efficiency
and protects the ecosystem. Green jobs are jobs directly related to a green activity.
However, if the world wants to achieve greater sustainability and bring about a “green”
economy, it is also interesting to ask: How many jobs will result from this process? The
answer to this question includes all those who work at some point in the value chain of
a green production process or service. It reflects the economic impact of the transition
to a green economy.
How can we measure these green jobs? The procedure suggested in the following
paper consists of four steps:
1. To estimate existing green jobs:
a. Identify the “greenness” of each economic sector;
b. Calculate green employment in each sector, i.e. calculate the number of direct
green jobs;
c. Employ an established economic calculation tool (input-output table, IOT) to
estimate indirect jobs for each economic activity. For this it is necessary to:
i. Construct an IOT which distinguishes between green and non-green activities;
ii. Maintain consistency with the original IOT;
iii. Apply the new IOT to the original employment vector.
2. To estimate future green jobs: create a simulation model based upon time series of
IOT and macro-economic drivers, such as population and GDP.
The first three steps help to solve the green jobs identification problem: green
employment is identified using statistical data.
The model referred to in step 4 solves the forecasting problem and makes it possible to
estimate green employment under different assumptions about future development.
The simulation model is based on earlier research work on the economic effects of the
Tunisian Solar Plan (GIZ 2013). The model is called e3.tn (Economy, Environment, and
Energy in Tunisia). It comprises Tunisian IO tables extended to capture the effects of
increased energy efficiency and additional investment in renewable energy systems.
The latter can be understood, at least for the electricity generating systems, as a
greening of the electricity sector.
5Green Jobs in Tunisia – Measuring Methods and Model Results
The remainder of this chapter focuses on the construction of a green IO table. It
explains the principles and illustrates the method of construction using a numerical
three-sector example. The simulation model will be explained in Chapter 4.
2.1 IO tables and IO analysis
According to the findings of the Interagency3 Workshop on Employment and Social
Inclusion in a Green Economy (ITC 2013), input-output (IO) analysis (together with SAM-
based modelling) can be “used to estimate the effects on employment resulting from
the increase in final demand for the product or service in a given green industry by
estimating direct, indirect and induced jobs. Thus, the model can be used to answer
questions such as “How many jobs may result from a given program of investment
in sustainable economic areas?” or “For a given level of investment, which sector or
sectors would yield the greatest number of jobs?” (ITC 2013).
Economic sectors produce goods and services for other sectors and for final
consumption and, at the same time, use other goods and services to be able to
produce their own goods and services. The idea of grouping these kinds of input-output
flows in a systematic and symmetric table goes back to Wassily Leontief, who was
awarded the Nobel Prize for Economics for his work in this field in 1923. Input-output
tables provide information about the production and consumption of intermediate
and final goods, and reveal the cost structure of each economic sector. They capture
the circulation of products within an economy over a given period, condense the
complexity of economic action with all its effects, counter-effects, actions and
re-actions, and make it possible to distinguish between the direct and indirect
dependences of and between economic agents. Figure 1 illustrates the basic
input-output table.
3
The Partnership for Action on Green Economy, or PAGE, is a response to the outcome
document of the United Nations Conference on Sustainable Development (Rio+20), entitled
“The Future We Want”, which recognizes the green economy as a vehicle for sustainable
development and poverty eradication. Four UN agencies (the United Nations Environment
Programme (UNEP), the International Labour Organization (ILO), the United Nations Industrial
Development Organization (UNIDO) and the United Nations Institute for Training and Research
(UNITAR)) participate in this partnership.
6Methodology – IO analysis and modelling 2
nn Figure 1: Schematic presentation of an IO table
Source: own design, following Eurostat EU 27 IO.
The rows show the demand for product i, which is needed for the production process
of another product j and as a final product for consumption. For instance, agriculture
supplies agricultural goods to agriculture in the form of seeds, fodder or fertilizer. It
further supplies agricultural products to the food industry or to the energy sector in the
form of inputs to bio-energy. Agricultural products are also used directly by private
households or are produced for export. The sum of demand for intermediate inputs plus
final demand equals final production.
The columns represent the cost structures of production and services: each production
sector j needs a different combination of inputs to be able to produce. Again, taking
agriculture as an example, the column denotes the inputs from different sectors, such
as the energy sector, the chemical industry (fertilizers), the automotive industry (trucks
and tractors) and agriculture (seeds and manure), which are necessary for agricultural
production. Adding in primary inputs, such as the costs of depreciation, labour and
taxes, results in total production by sector. One important feature of this table is that
the sums entered in the rows equal the sums in the columns. This feature has to be
maintained no matter how the table is manipulated.
2.2 Including green activities in the IO table
When using the IO approach to analyse green jobs, we need to be able to incorporate
green activities into this framework. Each economic sector depicted in the IO table
potentially has a green part and a non-green part. The result of the analytics described
in the following section will be an IO table with twice as many rows and columns as
before, each sector being split into a green and a non-green part.
To achieve this, two challenges have to be met:
kk The consistency challenge: the economic activities described using the new
framework have to yield the same framework data in terms of total production
and total employment. The modifications to the scheme concern only activities
under the different headings.
7Green Jobs in Tunisia – Measuring Methods and Model Results
kk The data challenge: manipulation of the IO table must be data-based. If it
cannot be based upon data, axiomatic rules have to be formulated to keep the
framework consistent.
For illustration purposes, let us continue with the IO table and give a numerical example,
focusing solely on the three sectors of agriculture, manufacturing and services. The
numbers are chosen arbitrarily.
nn Figure 2: Numerical example: IO table with 3 sectors
Source: Own graph.
Reading along the rows in Figure 2 yields the following interpretation: agriculture delivers
ten units to itself (seeds, manure and feedstock), five units to the manufacturing sector
(e.g. the food industry) and five units to services, for instance restaurants and shops.
Consumers demand a total of 20 units of agricultural products, so total production
amounts to 40 units, the sum total of intermediate and final demand. Manufacturing
sells five units to agriculture (tractors and fertilizers), ten units are needed for different
manufacturing processes, while services consume two units of manufactured goods
(computers, printers etc.), which results in total production of 27 units, including final
demand.
Reading the above table along the columns tells us that, for the production of
40 units of agricultural goods, 10 units are needed from agriculture, five units from
manufacturing industry and five units from services. Selling the 40 units to consumers
and other sectors enables the agricultural producer to buy the necessary inputs, pay
employees’ wages, pay taxes and make a profit (20 units of value added).
To explicitly identify green activities, each sector needs to be split into two subsectors, a
green part and a non-green part. However, total production has to remain the same as
before, because we are still describing the same economy, while trying to identify the
parts that are green.
8Methodology – IO analysis and modelling 2
Figure 3 takes our example a stage further, showing how to split agriculture into
conventional agriculture and organic farming. Let the share of organic agriculture
be one fifth. Organic production then contributes eights units to the total of 40 units
for agriculture. All the structures in Figure 3 are the same as before: conventional
agriculture supplies 25% to itself, 12.5% to manufacturing and 12.5% to services, while
final demand consumes half of the sector’s output. The same holds true for organic
agriculture. Reading along the columns, the cost structures are the same as before:
both agricultural sectors record 50% value added and 50% costs; both get half of their
inputs from agriculture and the rest from manufacturing and services in equal shares.
nn Figure 3: IO table expanded for agriculture, simplified version
Source: own calculation
The intra-sector entry on the diagonal of the IO matrix requires special thought, as it
often contains the largest entries. Intra-industry transfers are very important for most
industries. Agriculture, our example sector, needs a lot of agricultural inputs and the
agriculture-to-agriculture entry in the above tables (a total of ten units) comprises all
the inputs from the agriculture sector needed to produce agricultural products. Typical
examples are seeds, seedlings, manure and unprocessed fodder. By splitting the sector
into two parts, organic and conventional, the diagonal element becomes a two-
by-two matrix, showing the supply of conventional to conventional, conventional to
organic, organic to organic and organic to conventional.
More data are needed than before. The two new elements are conventional transfers
to organic and vice versa. Requirements for certified organic agricultural products
often contain requirements for inputs: inputs from conventional agriculture may not
be allowed in organic agriculture, for example genetically modified seeds. Organic
livestock also needs to be fed with organic (certified) feedstock to be acknowledged
as organic under international standards.
9Green Jobs in Tunisia – Measuring Methods and Model Results
On the other hand, organic seeds and feedstock may be too expensive to be used in
conventional agriculture. These assumptions lead to the result in Figure 3, where the off-
diagonal elements in the two-by-two matrix, marked in red, are set to zero.
The share of value added and the input structure for organic agricultural are identical
to those for conventional agriculture in Figure 3. Value added is related to profits and
payments for labour in the IO framework. The literature often points out that organic
farming is more labour-intensive than conventional farming, partly because organic
farms tend to be smaller and require more manual labour.
In the light of the above discussion on eco-labels, the input structure has to be
reconsidered. Fertilizer, for instance, is replaced by organic fertilizer in green agriculture
and a shift in the cost structure is to be expected. In the example, this translates into a
shift in input from the chemical industry to other sectors. For instance, mineral fertilizers
are replaced by organic manure produced on farms. Note that, despite this shift, the
overall production of agriculture and the chemical industry has to remain constant.
Figure 4 shows the IOT with the organic/conventional split in agriculture, an adjusted
cost structure and a more labour-intensive mode of production.
nn Figure 4: Shift from fertilizers to organic agriculture and more labour-intensive production
Source: own calculation
The sum of the outputs remains constant. But organic agriculture records a higher share
in terms of total output, because organic agriculture produces more of its own inputs,
i.e. the organic fertilizers. This shift can be modelled only if sufficient data are available.
The result when this analysis is extended to all sectors is shown in figure 5. The split of the
diagonal and the changes in cost structures are not so obvious for all sectors as in the
case of agriculture. If no obvious split or data present themselves as the empirical basis
for the construction of the IOT, it has to be based upon an axiomatic set of rules:
Rule 1: Inputs to green sectors are green.
Rule 2: The input structure of green subsectors is the same as for their non-green
counterparts.
Rule 3: Exceptions to Rule 2 have to separately identified, as in this example of organic
farming.
10Methodology – IO analysis and modelling 2
nn Figure 5: Expansion of IOT to all sectors
Source: own calculation
Rule 1 is necessary for the split of the diagonal elements of the matrix. In the case
of organic farming, the distribution of the shares is facilitated by the requirements
of organic farming. In other sectors, information and restrictions on inputs are often
not available or not necessary. If no information is available, the straightforward and
obvious definition is contained in this rule. But rule 1 not only facilitates dealing with the
diagonal elements; it also serves as an important defining element for all green sectors.
If any sector contributes to a green sector, then this part of its production is labelled
green. If manufacturing supplies a tractor to organic farmers, the people who built the
tractor are defined as having green jobs. The tractor by itself is not a green product, but
this particular tractor would not have been built without the demand for it from organic
farming. More generally, the transition towards a green economy yields employment
in all sectors. Using IO analysis for calculating the employment effects of measures,
strategies and investment in greening the economy, also takes the important matter
of indirect employment into account. Additional demand from green manufacturing,
for instance, creates additional demand in other sectors, which generates a green
employment effect. For this reason, and because otherwise the data requirements
would be prohibitively high, rule 1 holds good throughout the analysis presented here.
Rule 2 is an important assumption when we undertake a full-scale IOT with 20, 30 or
70 sectors, because there will not be enough information and empirical data available
to complete the individual cost structure for each new green sector. Rule 2 simply
11Green Jobs in Tunisia – Measuring Methods and Model Results
assumes, as a first approximation, that green sectors have the same cost structures as
their non-green counterparts.
Total output remains at 108 units. Using the new IOT, we can read the input
requirements, cost structures, deliveries and production figures of the various green
sectors. The next section shows how employment can be calculated using a matrix
calculation based on the new IO table.
2.3 Matrix calculation with IO tables
IO tables represent a matrix and a system of equations. The Leontief production
function condenses this system. The Leontief-multiplier matrix, or Leontief inverse (I-A)-1,
is calculated from the matrix of input coefficients A, which relates the intermediate
demand by sectors to total production by sectors. The Leontief inverse implicitly
includes all inter-industrial production interdependencies. Given domestic final demand
(y-m), total production (x) by sectors can be calculated. The index t denotes time and
is relevant for time-series analysis or IO projections. Hence, sectoral production is the
outcome of both final domestic demand and inter-industrial production processes:
xt = (I − At ) ⋅ ( yt − mt )
−1
[1]
Based on this equation, production-induced employment effects can be computed
using standard input-output analysis (Holub & Schnabl 19944). To this end, the Leontief
inverse needs to be left-multiplied with a diagonal matrix of employment coefficients
(b) so that the resulting matrix can be interpreted as a labour-input matrix W.
et = bˆt (I − At ) ( yt − mt ) = W ( yt − mt )
−1
[2]
The labour-input matrix reveals the number of persons needing to be employed
in sector i to produce an additional unit in sector j. The column sums of that matrix
represent the employment multipliers of the 23 industrial sectors. The multiplier subsumes
all direct and indirect employment effects in sector j from an additional unit of final
demand in the corresponding sector. The diagonal of the matrix shows the direct
effects of an additional investment. The sum of the non-diagonal elements of sector
j indicates the leverage on indirect employment. The ratio of total employment
multiplier to direct employment multiplier is the factor that has to be multiplied by
direct employment in order to obtain the additional employment from an additional
unit in final demand. If the factor is larger than one, indirect employment is comes from
thissector. In general, service sectors have an employment factor close to one, whereas
manufacturing industries often show a higher employment factor.
The calculation of direct and indirect employment effects using standard input-
output analysis is subject to assumptions and limitations. For instance, IO analysis
lacks certain aspects of the supply side of employment. The question of whether the
economy is sufficiently endowed with human capital with the qualifications required
to match employment demand cannot be answered using the analysis presented
here. Extensions to the analysis, which is described above and applied in the following
chapters, are of course possible.
4
Holub, H.-W.&Schnabl, H. (1994) Input-Output-Rechnung: Input-Output-Analyse. R. Oldenbourg
Verlag. Munich. Vienna.
12Methodology – IO analysis and modelling 2
IO analysis is relevant for the analysis of green jobs in a particular country, because
it helps to estimate the link between green outputs and the country’s sector-specific
production structure. Consider, for instance, additional demand for organic agricultural
products stimulated by a campaign or a subsidy. This additional demand translates
directly into additional production, assuming that the additional products required are
not imported. Additional production requires additional workers, for sowing, watering
and harvesting in the case of agricultural crops. This employment effect is referred to
as “direct employment” in the literature. From the IO table, we can further deduce the
additional demand for intermediate inputs. All the sectors affected will experience an
additional demand for labour, and this will create additional employment. This is often
referred to as the “indirect employment” effect. In the case of agriculture, this effect
might extend to the machinery sector, the construction industry, transport and trade.
13Identification of Green sectors
in Tunisia and construction of
the IO table
3
The Tunisian economy is at a crossroads in its development. Currently, more than
15 per cent of overall production is in food and agriculture. The largest industrial
sector is the mechanical and electrical industry, which supplies inputs to the European
automotive and aircraft industries, as well as products for Tunisian industry and the
Tunisian consumer. Textiles and ICT are also significant industrial sectors. The construction
industry is important, accounting for more than 7 per cent of total production (2011,
INS) followed by commerce and trade, transport and other services (around 5 per cent
of total production).
For Tunisia, the transition to a green economy offers opportunities in several sectors, in
particular waste management, water management and treatment, eco-agriculture,
infrastructure, efforts to improve efficiency in buildings and industry, renewable
energy and eco-tourism. An action plan to develop a strategy and set the regulatory
framework for promoting green employment is currently in progress.
The ILO provides a definition of green jobs, which has been adopted by the 19th
International Conference of Labour Statisticians (October 2013). It is based on the System
of Environmental-Economic Accounting (SEEA)5. “Jobs are green when they help reduce
negative environmental impact ultimately leading to environmentally, economically and
socially sustainable enterprises and economies. More precisely green jobs are decent jobs
that:
• Improve energy and raw materials efficiency
• Limit greenhouse gas emissions
• Minimize waste and pollution
• Protect and restore ecosystems
• Support adaptation to the effects of climate change” (ILO 2013d)
5
5
SEEA (2012): System of Environmental-Economic Accounting 2012 Central Framework
15Green Jobs in Tunisia – Measuring Methods and Model Results
To identify the greenness of an economic sector, we have followed the Practitioner’s
Guide for Assessing Green Jobs Potential in Developing Countries (Jarvis et al. 2011)
and have developed it further, taking into account the data available for Tunisia. The
“development of new input–output (I-O) coefficients for green sectors is fundamental
for assessing the net impact of existing green jobs and for exploring the future
impacts of green growth. However, creating new input–output coefficients is not
straightforward.”(Jarvis et al. 2011).
In particular, the development of new input-output coefficients requires a definition of
what counts as environmentally sustainable and decent work. Three approaches are
possible: a) a process-based method, which tries to integrate environmentally friendly
production processes into the analysis. Typically, a threshold is defined which includes,
for instance, the top 10 per cent of water and energy-efficient enterprises (cf. Case
study of Mauritius, ILO 2013); b) an output-based method, which identifies green outputs
and services and supports the development of an extended IO table; c) a natural-
resource-conservation method, which supplements the above approaches by adding
sectors which are directly linked to the improvement of environmental quality.
In the case of Tunisia, stakeholder workshops have been held, in December 2013 and
in March 2014, to identify green sectors, products and processes of relevance to the
Tunisian economy. The list of participants can be found in the Appendix. For the most
part, sectors are identified in terms of their products and services. For mining and the
chemical industry, processes have been identified which decrease their environmental
impact. A full-scale model of the kind mentioned above for Mauritius could not be
developed for Tunisian industries due to lack of data.
Application of this definition leads to the identification of green sectors, non-green
sectors and in-between sectors. Table 1 gives an overview of the resulting identification
scheme. Chapter 3.1, 3.2 and 3.3 look into certain sectors in more detail and explain
why they were placed in their respective categories in Table 2.
nn Table 1: Green sector identification within the Tunisian IO table
Entirely green sectors (no need to split, as Water sector
already defined in INS classification):
Waste sector
Non-green sectors: Tobacco, oil refining, oil and gas extraction
Partly green sectors (need to be split from INS classified sectors, because green and non-green
activities within the sector classification are lumped together):
Greener processes with changed input/ Mining, chemicals
production structure:
Green products with changed input/ Electricity, agriculture, construction
production structure:
Providing inputs to green sectors without All others
changed input/production structure:
16Identification of Green sectors in Tunisia and construction of the IO table 3
3.1 Green sectors: Water and waste
3.1.1 Water sector
The water sector supplies drinking water, treats waste water and provides sewerage
services. Is it green? Are people who work in the water sector automatically performing
green jobs? The sector is not homogenous and comprises different activities. For a full
understanding all activities (drinking water supply, sewerage services with a sewerage
collection system, services for sewage collection from cesspits and treatment services)
are discussed.
When applying the output and process-based definition of green jobs – as introduced
earlier – it is helpful to distinguish green products and green processes. Environmental
activities protect the environment or increase resource efficiency. Jobs in the water
sector involving processes or production which protect the environment or increase
resource efficiency are therefore considered green. Table 2 gives an overview of
activities in the water sector evaluated with respect to their green aspects.
nn Table 2: Assessment of water sector services
Output Environmental protection Resource efficiency
Drinking water Yes. A very small number of jobs in
the drinking-water sector are
concerned with the protection
of water resources. These jobs
are typically not at water-
operator level but depend
more on governmental
agencies.
Sewerage Yes, if the sewerage system is connected
services to an operating WWTP or a functional sea
outfall.
It partly fulfils this criterion if the sewage
is discharged into a river, the sea or the
dessert without treatment.
Services Yes, if the sewage is delivered to a
for sewage functional WWTP* or into the sewerage
collection from system (e.g. a functional sea outfall).
cesspits
It only partly fulfils this criterion if the sewage
is discharged into a river, the sea or the
dessert without treatment.
Treatment The primary purpose is the prevention
services of pollution, which ensures groundwater
protection and health protection.
* wastewater treatment plants
17Green Jobs in Tunisia – Measuring Methods and Model Results
If the sector produces, designs or manufactures at least some goods and services
for the purpose of environmental protection and resource management, should it
be considered “green” in its entirety? The ILO definition challenges us to distinguish
between:
kk Specialist producers: establishments whose main activity is the production of
environmental goods and services;
kk Non-specialist producers: establishments that produce environmental goods and
services as secondary activity but have a different main activity;
kk Own-account producers: establishments that produce environmental goods and
services or processes for their own consumption within the economic unit.
Traditionally, the main output of a water and sewerage company is the supply of water
to the general population, as well as to non-household users (agriculture, industry,
commercial and service enterprises). Sewerage services and wastewater-treatment
services are (from the traditional point of view) secondary activities. The main benefits
are health protection and groundwater protection. But, if we include sewerage services
involving a sewerage collection system, services for sewage collection from cesspits
and treatment services in the environmental protection services category, then they
are specialist producers and should be fully taken into account.
Employment depends on the technical equipment used and what type of water
and sewerage operator is involved. Almost all operators provide drinking water as an
output, and most of them provide sewage services. Most sewerage services involve a
sewerage system; services in which sewage is only collected from cesspits are fewer
in number. In many municipalities in developing countries/emerging economies, there
are no WWTPs (wastewater treatment plants) and sewage is only discharged into the
dessert, a river or the sea. In other municipalities, a WWTP may exist, and in most of
these cases the WWTP is operating properly.
In Tunisia, a healthy and safe water supply has been high on the agenda since 1975.
The overarching target of the national water strategy is to ensure access to safe
water and economic benefit for all citizens, through well designed and well-managed
solutions adapted to the problems of each region. The acceptance of such measures
increases with communication on costs and benefits. Wastewater is an important
component of the strategy, reflected in the creation in 1975 of ONAS, the National
Bureau for Wastewater Treatment. Between 2005 and 2010, the infrastructure was
extended and improvements have led to more employment in construction and
manufacturing. In addition, various government agencies provide employment in
the water sector. It is estimated that 2,000 people are employed outside the water
treatment sector itself.
The water sector is reckoned to be 100% green in the following analysis.
18Identification of Green sectors in Tunisia and construction of the IO table 3
3.1.2 Solid waste sector
The waste sector collects waste, treats and disposes of it. It is also involved in recycling.
This sector, like the water sector, is not homogenous and comprises different activities.
The waste stream consists of non-hazardous wastes6, hazardous wastes containing
substances dangerous to human health and the environment7, and recyclable wastes,
which require dismantling8. Further recycling services are the scrapping and shredding
of metal waste, including dismantled endoflife vehicles, and electronic waste, the
processing of metal and non-metal scrap into secondary raw materials, and the
processing of plastic, waste oil and other fluids into usable materials.
In line with our strategy of identifying sector activities as green or non-green, Table 3
gives an overview of waste-related services which are classified as green.
nn Table 3: Assessment of the criteria by cost object of the waste sector9
Activity Environmental protection Resource management
Non-hazardous Yes. The collection, treatment and Yes, if considered as a
waste disposal of non-hazardous wastes are prerequisite for recycling.
environmental protection activities, the
primary purpose of which is to prevent,
reduce and eliminate pollution of the
environment.
Hazardous Yes. The collection, treatment and disposal Yes, if a prerequisite for
waste of hazardous wastes are environmental recycling.
protection activities, the primary purpose
of which is to prevent, reduce and
eliminate pollution of the environment.
Recyclable Yes. The collection of recyclable waste can Yes.
waste be an environmental protection activity,
if it replaces fly-tipping and the harmful
dumping of materials and liquids. The
recycler has to meet any existing soil, water
and air protection standards.
There are different waste-collection systems with different levels of sophistication. A
relatively underdeveloped (low-level) system might consist in the collection of bins or
containers, using a tractor and trailer to transport the solid waste to a simple dump.
6
Solid waste from private households, solid waste from factories, commercial enterprises and
public institutions, construction waste (including waste from the demolition of buildings) and
textile waste.
7
Explosive, oxidizing, flammable, toxic, irritant, harmful, carcinogenic, corrosive and infectious
wastes. Examples include used oil from shipment or garages, batteries, and biohazardous waste
from humans and animals, e.g. cadavers or slaughterhouse waste.
8
Cars, railway wagons, ships, electronic waste, refrigerators, washing machines, computers,
televisions, mobile phones.
9
Here, as in the preceding text on the water sector, fulfilling one criterion suffices for the sector
to qualify as (partly) green.
19Green Jobs in Tunisia – Measuring Methods and Model Results
On the dump, private waste-pickers might search for recyclables. This type of system
can be found in villages and suburban areas.
In a more advanced system, the collection of the waste is carried out using garbage
collection trucks and the landfill is organized and supervised by the operator. At an
even higher level, the collection system might consist of garbage collection trucks,
transfer stations and long-distance trucks. In such cases, the system would cover a
much larger area, sometimes with a radius of 35 km or more.
Sorting of the collected waste is performed either by waste-pickers, in a material
recovery facility (MRF), in a green waste-treatment plant (GWTP) or in a mechanical
biological treatment plant (MBT). In an MBT system, most recyclables can be sorted:
scrap metal (including beverage cans), plastics, paper, compostable materials, etc.
There are also sanitary landfill sites with a layer to protect the environment from the
seepage of fluids. These fluids may be collected in basins and (mostly) treated at a
WWTP. On more sophisticated sites, the methane emitted is collected and transformed
into electricity.
Waste incineration plants also differ in terms of sophistication and efficiency. At the
lower end of the scale, the waste is merely incinerated, whereas, in plants with higher
standards, electricity or heat is generated. The remaining ash still has to be disposed of,
either in a sanitary landfill or sometimes in a decommissioned underground mine.
The waste sector is treated as 100% green in the following analysis.
3.2 Non-green sectors
Having identified the entirely green sectors, the question arises as to whether there
are sectors which can be classified as entirely non-green. In more technical terms, the
question is: Are exceptions to rule 1 needed? Just to remind you, rule 1 states that all
inputs to green (sub)sectors are green. For our highly aggregated example, exceptions
do not make much sense, but does the rule hold good for a less aggregated IO table
in which we can make a distinction between, say, machinery and oil refining? Can the
latter be green?
Returning to the definition of environmental products given above, the outputs of
refineries cannot considered green. IOT analysis shows that the largest share of the
sector’s output goes to the transport sector, while the construction industry uses asphalt
and bitumen, the heavy fractions of refining. Most usages cannot be considered
green. To simplify our analysis, oil refining, the tobacco industry, mining and oil and gas
extraction are considered non-green from the production point of view.
However, the mining and chemical industries have gradually developed strategies
either to make their production more environmental friendly (in the case of the
chemical industry) or to mitigate the damage done by the industrial process (i.e.
restore/cultivate the damaged landscape, in the case of mining).
Are these green jobs? The answer, following the definitions given above, should be
“yes”. Though the danger of green-washing exists in industries which primarily damage
the environment by their mode of production, efforts to improve processes should
20Identification of Green sectors in Tunisia and construction of the IO table 3
be acknowledged. Thus, workers employed in these activities are considered to be
performing green jobs.
3.3 Sectors in transition: Partly green
The cost structures of fully green and fully non-green sectors do not receive special
consideration, because they do not need to be altered. For partly green sectors,
consisting of economic activities that are considered both green and non-green,
such as electricity generation from oil as opposed to wind, an attempt is made to
estimate new cost structures. This is the case for electricity generation, construction and
agriculture. For the other partly green sectors, new cost structures are not identified,
due to lack of data.
3.3.1 The renewable energy and gas sector
The use of renewable energy to generate electricity and heat can undoubtedly
be considered green. Renewable energy plays an important role in Tunisia. At the
institutional level, Tunisia is very advanced in its transition to the generation of electricity
and heat from renewables. Tunisia was undoubtedly a regional pioneer in the
development of the renewable electricity sector: a proactive policy of rational energy
use and renewable energy promotion was initiated in the 1990s. Energy efficiency has
gradually become one of the pillars of energy policy. According to the latest post-Paris
and post-COP 21 strategy (2016), the Tunisian Solar Plan aims to generate 15 per cent
of the country’s energy from wind, 10 per cent from solar PV and 5 per cent from solar
thermal (CSP) by 2030.
The Tunisian Solar Plan additionally aims to achieve an electricity mix of 25 per cent +
renewable energy in its electricity generation (1,520 MW wind, 1,930 MW PV (Gafsa,
Kebili and Tataouine), 595 MW CSP, making a total of 11,065 GWh). This will require
investment of 7.1 billion Tunisian dinars (TND), plus TND343 million a year for operations
and maintenance.
These objectives are supplemented by a 37 MW per year increase in CES (the growth
in 2008-2010 was 25 MW per year) to reach a target of 700 MW by 2030. In the case of
biogas, the target is additional capacity of 3 MW per annum.
Where investment opportunities in the renewable energy segments are concerned,
Tunisia has over 25 years’ experience in the field of energy management and is an
emerging market for equipment and services contributing to energy efficiency and
renewable energy.
3.3.2 Wind power
Tunisia has an estimated 4,000 MW wind energy potential, according to a study of
strategic renewable energy development. At the end of 2005, total installed capacity
was 54 MW. A second wind farm generating 191 MW was inaugurated by STEG in
September 2010. With it in operation, total installed capacity is now 245 MW and brings
the share of renewables in electricity generation to 4.5 per cent. In addition to the
STEG projects, the private sector expects to generate 60 MW from wind power for large
electricity consumers (EGCE) by 2013, and a further 100 MW for export by 2014.
21Green Jobs in Tunisia – Measuring Methods and Model Results
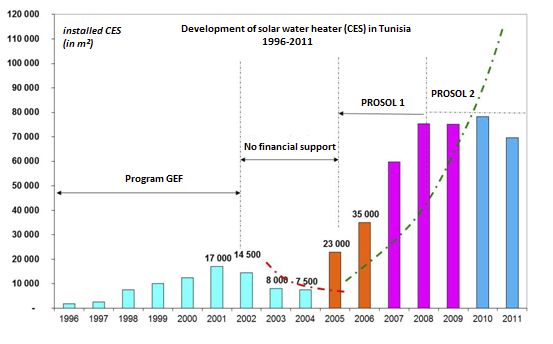
3.3.3 Solar energy
Solar energy has developed considerably in recent years. The PROSOL solar water
heater (CES), launched in 2005, has created a market for CES, with the following results:
nn Figure 6: Solar water heater market in Tunisia
A second PROSOL programme, PROSOL Elec, aiming to develop PV energy and feed
it into the national electricity grid, has to date installed PV panels generating 5 MW of
electricity.
What does this mean for the green IO table? Renewable energy is difficult to integrate
into the existing cost structure of electricity generation from fossil fuels. With the
exception of biogas, the technologies adopted in Tunisia are free of fuel costs. They shift
the costs from fuels to electricity and heat-generating systems, i.e. from raw materials to
industrial products, currently often imported. A PV-panel manufacturing plant opened
in Tunisia in 2013, and solar water heaters are being assembled, and more recently
produced, domestically. To reflect the shift in cost structure, the analysis is based upon
the t3e model developed for ANME in 2013, with the IO parameters for solar electricity
and heat generation, wind generators and biogas converters included in the model for
Tunisia.
3.3.4 The construction sector and energy efficiency
The construction sector plays an important role in the Tunisian economy. It will also play
an important role in solving one of the pressing problems of Tunisian society: the high
rate of unemployment. What can green activities contribute?
22You can also read