Green Cooling in Public Procurement - How to advance the procurement of climate-friendly and energy efficient air conditioners in the public sector
←
→
Page content transcription
If your browser does not render page correctly, please read the page content below
Green Cooling in Public Procurement
How to advance the procurement of climate-friendly and
energy efficient air conditioners in the public sector
As a federally owned enterprise, GIZ supports the German Government in achieving its
objectives in the field of international cooperation for sustainable development.

Published by:
Deutsche Gesellschaft für Internationale Zusammenarbeit (GIZ) GmbH

Registered offices
Bonn and Eschborn

Friedrich-Ebert-Allee 36 + 40
53113 Bonn, Germany
T +49 228 44 60 - 0
F +49 228 44 60 - 17 66

Dag-Hammarskjöld-Weg 1–5
65760 Eschborn, Germany
T +49 (0) 6196 79 – 4218
F +49 (0) 6196 79 - 804218

proklima@giz.de
www.giz.de/proklima

Programme/project description:
Cool Contributions fighting Climate Change (C4)/ Proklima

Responsible:
Philipp Munzinger, C4 Project Manager (GIZ Proklima)

Authors and Data Collectors:
Lukas Kahlen (NewClimate Institute), Jascha Moie (HEAT GmbH)
Philipp Munzinger & Lara Teutsch (GIZ Proklima)

Acknowledgement for Review and Input
Sebastian Schnatz (BMU)
Dr. Daniel de Graaf (Umweltbundesamt)
Sybrig Smit (NewClimate Institute)
Victor Minguez (UNEP United for Efficiency Programme)
Curllan Bhola, Chandramallika Gosh, Mairin Herm, Maraida Licerio, Adolfo Cordoba Rodriguez
Alireza Saadatfar, Smita Vichare, Nora Ziegler, Anika Zwiener (GIZ Proklima)

Photo credits/sources
Cover photo: ©Julia Schabel/GIZ Proklima

URL links:
This publication contains links to external websites. Responsibility for the content of the listed external sites always lie with their
respective publishers. When the links to these sites were first posted, GIZ checked the third-party content to establish whether it could
give rise to civil or criminal liability. However, the constant review of the links to external sites cannot reasonably be expected with
concrete indication of a violation of rights. If GIZ itself becomes aware or is notified by a third party that an external site it has provided
a link to gives rise to civil or criminal liability, it will remove the link to this site immediately. GIZ expressly dissociates itself from such
content.

On behalf of
The German Federal Ministry for the Environment, Nature Conservation and Nuclear Safety (BMU)
Division IG II 1 Fundamental Aspects of Chemical Safety, Chemicals Legislation
Bonn, Germany

GIZ is responsible for the content of this publication.

Printed and Distributed by
2021 Deutsche Gesellschaft für Internationale Zusammenarbeit (GIZ) GmbH

Publication Date and Place
April 2021, Eschborn
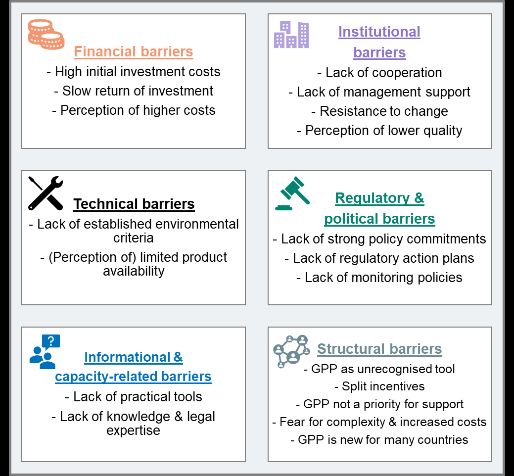
Table of Contents
List of Figures............................................................................................................................................................................................. 2
List of Tables .............................................................................................................................................................................................. 3
Abbreviations .............................................................................................................................................................................................. 4
Summary........................................................................................................................................................................................................ 5
1. Background and Objective................................................................................................................................................................ 7
2. Air Conditioning in public buildings ............................................................................................................................................ 9
2.1 Key results from the survey...........................................................................................................................................................9
2.2 Modelling of baseline AC and estimation of mitigation potentials .................................................................. 12
2.3 Maintenance and refrigerant management practices ................................................................................................. 14
3. Typical public procurement practice ....................................................................................................................................... 15
3.1 Scope of public procurement ........................................................................................................................................................ 15
3.2 Description of public procurement procedure of cooling appliances ................................................................... 16
4. Barriers .................................................................................................................................................................................................. 21
4.1 Overview of typical barriers of Green Public Procurement ........................................................................................ 21
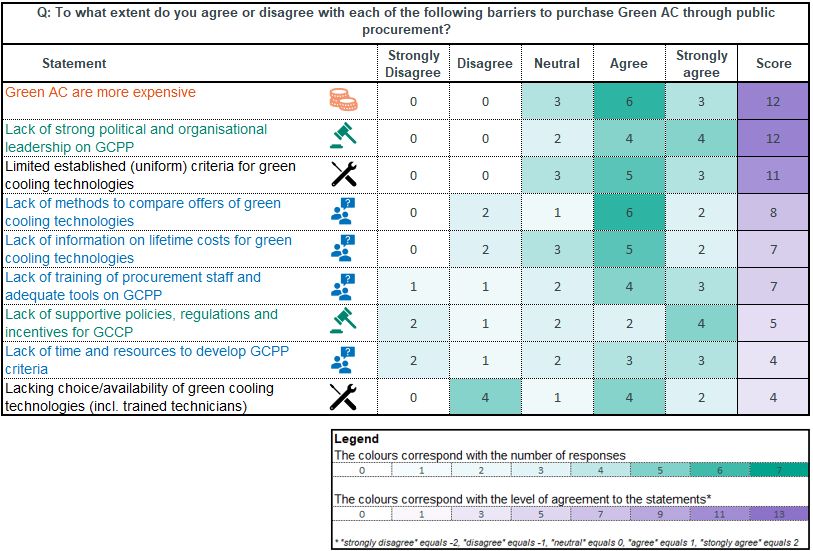
4.2 Cooling specific barriers- Survey results.............................................................................................................................. 24
5. Ways to overcome barriers .......................................................................................................................................................... 27
5.1 Overview of typical enablers of Green Public Procurement ....................................................................................... 27
5.2 Cooling specific enablers - Survey results .......................................................................................................................... 28
6. Selected country cases .................................................................................................................................................................. 31
6.1 GPP in Costa Rica ................................................................................................................................................................................ 31
6.2 Bulk Procurement of room ACs in India ................................................................................................................................. 32
6.3 Other best practice cases for GPP ............................................................................................................................................ 33
7. Green AC criteria and ways to move forward...................................................................................................................... 36
7.1 Admissibility Criteria for Green ACs ..................................................................................................................................... 37
7.2 Strategies to move forward ........................................................................................................................................................ 40
References ................................................................................................................................................................................................. 42
Annex I Political Background: Montreal Protocol and Kigali Amendment ................................................................... 45
Annex II: Specifications of split ACs ............................................................................................................................................. 47
Annex III: Tenderer questionnaire concerning green public procurement of split ACs.......................................... 49
GIZ Proklima, C4 – Green Cooling in Public Procurement
1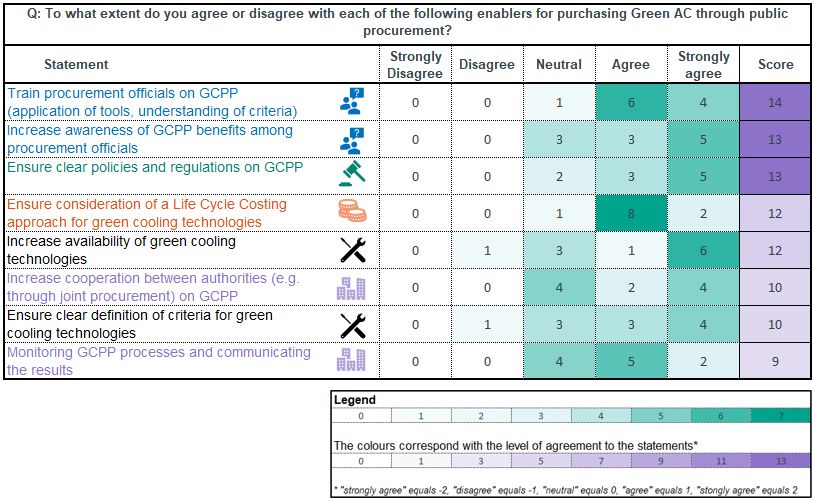
List of Figures
Figure 1 Barriers and Enablers of Green Public Procurement ................................................................................................................. 6
Figure 2 Avoid-, Shift- and Improve- approach to reach low-carbon buildings (Amended from PEEB, 2020) ......... 7
Figure 3 ACs in sample of public buildings by AC type: shares of total cooling capacity (left side), shares of total
installations (right side) ................................................................................................................................................................................................10
Figure 4 Sustainable Public Procurement and Green Public Procurement (adopted from GIZ (2019), adjusted by
authors) ....................................................................................................................................................................................................................................15
Figure 5 Standard (G)PP procedure. The elements in green indicate where GPP is additional to or different from
conventional PP. ..................................................................................................................................................................................................................17
Figure 6 Priorities of environmental issues when implementing GPP ...............................................................................................18
Figure 7 Priorities regarding the procurement of ACs ................................................................................................................................20
Figure 8 Overview of barriers to implementation of Green Public Procurement, based on various literature sources
......................................................................................................................................................................................................................................................23
Figure 9 Overview of barriers to purchase Green ACs through public procurement. The colours correspond with
the barrier types categorised in Figure 3 ...........................................................................................................................................................25
Figure 10 Overview of typical enablers for implementation of Green Public Procurement ..................................................28
Figure 11 Overview of enablers to purchase Green ACs through public procurement - level of agreement on
suggested enablers. The colours correspond to the enabler types categorised in Figure 7 ...............................................29
Figure 12 Best practice cases for GPP .................................................................................................................................................................35
Figure 13 Total-Equivalent-Warming Impact calculation ..........................................................................................................................37
Figure 14 HFC Phase-down schedules of the Kigali Amendment .........................................................................................................46
Figure 15 Split residential and commercial ACs ............................................................................................................................................47
Figure 16 Recommended requierements for noise emissions .................................................................................................................50

GIZ Proklima– Green Cooling in Public Procurement                                                                                                                                                                                                    2
List of Tables
Table 1 Air-conditioned space, electricity consumption, benchmarking (intensities of AC electricity and cooling
capacity) and shares of single split ACs up to 7.4 kW of cooling capacity of the assessed public buildings .......11
Table 2 Key characteristics of average single split AC (cooling capacity up to 7.4 kW) used in public buildings
compared with Green AC ...............................................................................................................................................................................................13
Table 3 Results from an energy monitoring in Grenada 2018 ................................................................................................................14
Table 4 Proposed admissibility criteria for single split ACs...................................................................................................................39
Table 5 Guiding Steps ......................................................................................................................................................................................................40
Table 6 Refrigerants of Split ACs adapted from the GIZ Proklima input (supported by the U4E Air Conditioners
Taskforce experts) in UNEP 2017, p. 28 ...............................................................................................................................................................47

GIZ Proklima– Green Cooling in Public Procurement                                                                                                                                                                          3
Abbreviations

 AC                                      Air Conditioner
 BMU                                     German Federal Ministry for the Environment, Nature Conservation
                                         and Nuclear Safety
 C4                                      Cool Contributions fighting Climate Change
 CEGESTI                                 Centro de Gestion Tecnologica e Informatica Industrial
 CFC                                     Chlorofluorocarbons
 COP                                     Coefficient of Performance
 EER                                     Energy Efficiency Ratio
 F-Gases                                 Fluorinated greenhouse gases
 GDP                                     Gross Domestic Product
 GHG                                     Greenhouse Gas
 GIZ                                     Deutsche Gesellschaft für Internationale Zusammenarbeit (GIZ)
                                         GmbH
 GPP                                     Green Public Procurement
 GWP                                     Global Warming Potential
 HCFC                                    Hydrochlorofluorocarbon
 HEAT                                    Habitat, Energy Application and Technology GmbH
 HFC                                     Hydrofluorocarbon
 ICE                                     Costa Rican Institute of Electricity
 IEA                                     International Energy Agency
 ISEER                                   Indian Energy efficient Ratio
 IPCC                                    Intergovernmental Panel on Climate Change
 JP                                      Joint Procurement
 KA                                      Kigali Amendement
 LCC                                     Life Cycle Costing
 LCCP                                    Life Cycle Climate Performance
 MoEF&CC                                 Ministry of Environment, Forest and Climate Change’s
 MEPS                                    Minimum Energy Performance Standard
 MIT                                     Mitigation scenario
 MP                                      Montreal Protocol
 MRA                                     Mutual Recognition Agreements
 ODP                                     Ozone Depleting Potential
 ODS                                     Ozone Depleting Substances
 PA                                      Procurement Authority
 PP                                      Public Procurement
 RAC                                     Refrigeration and Air Conditioning
 RAC&F                                   Air-Conditioning and Foam Sector
 SPP                                     Sustainable Public Procurement
 TEWI                                    Total Equivalent Warming Impact
 UNEP                                    United Nations Environment Program
 UNFCCC                                  United Nations Framework Convention on Climate Change

GIZ Proklima– Green Cooling in Public Procurement                                                           4
Summary
Green Cooling has a high potential to reduce costs, energy and the climate impact of public buildings.
Surveys conducted in multiple countries in the framework of this study show that:
• Air conditioning in public buildings is often responsible for about 50% of total electricity
consumption and single-split ACs alone account for approx. 40% of total installed cooling
capacity.
• Replacing an average split AC installed in a public building within the cooling capacity range
up to 7.4 kW with a Green AC of the same cooling capacity, an annual electricity saving of
approx. 1,000 kWh on average can be achieved.
• The electricity saving potential amounts to 28% of the baseline electricity consumption,
providing promising framework conditions in terms of energy cost savings for the conversion
to Green ACs. Furthermore, with the envisaged annual growth rate of 4.4 % on average, demand
is expected to increase.
• In addition to reducing energy consumption, replacing a conventional AC with a Green AC offers
in average an annual GHG emission reduction potential of 1,100 kg CO2eq, which equals to 52%
of the baseline emissions.1
Enablers for and barriers preventing Green Cooling in public procurement can be divided into
information and capacity-related, financial, technical, regulatory and political, structural as well as
institutional categories. According to the respondents the following barriers are most dominant:
• Financial barriers, in particular the high initial investment costs that usually come with more
efficient (Green) ACs. Procurement authorities (PA) still evaluate lowest purchase costs
together with good product service as the main procurement criteria for ACs, without
considering the life cycle costs of ACs. Even though the procurement of Green ACs generates
cost savings, reducing costs are often not seen directly as a result of implementing GPP.
• Political & regulatory barriers, in particular the lack of (political) leadership to adopt more
ambitious GPP targets and action plans.
• Technical barriers, in particular the lack of environmental procurement criteria to promote
Green Cooling technologies.
Regarding the most important barrier, the financial barrier, respondents frequently agreed that
consideration of lifecycle costs would enhance the implementation of GPP of cooling appliances.
Furthermore, respondents described training of committed staff and awareness-raising among
procurement units as important enablers towards enhanced GPP.
1
In addition to reducing energy consumption, Green ACs almost completely avoid direct emissions caused by refrigerants leaking into the
atmosphere during installation, operation and at end of life. While conventional split ACs use refrigerants with an average GWP of 1,829,
Green ACs use propane as a refrigerant with a negligible GWP of 3
GIZ Proklima– Green Cooling in Public Procurement 5Figure 1 Barriers and Enablers of Green Public Procurement
In order to assess the performance of AC, three types of criteria are relevant:
• Technical Performance, including cooling capacity (measured in kWh, TONs, BTUs, etc.) and
energy efficiency (measured as EER, COP, SEER, etc.)
• Life Cycle Costing (LCC) including the cost of purchase, transport, installation, maintenance,
operation, and end-of-life (recycle of material, recovery and reuse or destruction of ozone-
depleting or GHG refrigerants)
• Life Cycle Climate Performance (LCCP) or Total Equivalent Warming Impact (TEWI), measuring
the climate impact of a product over its lifetime.
The information provided within this study shall serve as a basis on tackling barriers in introducing
GPP as well as updating procurement criteria of room Air Conditioners in order to reduce cooling
related energy consumption and GHG emissions of public buildings.
GIZ Proklima– Green Cooling in Public Procurement 61. Background and Objective Space cooling in buildings is growing at a massive rate. As of 2017, almost 129 million air conditioning units have been sold in the global market (JARN, 2018). Roughly 100 million small capacity single- split air conditioners (ACs) are at the forefront. This growth is driven by increasing ambient temperatures, growing middle-class populations and high urbanization rates. Inefficient building and cooling management as well as inefficient cooling appliances using climate- damaging refrigerants result in growing energy use, costs and greenhouse gas (GHG) emissions. Without serious interventions, GHG emissions from buildings are expected to triple over the next three decades which calls for more efficient, climate-friendly appliances and buildings to decouple electricity use, costs and GHG emissions from this growing cooling demand. In many countries space cooling in public sector buildings accounts for over 50% of building’s energy demands, especially in tropical and subtropical areas. An energy audit conducted 2017 in 15 public buildings in Grenada found that space cooling was with up to 69% (Ministry of Education) by far the largest contributor in some buildings. Meanwhile public buildings have a huge potential to demonstrate and promote pioneering Green Cooling solutions, however the potential remains largely untapped. Despite the massive potential to cut energy costs and GHG emissions and the allegedly lighthouse function, public entities often struggle to procure state-of-the-art cooling technologies. Whereas advancing building codes and improving building design to reduce the cooling demand is the ultimate sustainable way forward as long-term measure (avoid and shift approach), immediate actions can be undertaken through the promotion of high efficiency air conditioners (ACs) using climate-friendly refrigerants, in the following stated as Green ACs. Figure 2 Avoid-, Shift- and Improve- approach to reach low-carbon buildings (Amended from PEEB, 2020) The term “Green Air Conditioner” is used to define an environmentally-friendly room AC that stands in contrast with conventional room ACs that are currently in use. To qualify as a climate-friendly and energy efficient “Green AC”, two fundamental criteria need to be fulfilled: i) Use of climate- and ozone-friendly refrigerant with a low GWP, more precisely natural refrigerants such as propane; ii) High energy efficiency (at least the top star label category in the target country). GIZ Proklima– Green Cooling in Public Procurement 7
Green ACs can be promoted through the regulatory framework of green public procurement. Sustainable
and green public procurement plays a key role in raising awareness and bringing green technologies
to the market faster.
The GIZ project “Cool Contributions fighting Climate Change” (C4), commissioned by the Federal Ministry
of Environment, Nature Conservation and Nuclear Safety aims to further pursue an international control
for F-gases, found in the refrigeration, air-conditioning and foam sector (RAC&F). The improved
framework conditions will encourage the use of energy efficient RAC&F equipment and environmentally
friendly natural refrigerants and blowing agents. In this context, the project sees great potential in the
introduction of Green Cooling Technologies in public buildings through public procurement.
This study has been conducted:
a) to highlight the mitigation potential of space cooling in the public sector through the application
     of Green Cooling
b) to identify and analyse typical barriers that prevent public entities from procuring Green ACs,
c) to elaborate ways to overcome these barriers and draw general recommendations on how to
     advance Green ACs in public procurement
d) to identify best practices of sustainable and green public procurement and
e) to contribute to unlocking this huge potential of Green Cooling in the public sector.

The study focuses on single split-type ACs with a cooling capacity of up to 7.4 kW for use in public
buildings, such as government administration buildings, hospitals or universities. Based on a
comprehensive research and structured interviews with responsible facility managers, procurement
units and regulatory authorities in Bangladesh, Costa Rica, Grenada, India, Iran and the Philippines,
the potentials of GPP and the introduction of ambitious procurement criteria for Green ACs to save
emissions and energy are presented. 22 surveys have been conducted and technical specifications
related to building design and air-conditioning appliances in use from 11 buildings have been used for
the analysis in Chapter 2.

At this point we would like to thank all participants of the study. The significance of this study could
only be made possible through your openness and participation.

GIZ Proklima– Green Cooling in Public Procurement                                                       8
2. Air Conditioning in public buildings
In many countries, the public sector is responsible for large shares of national space cooling demand.
Moreover, energy related emissions from space cooling often exceeds 50% of the total emissions in
such buildings, without taking into account direct emissions from leaking refrigerants.
Based on the interviews of facility managers in Bangladesh, Costa Rica, Grenada, India, Iran and the
Philippines, air-conditioning technologies in public buildings were analysed, taking into account energy
performance and refrigerant use. Split AC systems with cooling capacities up to 7.4 kW (24,000
BTU/hour) are put into the spotlight, with the aim to assess the market potential of Green ACs. Green
ACs are characterised by high energy efficiency and the use of refrigerants with minimum GWP, such
as propane (R290). Such ACs are currently available in mini-split AC size classes with cooling
capacities up to 7.4 kW.
2.1 Key results from the survey
Characteristic data of the 14 analysed public building sites are illustrated in Table 1, representing
weighted averages of the best estimates provided by the surveyed facility managers and others sources:
• total air-conditioned space
• average temperature setting of the ACs
• total electricity consumption and specific for air conditioning (estimated % share of ACs in
total electricity consumption)
• cooling capacities of installed ACs
• the relevance of split air-conditioning systems with up to 7.4 kW cooling capacity with regard
to their share of the total AC cooling capacity in the building.
As a limited scope of data was provided for some of the building sites, the full evaluation of split AC
technology was conducted for 10 buildings (see right column: Number of split ACs up to 7.4 kW).
Across the assessed buildings for which reliable information was available, air conditioning is
responsible for approximately 49% of total electricity consumption (weighted average), despite
relatively low shares in Bangladesh, Iran and partly in Grenada (General hospital). Room air set
temperatures are in a range of 18 to 24°C (20°C on average).
Based on the provided data, benchmarking values were derived for area-specific AC energy
consumptions (AC energy intensities) and AC cooling capacities. In weighted average, the AC energy
intensity is in the range of 79 kWh/m², the installed AC cooling capacity per cooled space amounts to
102 W/m².
Distributed among 10 public buildings2, single split ACs (up to 7.4 kW of cooling capacity) account for
approximately 1,647 kW, corresponding to a 39% share of the total installed cooling capacity of 4.2
MW used for air conditioning within the fully evaluated sample of public buildings (Figure 32, graph
on the left side). Split ACs with greater cooling capacities than 7.4 kW contribute 17% to the total
installed cooling capacity, the remaining half is provided by other AC systems (window-type ACs,
multi-split ACs, package/rooftop ducted systems, water chillers). In terms of total installations, 391
AC appliances were identified for the assessment, applying few estimations for the sites in India.
Single split ACs up to 7.4 kW clearly dominate (74%, representing approximately 289 appliances, again
applying few estimations for the sites in India) ( see Figure 32, graph on the right side).
2
Thereof, one building is supplied by large AC systems only (Grenada, Ministerial Complex).
GIZ Proklima– Green Cooling in Public Procurement 9Figure 3 ACs in sample of public buildings by AC type: shares of total cooling capacity (left side), shares of total installations (right side) GIZ Proklima– Green Cooling in Public Procurement 10
Table 1 Air-conditioned space, electricity consumption, benchmarking (intensities of AC electricity and cooling capacity) and shares of single split ACs up to 7.4 kW of cooling capacity of the assessed public
buildings

    Country          Facility                                        Total air-         Room air set       Total                 AC electr.           AC share on         AC electr.           Total         Cooling        Share of split ACs       Number of
                                                                     conditioned        temperature        electricity           consumption          electr.             intensity            cooling       capacity/      up to 7.4 kW on          split ACs
                                                                     space (m²)         (°C)               consumption           (MWh/a)              consumption         (kWh/m²)             capacity      area           total cooling            up to 7.4
                                                                                                           (MWh/a)                                                                             (kW)          (W/m²)         capacity                 kW
    Iran             German Iranian Chamber of Commerce                       1,320             18-22                      59                   22                37.5%               17               139          105                       11%                3

    Iran             Chamran Hospital                                         4,000                   22           Unknown                     N/A                  5%            N/A                  252             63                     55%            35
    Philippines      Office                                                   1,500                   18                  570                  N/A              unknown           N/A                   66             44                     9%             2*
    Philippines      Hospital                                                14,707                   20                 1,330                 864                 65%                59          1,274                87                     9%             18
                                                                                    3
    Costa Rica       Universidad de Costa Rica (UCR)                       270,703                N/A                17,436                    N/A                 N/A            N/A                  N/A          N/A                       N/A           N/A
    Grenada          Financial Complex Limited                               4,0644             22-24                     813                  341                42%5                84               N/A          N/A                       N/A           N/A
    Grenada          General hospital                                     unknown               22-24                    1,288                 348                 27%            N/A                  331          N/A                       97%            67
    Grenada          Ministerial Complex                                     7,0003             18-26                    1,235                 741                 60%            106                  593             85                     0%                 0
                                                                                    3
    Grenada          Ministry of Education                                   2,800              18-24                     326                  225                 69%                80                78             28                     7%                 2
    Grenada          Police Training School                               unknown               16-19                     285                  159                 56%            N/A                  134          N/A                       93%            27
    Grenada          Ministry of Infrastructure Development                   6,749               N/A                    1,235                 741                60%*            110                  N/A          N/A                       N/A           N/A
    India            DEBEL, DRDO, Ministry of Defence                     unknown               24-25                     N/A                  N/A                 N/A            N/A                  215          N/A                     100%            35*
    India            Hindustan Aeronautics Ltd                                    500             N/A                     N/A                  N/A                 70%            N/A                  352          703                     32%*            N/A
    Bangladesh       Public Works Department                                  2608                    22                  799                  160                 20%                61               747   287                              79%            79
    Total                                                                  315,951                                   25,377                   3,602                                               4,183                                                     268
                                                                                                                                                                      6                    7                            8                        9
    Average                                                                                                                                                       49%                 79                            102                     39%

3
 * Estimated
3
  University campus consisting of 337 buildings
4
  Total floor area, no distinction of air-conditioned space in particular
5
  Including ventilation
6
  Based on total annual electricity consumption of 6.57 GWh, considering only sites for which AC-specific electricity consumption was given in a plausible range or could be derived.
7
  Weighted average based on the subtotals of all buildings for which total air-conditioned space and electricity consumption for AC was given in a plausible range: 2,935,000 kWh of electricity consumption for AC and 36,640 m² of air-
conditioned space.
8
  Weighted average based on the subtotals of all buildings for which total air-conditioned space and installed cooling capacity was given in a plausible range: 2,755 kW of installed cooling capacity and 31,827 m² of air-conditioned space.
9
  Weighted average based on 3,435 kW of total installed cooling capacity.

GIZ Proklima– Green Cooling in Public Procurement                                                                                                                                                                                                                11
2.2 Modelling of baseline AC and estimation of mitigation potentials
Based on the collected data for split ACs with cooling capacities up to 7.4 kW, the average
characteristics for this appliance type are summarised in Table 2 (see baseline AC), using weighted
averages in order to reflect the number of appliances represented by each data. Using this approach,
the ‘standard’ cooling capacity within the single split AC size category is assumed as 5.3 kW. The
averaged energy efficiency ratio (EER) adds up to 3.1 (in W/W), within a range from 2.49 up to 4.16.
Likewise, broad ranges were given for operating hours and expected equipment lifetime, resulting in
2,352 annual operating hours (based on 45 hours per week) and 14.4 years of expected useful
equipment lifetime on average. For these indicative values it should be noted that participating
countries are characterised by greatly varying climate from one to another. Out of the split ACs with
cooling capacities up to 7.4 kW, 44% were found to use R22, 55% to use R410A and 1% to use R32,
resulting in an average GWP of 1,835. It should be noted that R22 has ozone depletion potential (ODP)
in addition to a high global warming potential (GWP)10. The production and consumption of R22 is
regulated in all countries in the course of the HCFC Phase-Out Management Plans, which is why there
is great potential for a direct switch to Green ACs, especially when replacing those outdated
technologies.
The refrigerant charge was found to be 1.94 kg on average (1.89 kg for ACs up to 7.4 kW) The
approximate annual in-use leakage rate was derived in the range of 18.1% (based on data provided
for refilling of refrigerant, referring to all AC systems). It is noteworthy that especially the data for
energy efficiency and in-use refrigerant leakage (two sites, both Iran) rely on very few responses. This
is particularly relevant when considering annual in-use leakage rates, as these are subject to vague
assumptions which vary from country to country and the resulting emissions therefore differ greatly.
The mitigation potential by using Green ACs in public procurement is assessed by comparing the
elaborated baseline AC with the performance characteristics of a Green AC in the same cooling size
(based on the 5.0 kW model) which are provided in the right column of Table 2.
10
According to IPCC Fifth Assessment Report (2014) R22 has and ODP of 0.06 and a GWP of 1760:
https://www.ipcc.ch/site/assets/uploads/2018/02/WG1AR5_Chapter08_FINAL.pdf
GIZ Proklima– Green Cooling in Public Procurement 12Table 2 Key characteristics of average single split AC (cooling capacity up to 7.4 kW) used in public buildings compared with
Green AC
Criterion Baseline AC Green AC11
Cooling capacity (kW) 5.3 5.3
Energy efficiency ratio (W/W) 3.1 4.312
Annual operating hours (h) 2,352 2,352
Lifetime (years) 14 14
Refrigerant type 44% R22 R290
55% R410A
1% R32
Average GWP 1,835 3
Initial refrigerant charge (kg) 1.89 0.34
Annual refrigerant leakage (in-use, in 18.1% 18.1%
relation to initial refrigerant charge)
Annual energy consumption (kWh)13 3,016 2,174
Total annual GHG emissions (kg CO2eq)14 2,123 1,028
Direct annual GHG emissions (kg CO2eq) 697 0.21
Indirect annual GHG emissions (kg CO2eq) 1,426 1,028
By replacing an average split AC installed in a public building within the cooling capacity range up to
7.4 kW (baseline AC) with a Green AC of the same cooling capacity, annual electricity savings of 842
kWh can be achieved on average. The electricity saving potential amounts to 28% of the baseline
electricity consumption, providing promising basic conditions for inverting into Green ACs. Moreover, a
growing demand can be expected from the provided annual AC growth rate of 4.4% on average
(responses ranging from 0 to 10%, based on the number of operating AC appliances at each site). The
energy calculations are based on 2,352 annual operating hours and include a load factor of 0.75 (based
on CDM Tool 29) for using EER values as energy performance indicator. Replacing one baseline AC
with a Green AC of the same size offers annual GHG emission mitigation potential in the range of 1095
kg CO2eq, including direct emissions, making up 64% of the total mitigation potential and indirect
emissions, contributing the remaining 36%. The total mitigation potential represents a 52% share of
the baseline emissions, assuming an averaged grid emission factor across the six interviewed countries
of 0.473 kg CO2/kWh.
In addition to looking at energy and emissions savings, including life-cycle costs in procurement
criteria provides convincing arguments for buying Green ACs. The average 28% energy savings already
mentioned above automatically lead to long-term cost savings. Results from the energy monitoring in
a public building in Grenada from 2018 show that replacing an old AC with a R290 split AC paid for
11
Examples for existing R290 models: Godrej GSC 12 GIG 5 DGOG, GSC 18 GIG 5 DGOG (both inverter type) and GSC 12 FG8 MOG, GSC 18 FG8
MOG (both fixed speed); EER for fixed speed ACs by Godrej between 3.9 and 4.0. An overview of existing Green AC Models can be found in
Annex II
12
EER estimated based on specifications given in Indian SEER (ISEER)
13
Following the CDM calculation method (Tool 29)a, a load factor of 0.75 is taken into account.
14
Indirect GHG emissions based on a grid emission factor of 0.473 kg CO2/kWh (average across the 6 interviewed countries), using the IFI
dataset by UNFCCC.
GIZ Proklima– Green Cooling in Public Procurement 13itself after only 12 months (see Table 3). This highlights the relevance of using the Return on
Investment (ROI) or life-cycle-analysis such as life cost assessments within procurement processes.
Table 3 Results from an energy monitoring in Grenada 2018
Replaced R410a New R290 split
HFC-Unit AC Unit
Average consumption 16.93 kWh 8.41 kWh
Efficiency gain 50 %
Total kWh consumption* 593 kWh 306 kWh
Operating Cost** 207 $ 107 $
Savings 100 $
Comparable unit cost*** 1,180 $
Pay back in months 12
CO2e 373.41 192.62
*measurements have been taken once a day, over a time period of 35 days
**referring to the entire monitoring period and an electricity price of 0.35$/kWh
***costs of an average split AC Unit sold in Grenada
2.3 Maintenance and refrigerant management practices
This chapter summarizes the interview results on maintenance and refrigerant management practices.
Out of a wide range from once a year up to once a week, general maintenance was specified to be
conducted every 6.1 months on average and refilling of refrigerant every 7 months on average. One
respondent clarified that general maintenance and refilling of refrigerant are both carried out upon
demand without a specific schedule. Only two answers were provided for refrigerant consumption,
adding up to 55 kg of R22 and 23 kg of R410A annually. Under consideration of the aggregated
refrigerant charge sizes at both sites, annual in-use leakage rates were found in a range from 18 to
32%, with the resulting weighted average (considering the number of AC installations for both sites)
of 20.1%.
Concerning the decommissioning of ACs after their useful life and related refrigerant management,
half of the responses indicated a poor level of organisation. Decommissioned ACs are disposed (no
further clarification within the surveys) after checking for useful parts for reclamation and refrigerants
are mostly purged or there is no contrary knowledge. The other half indicated a certain level of
organisation which appears to be commonly informal for refrigerant handling. Such responses referred
to government regulations or at least clearance by state auditors and/or the engagement of authorised
waste companies for the disposal of the ACs. For refrigerant handling, this other half of responses
indicated a variety of scenarios. Either it was indicated that the refrigerant stays inside the AC,
reclamation was assumed without further knowledge, or it was clarified that a possible recovery of
the refrigerant should be examined by the technicians in charge. Two out of nine answers (22%)
indicated the existence of one authorised collection center for refrigerants.
GIZ Proklima– Green Cooling in Public Procurement 143. Typical public procurement practice 3.1 Scope of public procurement Public Procurement (PP) is a key economic activity of governments and public institutions. It refers to “the acquisition of goods and services by governments or public sector organisations through a public contract” (Witjes & Lozano, 2016, p. 38). PP covers a wide range of goods and services such as the acquisition of health care services, public transport, education, buildings, infrastructure, among others (The World Bank, 2017). Estimates suggest that PP accounts for 15-30% of the gross domestic product (GDP) in low-income countries and is therefore seen as an important policy tool to pursue societal, economic and environmental standards (Brammer & Walker, 2011; The World Bank, 2017). Under Joint Procurement (JP), two or more procuring authorities combine their procurement activities. Public authorities can then together create economies of scale, by procuring large volumes of products or services, while saving administrative costs and sharing of procurement skills and expertise (European Commission & DG Enviroment, 2008). As soon socio-economic and environmental criteria are integrated into the procurement procedure, it is referred to as Sustainable Public Procurement (SPP) (Brammer & Walker, 2011). Figure 4 illustrates how SPP is built on the three main pillars of sustainable development – i.e. economic, social and environmental impact (European Commission, 2019). Procurement unit representatives from the sample countries referred to environmental aspects when they were asked about the most important sustainability aspects covered in conventional PP procedures. Figure 4 Sustainable Public Procurement and Green Public Procurement (adopted from GIZ (2019), adjusted by authors) If environmental criteria obtain extensive focus during the procurement procedure, it is referred to as Green Public Procurement (GPP), as it is illustrated on the right-hand side of Figure 4. GPP is therefore defined as “a process whereby public authorities seek to procure goods, services and works with a reduced environmental impact throughout their life cycle when compared to goods, services and works GIZ Proklima– Green Cooling in Public Procurement 15
with the same primary function that would otherwise be procured ” (Commission of the European
Communities, 2008). Public authorities can use GPP to meet their environment-related targets, they
can set an example to private consumers and can raise awareness among the society of environmental
issues. GPP is said to encourage the spread of environmentally advanced technologies, innovation,
research and development (R&D), as public authorities actively seek and prefer products or services
that have the lowest negative impact on the environment throughout their life cycle (Brouwer et al.,
2006; Uyarra & Flanagan, 2009). As opposed to evaluating investment costs, which is common under
conventional PP, life cycle costs play a central role under GPP. This way, several characteristics of
the product or service, such as energy efficiency, obtain more value during the procurement process.
This means that products or services which meet a certain environmental standard have a higher
chance of being purchased (see Section 0 for an elaboration on bid evaluation). GPP may cause spill
over effects to the private sector, stimulating the adoption of environmental standards there as well,
and increase awareness of environmental issues (European Commission, 2020; Simcoe & Toffel, 2014).
In other words, due to their purchasing power, public authorities can make a significant contribution
to sustainable production and consumption, by creating a clear incentive to the private sector for
shifting to environmentally friendlier technologies and products.

Besides the environmental benefits, GPP also has political benefits, including it being an effective way
to demonstrate a public authority’s commitment to environmental protection. GPP, therefore, helps to
establish high environmental standards and can (in)directly improve quality of life – seen as social
and health-related benefits. Additionally, GPP has economic benefits, as it provides incentives for the
industry to innovate, it promotes green products and innovative technologies and can save money when
a product’s life cycle is considered (Denjean et al., 2015; European Union, 2010). This way, innovative
products can become cheaper through economies of scale, ultimately shifting the entire market towards
greener products (European Commission, 2020; European Union, 2010; Simcoe & Toffel, 2014; Uyarra &
Flanagan, 2009).

3.2 Description of public procurement procedure of cooling appliances

GPP can be an effective instrument to increase the share of environmentally friendly cooling appliances
in buildings as public authorities are generally responsible for a variety of building types such as
offices, schools or hospitals (The European Commission, 2016). Depending on the climatic zone, these
buildings require heating, ventilation and/or air conditioning, of which the latter is typically important
in hot and humid climates. As shown in Chapter 2, conventional cooling appliances use refrigerants
with a high GWP and are often run highly inefficiently, thus having a large impact on the environment,
which is why the wider use of climate and environmentally friendly alternatives is becoming
increasingly important. Public authorities have the responsibility and opportunity to encourage
investments in environmentally friendlier cooling appliances and can mandate energy performance
improvements by increasing the standards of cooling appliances in their procurements (IEA, 2018).

PP usually follows a common procedure, which contains four principal stages, as shown in Figure 5.
The PP procedure is often officiated in international and/or national law or agreements (Witjes &
Lozano, 2016), which was also confirmed by the survey participants. PP is generally led by dedicated
procurement staff, but the survey respondents clarified that (external) advisory committees may be
consulted during the PP procedures. While GPP mainly follows the same process, some aspects are
slightly different compared to conventional PP processes (see green elements in (Figure 5). Also, the

GIZ Proklima– Green Cooling in Public Procurement                                                      16
survey revealed that countries may have specific GPP laws that influence procurement activities. The
procurement procedure for cooling appliances is also based on the process illustrated in Figure 5.

Figure 5 Standard (G)PP procedure. The elements in green indicate where GPP is additional to or different from
conventional PP.

First, procurement authorities recognise and determine the demand for a product during the preparatory
stage. For cooling appliances, this may include the realisation that conventional cooling appliances
have a major impact on the environment and climate and therefor GPP regulations need to be applied.

Subsequently, PAs determine the required criteria of the good during the second stage: the specification
stage. These may include minimum criteria, or descriptive, more advanced criteria. The survey revealed
that specific GPP laws may determine minimum environmental criteria. PAs can include more ambitious
environmental criteria to shift towards GPP. According to the surveys conducted, GHG emissions
reduction, ozone depletion and air pollution are priority issues when implementing GPP (Figure 6).
Additional procurement staff – for example, a technical unit – may be responsible for determining the
technical aspects in the specification stage. For the procurement of cooling appliances, for example,
procures can include criteria regarding high energy efficiency, professional installation and
maintenance, refrigerants with very low GWP, such as hydrocarbons and extensive recycling practices.

GIZ Proklima– Green Cooling in Public Procurement                                                          17
Figure 6 Priorities of environmental issues when implementing GPP 15
The tender stage is the third procurement step, during which the procurement officers publish the
specified demand publicly as “calls for tenders”, often on online tender platforms, potential suppliers
respond with a bid and a contract between PA and supplier is signed. In the bid, suppliers illustrate
how they can meet the specifications and at what price. The supplier with the most advantageous bid
wins the tender, which often means the bid that meets all criteria with the lowest price. However,
there are other evaluation methods, by which quality criteria, such as environmental standards, become
more significant. Four alternative evaluation methods which are relevant for GPP of ACs are:

       •    Monetising environmental criteria
       •    Transforming price into a quality score
       •    Assessing lifecycle costs, instead of purchase costs alone
       •    Environmental criteria considered admissibility criteria

PA may decide to monetise the environmental criteria or take a broader approach when assessing the
best price for quality approach. For example, offers that meet certain environmental criteria could be
discounted, making them competitive with the cheapest options. Secondly, the offered price can be
transformed in a way that it is commensurate with the quality score – price is then valued in the
same way as other product criteria (Bergman & Lundberg, 2013; UNEP, 2015; Witjes & Lozano, 2016).
Thirdly, procurement units may decide to assess life cycle costs in the tender stage, as opposed to an

15
     Results derive from interviews with procurement units in the framework of the study in 2020

GIZ Proklima– Green Cooling in Public Procurement                                                   18
evaluation of purchase costs alone. For energy efficient cooling appliances, this may make a substantial difference. Energy efficiency differences can lead to a high variation in electricity consumption of cooling appliances and therefore affect the life cycle costs. The global best available air-conditioning equipment is up to five times more energy efficient than the least efficient ones currently available, but also has a higher purchase price. However, the life cycle cost benefits of a more energy efficient appliance highly depend on local electricity prices, which therefore also affects the return on investment (IEA, 2018). In the fourth stage, the utilisation stage, the product is delivered and the procuring organisation utilises it (Witjes & Lozano, 2016). During this stage, any direct impacts of GPP may become clear. The survey revealed that with the application of GPP, procurement units expect an increase in energy efficiency and a lower demand for resources, as well as a reduction in GHG emissions and environmental impact. Some others expect an improved quality of life as a result from implementing GPP. Survey results While the four stages summarise global practices, each country defines its own priorities while procuring, mainly affecting Stage 2 and Stage 3 of the PP procedure (see Figure 5). For the procurement of cooling appliances, the survey revealed that good product service and low costs are the most important aspects. Suppliers or local representatives with a good reputation are also found important (Figure 7). Of the aspects that relate to GPP, respondents indicated that high energy efficiency and environmentally friendliness are important. Although the lifecycle costs were not identified as one of the most important priorities during PP of cooling appliances, it was the only characteristic that no respondent disagreed with. It should be noted, however, that it is not specified in the question whether these aspects relate to Stage 2 or Stage 3 of the PP procedure. It may make a difference for PAs to include the aspects as criteria in Stage 2, or when they are part of the evaluation in Stage 3. GIZ Proklima– Green Cooling in Public Procurement 19
Figure 7 Priorities regarding the procurement of ACs 16

16
     Results derive from interviews with procurement units in the framework of the study in 2020

GIZ Proklima– Green Cooling in Public Procurement                                                  20
4. Barriers Although the implementation of GPP leads to many advantages – as shown in Chapter 3 – public authorities do not yet exploit GPP to its fullest potential (UNEP, 2017). In addition to GPP being a new concept for many countries, several types of barriers to implementing more sustainable and greener procurement have been identified in the literature (UNEP, 2015). 4.1 Overview of typical barriers of Green Public Procurement These barriers are very diverse and can be divided into financial, structural, institutional, technical, informational or capacity-related as well as regulatory and political barriers. Although the types of barriers are diverse and presented individually here, they are often related and interconnected. An overview of the barriers is presented in Financial barriers Financial barriers are mainly related, directly or indirectly, to the higher initial investment costs of environmentally friendly products, compared to conventional products and are said to be the biggest and most important barrier to GPP implementation (Brammer & Walker, 2011; Brouwer et al., 2006; European Commission, 2019; Montalban et al., 2017; UNEP, 2017). If only the investment costs are evaluated in the procurement process, which is common under conventional PP, environmentally friendly products are therefore perceived as more expensive (Butler & Keaveney, 2014). However, environmentally friendly products can lead to a reduction of costs during their lifetime, for example through energy savings, and thus be cheaper when assessing life cycle costs (also see table 3). Nonetheless, there may be a shortage of tools to conduct life cycle assessments (see informational and capacity-related barriers). Another aspect of high upfront investment cost is that the return on investment may take longer, which is a barrier for GPP when fast return of investment is a procurement criterion. Long-term cost benefits of high-efficiency technologies induced by energy savings may - in some cases - not guarantee a sufficiently fast return on investment (Butler & Keaveney, 2014). Institutional barriers Institutional barriers are specifically linked to the institutions that are involved in the procurement process and can be divided into inter-institutional and intra-institutional barriers. First, inter- institutional barriers relate to a lack of cooperation between public authorities, potentially leading to unfulfilled opportunities of – for example – coordinated information exchange on best practices (Chrintz, 2011; European Commission, 2019; UNEP, 2017; Zemgale Planning Region, 2017). This includes a lack of measurement and monitoring of environmental and/or social outcomes of GPP shared between institutions (UNEP, 2017). Secondly, intra-institutional barriers relate to the extent GPP is anchored in an organisation. This can be expressed through a lack of management support and resources dedicated to GPP (Brouwer et al., 2006; Delmonico et al., 2018; Montalban et al., 2017). Possible consequences of this include competing procurement practices (i.e. lack of personnel in procurement teams, which are overwhelmed with their workload), no systematic implementation and integration of GPP in management systems, and lack of time and resources to develop GPP criteria (Brammer & Walker, 2011; Brouwer et al., 2006; Delmonico et al., 2018; PRIMES, n.d.; UNEP, 2017). In addition, resistance to change in combination with a lack of GIZ Proklima– Green Cooling in Public Procurement 21
incentives among employees may result in conserving the conventional procurement practices (Butler
& Keaveney, 2014).

Technical barriers

Technical barriers can be summarised in two main categories: a lack of established criteria for
environmentally friendly products and a lack of available environmentally friendly products that meet
these criteria. Literature suggests that there are limited established environmental criteria,
sustainability standards, or profound ecolabels that PAs can apply in their GPP process (Chrintz, 2011;
European Commission, 2019; Zemgale Planning Region, 2017). Additionally, PAs may not have access
to applicable, uniform definitions of GPP (Hasanbeigi et al., 2019).

Another technical barrier is the potentially limited availability of products that meet the environmental
criteria (Butler & Keaveney, 2014; Hasanbeigi et al., 2019; UNEP, 2017). This may be a result of a lack
of exhaustive criteria in combination with a limited (environmental) awareness among suppliers
(Zemgale Planning Region, 2017).

Regulatory & political barriers

Regulatory and political barriers may be related to a lack of strong policy commitments or regulatory
action plans, as well as a lack of political and/or regulatory leadership and support towards GPP
(Brammer & Walker, 2011; Butler & Keaveney, 2014; Hasanbeigi et al., 2019; UNEP, 2017). Additionally,
a shortfall of enforcing rules and regulations has been identified, as well as a lack of monitoring and
evaluation of implemented GPP policies (UNEP, 2017).

Informational & capacity-related barriers

PAs may experience a lack of information and applicable tools to implement GPP. These informational
and capacity-related barriers can be related to a lack of market knowledge, limited awareness of the
importance of GPP and technological expertise. Capacity-related barriers may arise from a shortage
of practical tools to define and apply environmental criteria in the procurement process (Brammer &
Walker, 2011; Chrintz, 2011; European Commission, 2019; Hasanbeigi et al., 2019).

PAs may have insufficient knowledge about methods to measure life cycle costs – one of the key
aspects of GPP (GIZ, 2019; Montalban et al., 2017; UNEP, 2017). Moreover, a lack of legal expertise,
legal guidelines and uncertainty about the legal possibilities of incorporating environmental criteria
are potential barriers to GPP (Brammer & Walker, 2011; Chrintz, 2011; Hasanbeigi et al., 2019). PAs
may also experience a lack of information on the suppliers’ activities and operations and perceive
environmentally friendly products as products with lower quality (Brammer & Walker, 2011; Delmonico
et al., 2018; Hasanbeigi et al., 2019; UNEP, 2017).

Structural barriers

Structural barriers to GPP are barriers that are beyond the control of individuals or institutions and
shape the overall context of PP. They may be seen as overarching barriers anchored in the current PP
environment. A structural barrier to enhanced implementation of GPP may be that the purchasing
power of public authorities is not a commonly recognised tool towards an environmentally friendlier
society (UNEP, 2017). In addition, there is a question of split incentives, i.e. the organisation advocating
for GPP would not be the entity benefiting from the implementation of GPP and may not see direct
results (Brouwer et al., 2006; Montalban et al., 2017). At the same time, this means that authorities
that forward procurement requests to the central procurement units usually have little influence on

GIZ Proklima– Green Cooling in Public Procurement                                                        22
You can also read