Global Transcriptome Changes of Elongating Internode of Sugarcane in Response to Mepiquat Chloride
←
→
Page content transcription
If your browser does not render page correctly, please read the page content below
Global Transcriptome Changes of Elongating
Internode of Sugarcane in Response to Mepiquat
Chloride
Rongfa Chen
Chinese academy of agricultural sciences
Yegeng Fan
Chinese academy of agricultural sciences
Huiwen Zhou
Chinese academy of agricultural sciences
Shanping Mo
Chinese academy of agricultral sciences
Zhongfeng Zhou
Chinese Academy of Agricultural Sciences
Haifeng Yan
Chinese academy of agricultural sciences
Ting Luo
Chinese academy of agricultural sciences
Xing Huang
Chinese academy of agricultural sciences
Mengling Weng
Chinese academy of agricultural sciences
Prakash Lakshmanan
Chinese academy of agricultural sciences
Yangrui Li
Chinese Academy of Agricultural Sciences
Lihang Qiu ( qiulihang2017@126.com )
Sugarcane Research Institute, Guangxi Academy of Agricultural Sciences/Sugarcane Research Center,
Chinese Academy of Agricultural Sciences, No. 172, East Daxue Road, Nanning, Guangxi, 530007, China.
https://orcid.org/0000-0003-3369-0725
Jianming Wu
Chinese academy of agricultural sciences
Research article
Page 1/25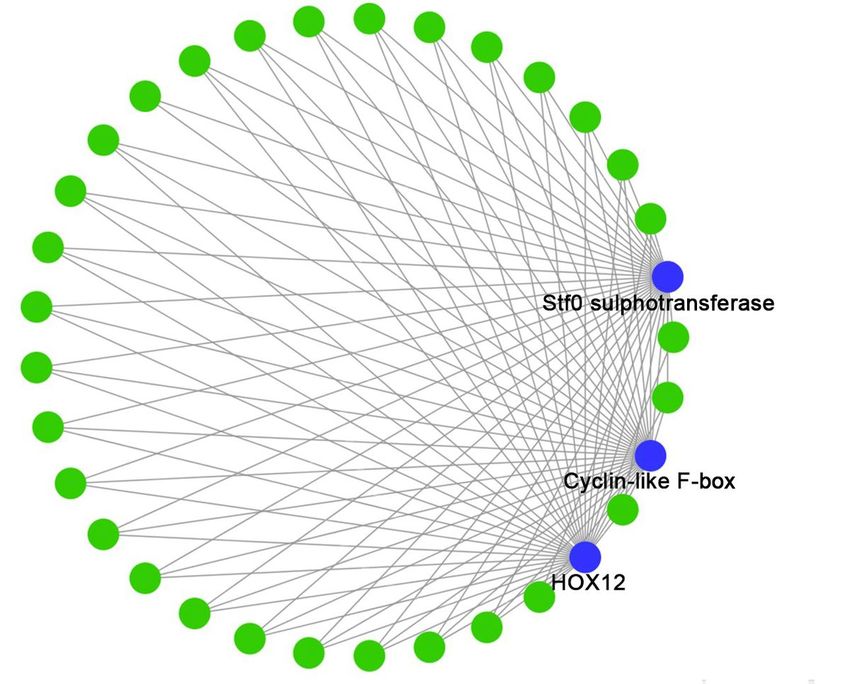
Keywords: Mepiquat chloride, Sugarcane, Full-length transcriptome, RNA-seq, Growth, Internode
Posted Date: August 12th, 2020
DOI: https://doi.org/10.21203/rs.3.rs-50175/v1
License: This work is licensed under a Creative Commons Attribution 4.0 International License.
Read Full License
Version of Record: A version of this preprint was published on January 25th, 2021. See the published
version at https://doi.org/10.1186/s12864-020-07352-w.
Page 2/25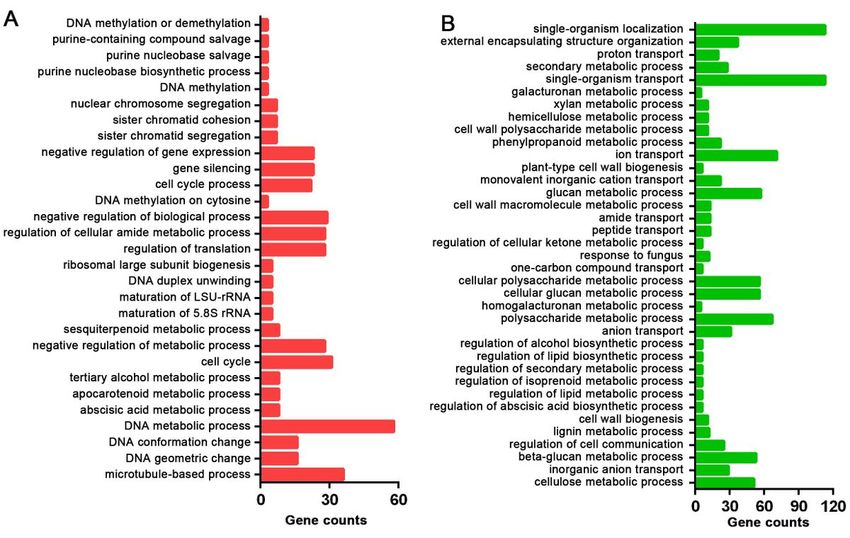
Abstract
Background: Mepiquat chloride (DPC) is an extensively used chemical to control internode growth and
compact canopies in cultured plants. Previous studies suggested that DPC could inhibit gibberellin
biosynthesis in sugarcane. Unfortunately, the molecular mechanism underlying the suppressive effects of
DPC on plant growth is still largely unknown.

Results: In the present study, we first obtained the high-quality long transcripts from internode of
sugarcane by PacBio Sequel System. A total of 72,671 isoforms with N50 as 3,073 were generated.
These long isoforms were used for the following RNA-seq as reference. Subsequently, short reads
generated from Illumina Hiseq 4000 platform were used for comparing the differentially expressed genes
in DPC and control groups. The transcriptome profiling showed the 6 days post DPC treatment had the
most significant changed genes. These genes were related to plant hormone signal transduction and
biosynthesis of several metabolites, indicating DPC affected multiple pathways beside depressed
gibberellin biosynthesis. The network of DPC on the key stage was illustrated by weighted gene co-
expression network analysis (WGCNA). Among the constructed 36 modules, the top positive correlated
module with stage of 6 day post spraying DPC was sienna3. Stf0 sulphotransferase, cyclin-like F-box and
HOX12 were the hub genes in sienna3 that had high correlation with other genes in this module. The
qPCR demonstrated the high accuracy of RNA-seq result.

Conclusion: Taken together, we demonstrated the key role of these genes in DPC-induced growth
inhibition in sugarcane.

1. Introduction
Hormone regulation in plant culturing has been widely used to control quality agricultural and
horticultural products [1]. Several hormones have effect on regulation and co-ordination of plant growth
[2]. Up to date, Auxin [3], gibberellin (GA) [4], Cytokinins (CTK) [5], abscisic acid (ABA) [6], ethyne (ETH) [7]
and brassinosteroid (BR) [8] are the most popular hormones to stimulate organism growth in crops.
However, growth appearance is not the only performance that matches the increasing demand made by
farmers. For example, with excessive vegetative growth, crops such as cotton and sugarcane could hardly
be controlled and lead to irregular height in farmland which result in low productivities [9, 10]. Thus, other
regulated chemicals have been introduced to inhibit the hormonal pathways.

Mepiquat chloride (DPC) is one famous chemical that control organism growth via suppressing the GA
pathways [11, 12]. As an exogenous plant growth regulator, DPC is a water-soluble material which
facilities the spraying in farmland [13]. With low dose DPC, the internode elongation and plant height
were reduced [13, 14]. Recent studies showed DPC could also regulated the synthesis of endogenous
hormones, carbohydrates, enzymes and other organic molecules [15, 16]. The DPC treatment increased
concentrations of chlorophyll, free proline and soluble proteins but depressed malondialdehyde levels
contributing to improve resistance to stress [17–19]. In addition, DPC promoted the calcium and

                                                    Page 3/25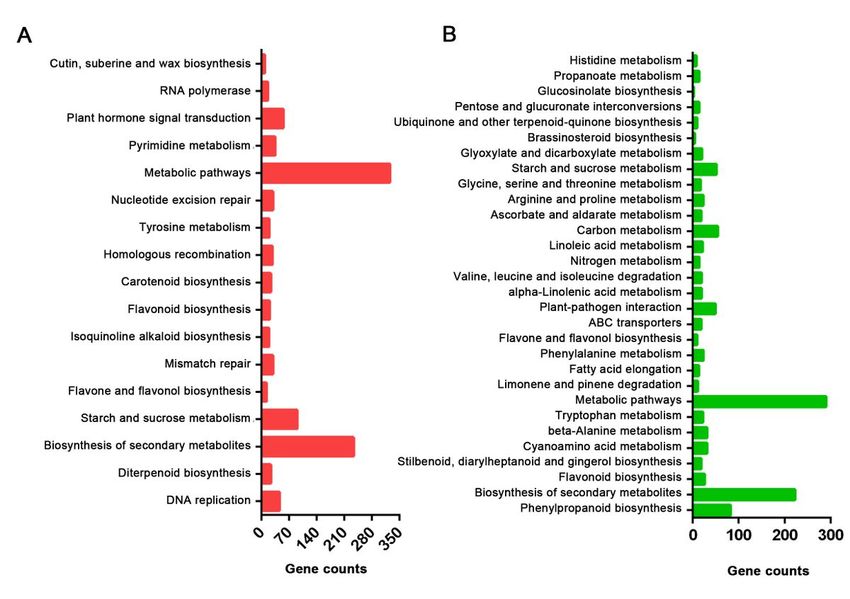
phosphorus levels in leaves to strengthen ability to anti-disease [20, 21]. By regulating CTKs and GAs
synthesis as well as controlling the ratios of CTKs:GA, DPC mediated rhizogenesis [22]. Therefore, the
function and its regulatory role of DPC is far away from systematically understand.

Sugarcane is a major agricultural crop for sugar production over the world [23–25]. Globally, about 80%
sugar is isolated from this crop and sugarcane thus, becomes the critical bioenergy crop [26]. Sucrose is
primarily generated in sugarcane stem and higher shoot [27, 28]. The internode elongation of stem is
associated with the deposition of sucrose [29]. In this situation, GA is employed to stimulate internode
elongation [30]. However, the rapid growth of stem may lead to lower sucrose accumulation [31, 32]. The
balance of stem growth is the key question for sugar production. DPC is introduced to control the
negative effects of GA treatment [33]. Although, DPC is a widely recognized as regulator for GA and
promotes the ability of resistance to stress [34, 35], the underlying molecular mechanism is still unknown.
The widely scanning of systematic regulation of DPC on plant is needed.

Previous study showed that during internode elongation, the regulation by microRNA-mRNA network in
zeatin biosynthesis, nitrogen metabolism and plant hormone signal transduction pathways participated
in stem growth in sugarcane [36, 37]. These effects may be mediated by GA20-oxidase (GA20-OX1) and
gibberellin receptor (GID1). The DPC has shown the inhibited effects on GA generation by suppressing the
activities of copalyl diphosphate synthase and ent-kaurene synthase [13]. These results revealed the
molecular mechanism in controlling growth performance by DPC. Still, large information about DPC roles
in growth and e resistance to stress regulation is unknown. Herein, we used Weighted Gene Co-expression
Network Analysis (WGCNA), a mathematical method to identify key gene network and hub genes [38–40].
The present study was conducted which focused on the transcriptome changes by DPC treatment using
Illumina Hiseq 4000 platform. These evidences presented here provide new insights on DPC function in
controlling stem growth as well as regulating resistance to stress which are the two most economically
important traits, in sugarcane.

2. Materials And Methods
2.1 Sugarcane preparation
All the tested sugarcanes were bred in the Sugarcane Research Institute (SRI), Guangxi Academy of
Agricultural Sciences, Nanning, China. The sugarcane variety was GT42 sourced from SRI Experimental
Farm at Nanning, China. The 10 months mature cane stalks were selected to obtain buds in the middle
internodes and the buds were cut into setts from single-bud. The setts were incubated in 52 °C for 30 min
to eliminate pathogenic bacteria. The setts were planted into a moist sandbox and maintained artificial
climate box (Essenscien, USA). The culturing conditions were temperature 28.0 ± 0.1 °C, humidity: 75 ±
1.5% RH, photoperiod: 12 h light and 12 h dark with 100% full light (light intensity 25000 LX). The 2-leaf
stage seedlings were transferred to plastic pots (35 cm width × 35 cm length × 50 cm height). In each pot,
two seedlings were planted. After 5 days, the seedlings were divided into two replicates randomly. The
seedlings were cultivated to the to pre-elongation stage which contained 9–10 leaves defined as the early
                                                 Page 4/25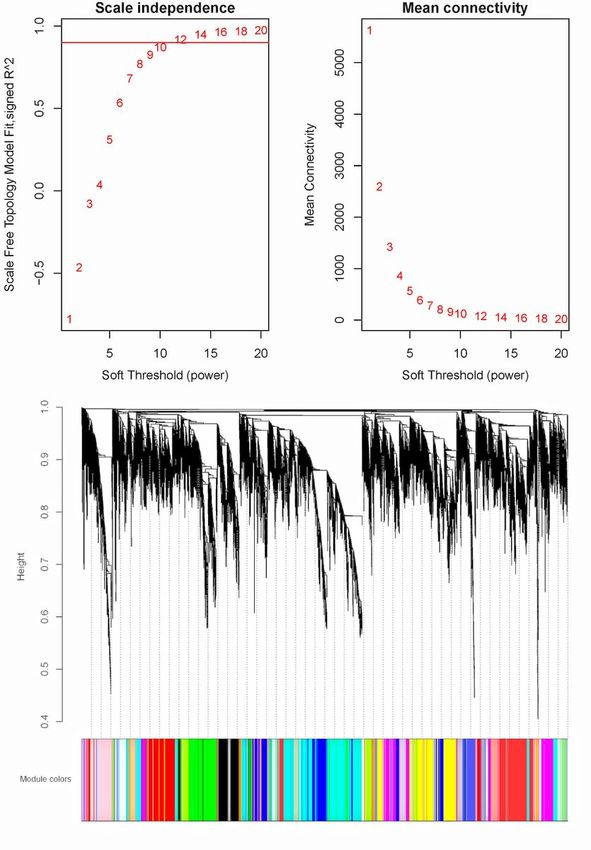
elongation stage. In this stage, the DPC group was sprayed with 200 mg/L DPC (Solarbio life science,
Beijing, China Beijing, China) until the solution drops down from leaves. Water was sprayed for the
control group in similar pattern. All the sugarcane pots were settled on a greenhouse in 18 rows with
1.2 m width. The first three columns belonged to control and the last three columns belonged to DPC
group. At 0, 3, and 6 days post spraying, the third internodes were obtained for further assays. The control
samples from 0, 3, and 6 days post spraying were named C1, C2 and C3, respectively. The samples of
DPC group from 0, 3, and 6 days post spraying were named D1, D2 and D3, respectively. All the samples
were store at − 80 °C until RNA isolation. For each group at different time point, 3 biological replicates
were collected for analyses.

2.2 Determination of growth performance
The sugarcane growth performance was measured from control and DPC groups. At the 0, 3 and 6 days
post spraying, the stalk height from the soil surface to the dewlap of youngest fully expanded leaf and
the length of the internodes. For each group, five plants were randomly chosen for measuring. The whole
height and the first seven internode length (from shoot top of 10 matured plants) were measured as well.

2.4 PacBio Iso-Seq
For obtaining the accurate reference for genes in sugarcane, the full-length transcriptome sequencing
was performed in the present study. The RNA libraries of internode from one mature sugarcane at ten
months old were prepared. The mRNAs were first enriched by Oligo (dT) magnetic beads and the full-
length cDNAs were synthesized using Clontech SMARTer PCR cDNA Synthesis Kit (Pacific Biosciences,
USA). Three libraries with different length (1–2 kb, 2–3 kb and 3–6 kb) were constructed. The sequencing
was performed on PacBio Sequel System (Pacific Biosciences, USA). The raw sequences were analyzed
using SMRT Link v5.0.1 software. Based on the primer at 5’ and 3’ as well as ploy-A, the full-length, non-
full-length, chimeric and non-chimeric categories were identified. The non-full-length sequences were
polished by Quiver algorithm. The following Illumina RNA-seq data were used to correct the low-quality
sequences. The sequences were annotated by Nr, SwissProt, COG/KOG, GO and KEGG pathway. The un-
annotated sequences were further performed CDS prediction.

2.5 Preparation of RNA-seq libraries
Total RNAs from 3 plants in each group were isolated using RNA Trizol (Invitrogen, Carlsbad, CA, USA)
following the manufacturer’s instructions. A total of 6 RNA-seq libraries (3 from control group and 3 from
DPC group) were prepared for the next-generation sequencing. The quantity and integrity of the total
RNAs were assayed using an Agilent 2100 bioanalyzer (Agilent, Santa Clara, CA, USA). The mRNAs were
enriched by oligo (dT) magnetic beads and fragmented by fragmentation buffer. The first-strand cDNA
was synthesized using 6-base random primers. The second-strand cDNA was then synthesized by DNA
polymerase I. The cDNAs were then isolated using a Qiaquick PCR extraction kit (Qiagen, Hilden,
Germany) and ligated with Illumina sequencing adapters. The cDNAs were finally purified using agarose
gel electrophoresis and amplified by PCR to generate the RNA-seq libraries. The RNA-seq were performed
on Illumina HiSeq™ 4000 by Gene Denovo Biotechnology Co. (Guangzhou, China).

                                                 Page 5/25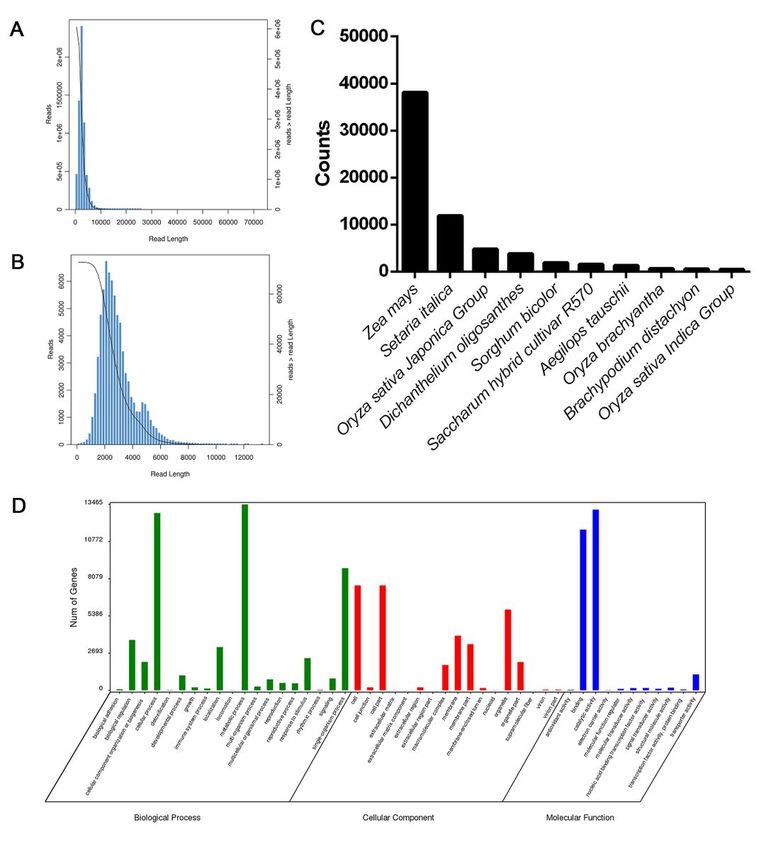
2.6 Transcriptome mapping and differentially expressed
genes (DEGs) identification
The sequencing adaptor were trimmed first. Then, the low-quality reads with unknown nucleotides (N)
ratio > 10% or Q-value ≤ 20 were removed. The retained reads were high-quality clean read which were
used for the following analyses. The clean reads were mapped to reference transcriptome sequence
using the full-length transcriptome by TOPHAT (version 2.0.9) [41]. The relative gene expression was
calculated and normalized by Fragments Per Kilobase of transcript per Million mapped reads (FPKM).
The principal component analysis (PCA) was performed with R package (http://www.r-project.org/) to
evaluate the reproducibility of biological replicates. When the genes with a false discovery rate (FDR) <
0.05 and log2(fold change) > 1 or
sample. EF1A was used as control gene. To confirm the specificity of the PCR reaction, melt curve
analysis was performed. The relative expression of gene was calculated by the 2−ΔΔCT method.

2.10 Data Statistical Analysis
The growth rate, sugarcane height, internode length and relative expression were presented as means ±
standard deviations (SD). The significant differences among the groups were determined using one-way
analysis of variance (ANOVA) and post hoc Tukey's test on SPSS statistical software package (V19.0,
SPSS, Chicago, IL, USA). P < 0.05 was confirmed as significant difference.

3. Results
3.1 Growth performance
At the beginning of the experiment (0 days), no significant difference could be found compared the
control and DPC group (p > 0.05). However, the sugarcane heights on day 3, 6, and 12 as well as in mature
sugarcane were significantly higher in control compared to DPC groups (p < 0.05) (Fig. 1A). Similar to the
sugarcane height, the growth rates of DPC groups were significantly lower on day 3, 6, and 12 compared
to the control (p < 0.05) (Fig. 1B). All of the internodes were significantly longer in control (Figure. 1C).

3.2 Full-length transcriptome of sugarcane
To generate a high accuracy reference for reads mapping data, full-length mRNA sequence was
performed using PacBio Sequel platform using internodes from mature sugarcane. A total of 17 billion
raw reads were obtained. The average length was 2,718 bp and N50 was 3,011 bp, respectively. After
circular-consensus sequence (CCS) extraction, 428,444 reads were identified. Among these reads,
348,840 accounting for 81.42% reads were full-length reads contained 5’ adaptor, poly(A) tail signals, and
3’ adaptor. Meanwhile, 999 million full-length non-chimeric (FLNC) reads with average length of 2,906 bp
were identified. These FLNC reads of cDNA library contain repetitive isoforms which provided data for
analysis of isoforms by alignment and assigning to different cluster. The present full-length
transcriptome generated 72,671 isoforms. The average length was 2888.94 bp and the N50 was 3,073 of
these isoforms (Additional file 2).

The isoforms were annotated by aligning the protein and nucleotide databases. In total, 69,803, 56,843,
47,438 and 30,240 isoforms were annotated from Nr, Swissport, KOG and KEGG, respectively. Combining
these results, a total of 69,867 isoforms were annotated (Additional file 3). The isoforms were aligned to
the different species. The five species with the most hit sequences were Zea mays, Setaria italica, Oryza
sativa Japonica Group, Dichanthelium oligosanthes and Sorghum bicolor. These isoforms were also
annotated by GO terms assigned to three categories—biological process (50,805 isoforms), cellular
component (32,922 isoforms) and molecular function (26,696 isoforms). In the biological process
categories, metabolic process (13,462 isoforms) and cellular process (12,836 isoforms) were the two
most functional terms. Cell (7,598 isoforms) and cell part (7,597 isoforms) were the two most functional
                                                    Page 7/25
terms in the cellular component category. In the molecular function category, catalytic activity (13,086
isoforms) and binding (11,642 isoforms) were the two most functional terms (Fig. 2C).
3.3 DEGs by DPC treatment
The 150 pair-end reads were obtained for the DEGs analysis. In total, 1,404,530,300 raw reads were
generated from 18 cDNA libraries using Illumina Hiseq 4000 platform. After trimming the adopter and
removing the low-quality reads, 1,380,323,402 (98.28%) reads were retained as high-quality clean reads.
These clean reads were mapped to the reference as full-length transcriptome. The mapping ratios for the
18 cDNA libraries covered from 73.97–83.78%. Using these data, the normalized expression data were
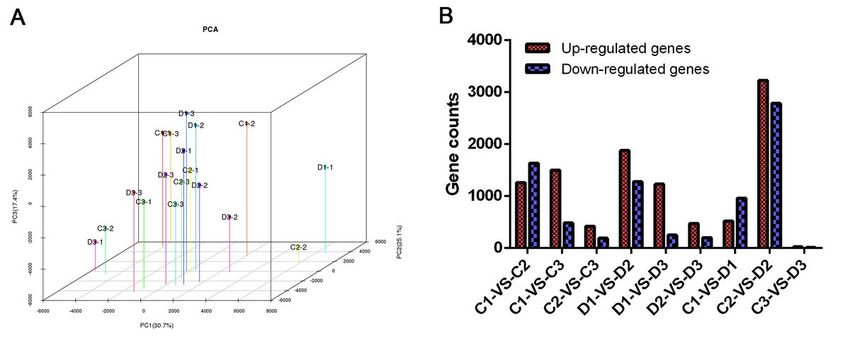
calculated and the normalized gene expression were analyzed by PCA (Fig. 3A). The result showed that
two clusters were clearly defined by PCA which contained DPC group and control for each cluster. The
first principal component PC1 summarized 30.7% of the whole variability and discriminated samples
according to the treatment. The second principal component PC2 and the third principal component PC2
summarized 25.1% and 17.4% of the whole variability and discriminated samples, respectively. The DEGs
analysis showed that the comparison between C2 and D2 groups had the most DEGs (A total of 6,012
genes, contained 3,227 up-regulated genes and 2,785 down-regulated genes). The D1 showed more up-
regulated genes compared to D2 and D3 groups while less down-regulated genes were found in D1 when
compared to D2 and D3 groups. Besides the most DEGs in C2-vs-D2, C1-vs-C2 (2,895 DEGs) and D1-vs-D2
(3,157 DEGs) also showed large amount of differentially expressed genes.
3.4 Functional analyses of DEGs between C2 and D2 groups
For illustrating the functions of the DEGs after DPC treatment, GO enrichment and KEGG enrichment
analyses of the comparison of C2 and D2 with the most DEGs were performed. The up-regulated genes
and down-regulated genes were annotated in 29 and 37 in GO terms. The GO enriched terms with four
most up-regulated genes were DNA metabolic process, negative regulation of biological process,
regulation of translation, and regulation of cellular amide metabolic process were the most while the GO
enriched terms with two most down-regulated genes were single-organism transport and single-organism
localization (Additional file 4). KEGG enrichment analysis showed that 17 and 30 pathways were enriched
in the up-regulated and down-regulated genes, respectively. Either for the up-regulated genes and down-
regulated genes, metabolic pathways and biosynthesis of secondary metabolites were the top two
enrichment KEGG pathways with the most genes. In the up-regulated genes, 55 genes were found
increased in plant hormone signal transduction pathway. Phenylpropanoid biosynthesis, flavonoid
biosynthesis, favone and flavonol biosynthesis, and glucosinolate biosynthesis were enriched in the
down-regulated genes (Additional file 5). These KEGG pathways were associated with internodes growth
and development.
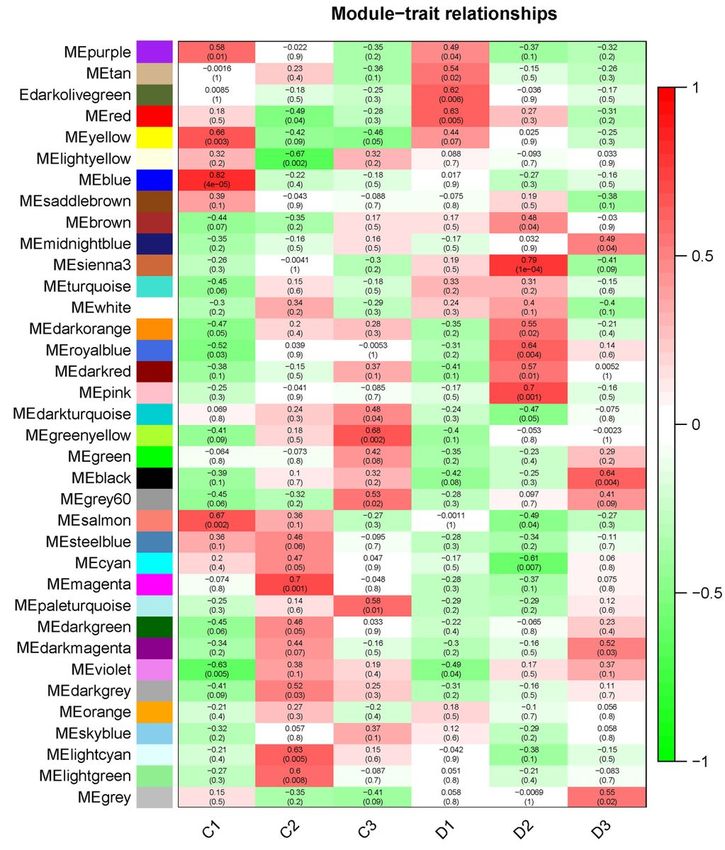
3.5 WGCNA and hub genes
The WGCNA divided the genes into 36 modules. Based on the DEGs identification, we focus on the D2
group which contained significant gene expression changes which is the crucial stage for internode
Page 8/25elongation. We found that sienna3 was the top module that significantly correlated with the D2 stage (p =
1e-4) (Additional file 6). The sienna3 module contained 33 genes. The top three hub genes including Stf0
sulphotransferase, cyclin-like F-box and HOX12 were identified in this module. These three hub genes
were correlated with 30 genes (Additional file 7).
3.6 Validation of RNA-seq result
The qPCR was used to validate the results of RNA-sEq. Randomly, 9 genes were selected for the analysis.
Except GID2 and PBS1, the other 6 tested genes including GA2OX1, GID1, MPK4, CML49, PRPF8 and
ACO2 showed similar qPCR results with RNA-sEq. Namely, expression trend of 6 in 8 genes from qPCR
and RNA-seq had high consistence indicating the majority of genes had same tendency. These results
showed the high reliability of the RNA-Seq data.
4. Discussion
Sugarcane is the main source for sugar industry accounting for 79% of sugar production over the world.
Developing techniques for controlling growth of sugarcane accelerate the yields and culture
biotechnology for sugarcane. GA and DPC are two pairs of chemicals that regulate plant growth in sugar
farming with different effects. GA stimulates sugarcane internode elongation by regulating genes
associated to zeatin biosynthesis, nitrogen metabolism and plant hormone signal transduction pathway
[43] while the DPC depressed sugarcane growth. However, compared to the clear mechanism of GA
stimulated growth, the molecular mechanisms of DPC is blur. Thus, in the present study, we focus on the
transcriptomic regulation by DPC on sugarcane and discuss the key genes mediated the growth
depressed effect.
First, to obtain high quality reference for gene annotation, we generate full-length transcriptome from
sugarcane. The full-length transcriptome from sugarcane was sequenced by PacBio Sequel platform
generated 72,671 isoforms. Compared to illumine platforms, PacBio Sequel platform could gain longer
transcripts which is facility to construction of high-quality reference for short sequence analysis. The
present study generated the reads with N50 as 3,011 bp. These long reads guarantee longer contigs and
isoforms for the following transcriptome analysis [44]. It turns out that the N50 was 3,073 for the
isoforms in the present study. Sugarcane is a widely cropped plant. Up to date, large amount of different
varieties has been developed. The Guitang varieties developed from Guangxi which have become a series
of varieties planted in southern China [45]. GT42 belonging to the Guitang varieties is a new breeding line
with higher productivities for sugar [45]. Although the genome of sugarcane is reported until 2018, the
genome data may differ from varieties [46]. Our present first reported the full-length transcriptome GT42.
These data would accelerate the studies on the new high yield crop and provide high-quality reference
when analyzed the illumine short reads. Meanwhile, these global transcriptome data gave a chance to
illustrate the function of internodes in GT42. The most abundant biological process GO term of GT42
isoforms contained metabolic process and cellular process. Thus, this functional isoform showed similar
function assignment with previous results from sugarcane [46–48]. Based on these data, the GT42 had
similar functional constitution of genes with other sugarcane varieties. The present full-length
Page 9/25transcriptome first generated the general information of GT42 and provided high-quality reference
transcriptome for further investigation on this variety.
DPC is one of the most successful and widely used chemicals to regulated plant growth. Internode length
and leaf size could be depressed by DPC treatment in cotton and sugarcane [12]. The present study also
suggested that DPC inhibited internode length in GT42 which was similar to previous results. After
understanding the effects of DPC on the internode growth, the next question is to find out the molecular
mechanism of the function of DPC in sugarcane. We used RNA-seq to show the whole profile of
regulation on gene expressions in the present study. Using hi-seq technique, we obtained millions of short
reads to reveal the expression in different stages by DPC treatment. Thanks to the high-quality full-length
transcriptome data, the mapping ratios for these libraries covered 73.97–83.78%. The comparison
between C2 and D2 had the most DEGs which was 6,012 genes. This numbers of DEGs was much higher
than that in C1-vs-D1 and C3-vs-D3 suggesting the gene expression changes between control and DPC
treatment were mainly in the second stages, namely, on 6 days post spraying. In a study in cotton
spraying by DPC, the 96 h post spraying significantly had the most DEGs compared to the 48 and 72 h
stages. It seems that the DPC resulted changes gene expression could be in a long-term until 4 to 6 days.
The gene expression regulation by DPC is not an acute effect. Meanwhile, after 10 days, the effects of
DPC on gene expression were diminished. We supposed the best effect period of DPC regulated gene
expression is 6 days.
The KEGG enrichment analysis showed that 55 genes in plant hormone signal transduction pathway
were increased by DPC treatment. Internodes growth is controlled by several hormones such as G
biosynthesis genes, auxin related genes, and ethylene genes. It had been reported that GA treatment
significantly up-regulated these genes. Meanwhile, DPC may suppressed hormone expression. In
Agapanthus praecox, auxin-related genes could be inhibited by DPC treatment [49]. Surprisingly, the
present study also indicated that DPC increased several hormonal genes. This different may due to the
different species. The sugarcane may have different response to DPC in molecular levels. We also found
that several key pathways could be down-regulated by DPC, such as phenylpropanoid biosynthesis,
flavonoid biosynthesis, favone and flavonol biosynthesis, and glucosinolate biosynthesis were enriched.
The phenylpropanoid pathway provides metabolites for plant growth which contributes to the
requirement of lignin biosynthesis [50]. Favone, flavonol and glucosinolate are key metabolites for
internode growth [51, 52]. Flavonol biosynthesis could be affected by light intensity and led to different
growth appearances in Ginkgo (Ginkgo biloba) [53]. The glucosinolate concentration influenced by sulfur
and nitrogen supplement was associated with growth of broccoli [54]. The down-regulated of genes in
these pathways may lead to the shorten effects of sugarcane internodes.
To find out the key gene modules and hub genes by DPC treatment, WGCNA was performed. The most
correlated gene module with D2 group was sienna3 containing only 33 genes. Therefore, the most critical
genes play key role in the module. Hub genes are the gene that correlate with other genes in expression
levels which could be identified by mathematical method. The top three identified in this study were Stf0
sulphotransferase, cyclin-like F-box and HOX12. Stf0 belongs to sulphotransferase family which affects
Page 10/25root development processes, elongation growth, and gravitropism [55]. In several plants, including
Medicago truncatula, Lotus japonicus, and Arabidopsis thaliana, cyclin-like F-box genes were expressed
in all the tissues contained high actively dividing cells. Meanwhile, knockdown of this gene resulted in
accumulation of CYCB1:1 suggesting that cyclin-like F-box gene could regulate cell cycle in the dividing
cells [56]. It had been reported that HOX12 regulated panicle exsertion via modulating EUI1 gene
expression [57]. These three hub genes were correlated with the other genes in the sienna3 modules.
Based on this information, it could be concluded that Stf0 sulphotransferase, cyclin-like F-box and HOX12
mediated a gene group and constituted as a gene network which contributed to the DPC effects on
sugarcane growth.
In conclusion, the full-length transcriptome of GT42 was first reported providing an informative resource
for sugarcane breeding and transcriptome analysis. The RNA-seq suggested that the main effects of DPC
on sugarcane gene expression was 6 days post spraying. The significant enriched gene function
categories contained several pathways related to internode growth including multiple pathways that
participated in production of Metabolic products. The gene modules included 33 genes were high
correlated with the stage of 6 days post spraying in DPC group showing a potential role in response to
DPC. Among these genes, Stf0 sulphotransferase, cyclin-like F-box and HOX12 were hub genes that may
regulate all the other genes in this module. Further studies should focus on determination the function in
detail of these key genes, especially in controlling internode growth affected by DPC.
Abbreviations
DPC
Mepiquat chloride; WGCNA:weighted gene co-expression network analysis; GA:gibberellin;
CTK:Cytokinins; ABA:abscisic acid; ETH:ethyne; BR:brassinosteroid; GA20-OX1:GA20-oxidase;
GID1:gibberellin receptor; SRI:Sugarcane Research Institute; GO:Gene Ontology; KEGG:Kyoto Encyclopedia
of Genes and Genomes; FPKM:Fragments Per Kilobase of transcript per Million mapped reads;
CCS:circular-consensus sequence; FLNC:full-length non-chimeric; PCA:principal component analysis;
SD:standard deviations; ANOVA:one-way analysis of variance; DEGs:differentially expressed genes.
Declarations
Acknowledgments
Not applicable.
Authors’ contributions
RC, LQ and JW conceived and designed the experiments. YF, HZ and SM collected the samples and
cultured the sugarcane. ZZ, HY and TL analyzed the data. XH, MW, PL and YL performed the experiments.
RC, YF, LQ and JW wrote the manuscript. All authors reviewed and approved the final manuscript.
Page 11/25Funding
The work was supported by the National Natural Science Foundation of China (31701363, 31360312),
Guangxi Natural Science Foundation (2018GXNSFAA138149 and 2017GXNSFBA198050), Special R & D
and joint research projects of Chinese Academy of Sciences (KFJ-STS-QYZD-199-2), Science and
Technology Program of Guangxi (Guike AD19245080), and National Key Research and Development
Program of China (2019YFD1000503).
Availability of data and materials
Data for the sugarcane used in the RNA-Seq analysis are accessible at NCBI under BioProject accession
number PRJNA633918.
Ethics approval and consent to participate
Not applicable.
Consent for publication
Not applicable.
Competing interests
The authors declare that they have no competing interests.
References
1. Gray WM. Hormonal regulation of plant growth and development. PLoS Biol. 2004;2(9):e311.
https://doi.org/10.1371/journal.pbio.0020311.
2. Vanstraelen M, Benková E. Hormonal interactions in the regulation of plant development. Annu Rev
Cell Dev Biol. 2012;28:463–87. https://doi.org/10.1146/annurev-cellbio-101011-155741.
3. Evans ML, Cleland RE. The action of auxin on plant cell elongation. Crit Rev Plant Sci.
1985;2(4):317–65. https://doi.org/10.1080/07352688509382200.
4. Huttly AK, Phillips AL. Gibberellin-regulated plant genes. Physiol Plant. 1995;95(2):310–7.
https://doi.org/10.1111/j.1399-3054.1995.tb00843.x.
5. Liu F, Xing S, Ma H, Du Z, Ma B. Cytokinin-producing, plant growth-promoting rhizobacteria that
confer resistance to drought stress in Platycladus orientalis container seedlings. Appl Microbiol
Biotechnol. 2013;97(20):9155–64. https://doi.org/10.1007/s00253-013-5193-2.
6. Rai MK, Shekhawat N, Gupta AK, Phulwaria M, Ram K, Jaiswal U. The role of abscisic acid in plant
tissue culture: a review of recent progress. Plant Cell Tissue Organ Cult. 2011;106(2):179–90.
https://doi.org/10.1007/s11240-011-9923-9.
Page 12/257. Yu Z, Song M, Pei H, Jiang L, Hou Q, Nie C, Zhang L. The effects of combined agricultural
phytohormones on the growth, carbon partitioning and cell morphology of two screened algae.
Biores Technol. 2017;239:87–96. https://doi.org/10.1016/j.biortech.2017.04.120.
8. Sun Y, Fan X-Y, Cao D-M, Tang W, He K, Zhu J-Y, He J-X, Bai M-Y, Zhu S, Oh E, et al. Integration of
brassinosteroid signal transduction with the transcription network for plant growth regulation in
Arabidopsis. Dev Cell. 2010;19(5):765–77. https://doi.org/10.1016/j.devcel.2010.10.010.
9. Giese G, Velasco-Cruz C, Roberts L, Heitman J, Wolf TK. Complete vineyard floor cover crops
favorably limit grapevine vegetative growth. Sci Hortic. 2014;170:256–66.
https://doi.org/10.1016/j.scienta.2014.03.011.
10. Yeshitela T, Robbertse P, Stassen P. Paclobutrazol suppressed vegetative growth and improved yield
as well as fruit quality of ‘Tommy Atkins’ mango (Mangifera indica) in Ethiopia. New Zealand
Journal of Crop Horticultural Science. 2004;32(3):281–93.
https://doi.org/10.1080/01140671.2004.9514307.
11. Wang N, Wang X, Shi J, Liu X, Xu Q, Zhou H, Song M, Yan G. Mepiquat chloride-priming induced salt
tolerance during seed germination of cotton (Gossypium hirsutum L.) through regulating water
transport and K+/Na+ homeostasis. Environ Exp Bot. 2019;159:168–78.
https://doi.org/10.1016/j.envexpbot.2018.12.024.
12. Gwathmey CO, Clement JD. Alteration of cotton source–sink relations with plant population density
and mepiquat chloride. Field Crops Research. 2010;116(1):101–7.
https://doi.org/10.1016/j.fcr.2009.11.019.
13. Wang L, Mu C, Du M, Chen Y, Tian X, Zhang M, Li Z. The effect of mepiquat chloride on elongation of
cotton (Gossypium hirsutum L.) internode is associated with low concentration of gibberellic acid.
Plant Sci. 2014;225:15–23. https://doi.org/10.1016/j.plantsci.2014.05.005.
14. Yeates S, Constable G, McCumstie T. Developing management options for mepiquat chloride in
tropical winter season cotton. Field Crops Research. 2002;74(2–3):217–30.
https://doi.org/10.1016/S0378-4290(02)00005-9.
15. Davis TD, Curry EA, Steffens GL. Chemical regulation of vegetative growth. Crit Rev Plant Sci.
1991;10(2):151–88. https://doi.org/10.1080/07352689109382310.
16. Rademacher W. Chemical regulators of gibberellin status and their application in plant production.
Annual Plant Reviews online 2018:359–403. https://doi.org/10.1002/9781119312994.apr0541.
17. Reddy AR, Reddy KR, Hodges H. Mepiquat chloride (PIX)-induced changes in photosynthesis and
growth of cotton. Plant Growth Regul. 1996;20(3):179–83. https://doi.org/10.1007/BF00043305.
18. Tung SA, Huang Y, Ali S, Hafeez A, Shah AN, Song X, Ma X, Luo D, Yang G. Mepiquat chloride
application does not favor leaf photosynthesis and carbohydrate metabolism as well as lint yield in
late-planted cotton at high plant density. Field Crops Research. 2018;221:108–18.
https://doi.org/10.1016/j.fcr.2018.02.027.
19. Xu X, Taylor HM. Increase in drought resistance of cotton seedlings treated with mepiquat chloride.
Agron J. 1992;84(4):569–74. https://doi.org/10.2134/agronj1992.00021962008400040005x.
Page 13/2520. Matsoukis A, Gasparatos D, Chronopoulou-Sereli A. Mepiquat chloride and shading effects on
specific leaf area and K, P, Ca, Fe and Mn content of Lantana camara L. Emirates Journal of Food
and Agriculture 2015:121–125. https://doi.org/10.9755/ejfa.v27i1.17450.
21. Zhang S, Cothren J, Lorenz E. Mepiquat chloride seed treatment and germination temperature effects
on cotton growth, nutrient partitioning, and water use efficiency. J Plant Growth Regul. 1990;9(1–
4):195. https://doi.org/10.1007/BF02041962.
22. Roussos PA, Archimandriti A, Beldekou I. Improving in vitro multiplication of juvenile European
chestnut (Castanea sativa Mill) explants by the use of growth retardants. Sci Hortic. 2016;198:254–
6. https://doi.org/10.1016/j.scienta.2015.11.039.
23. Goldemberg J, Coelho ST, Guardabassi P. The sustainability of ethanol production from sugarcane.
Energy Policy. 2008;36(6):2086–97. https://doi.org/10.1016/j.enpol.2008.02.028.
24. Ukoskit K, Posudsavang G, Pongsiripat N, Chatwachirawong P, Klomsa-ard P, Poomipant P,
Tragoonrung S. Detection and validation of EST-SSR markers associated with sugar-related traits in
sugarcane using linkage and association mapping. Genomics. 2019;111(1):1–9.
https://doi.org/10.1016/j.ygeno.2018.03.019.
25. Fickett N, Gutierrez A, Verma M, Pontif M, Hale A, Kimbeng C, Baisakh N. Genome-wide association
mapping identifies markers associated with cane yield components and sucrose traits in the
Louisiana sugarcane core collection. Genomics. 2019;111(6):1794–801.
https://doi.org/10.1016/j.ygeno.2018.12.002.
26. Sindhu R, Gnansounou E, Binod P, Pandey A. Bioconversion of sugarcane crop residue for value
added products–An overview. Renewable Energy. 2016;98:203–15.
https://doi.org/10.1016/j.renene.2016.02.057.
27. Han Y, Watson M. Production of microbial levan from sucrose, sugarcane juice and beet molasses. J
Ind Microbiol. 1992;9(3–4):257–60. https://doi.org/10.1007/BF01569633.
28. Waclawovsky AJ, Sato PM, Lembke CG, Moore PH, Souza GM. Sugarcane for bioenergy production:
an assessment of yield and regulation of sucrose content. Plant Biotechnol J. 2010;8(3):263–76.
https://doi.org/10.1111/j.1467-7652.2009.00491.x.
29. Chong BF, Mills E, Bonnett GD, Gnanasambandam A. Early exposure to ethylene modifies shoot
development and increases sucrose accumulation rate in sugarcane. J Plant Growth Regul.
2010;29(2):149–63. https://doi.org/10.1007/s00344-009-9118-3.
30. Kuhnle J, Moore P, Haddon W, Fitch M. Identification of gibberellins from sugarcane plants. J Plant
Growth Regul. 1983;2(1–4):59. https://doi.org/10.1007/BF02042234.
31. Rae AL, Grof CP, Casu RE, Bonnett GD. Sucrose accumulation in the sugarcane stem: pathways and
control points for transport and compartmentation. Field Crops Research. 2005;92(2–3):159–68.
https://doi.org/10.1016/j.fcr.2005.01.027.
32. Glassop D, Roessner U, Bacic A, Bonnett GD. Changes in the sugarcane metabolome with stem
development. Are they related to sucrose accumulation? Plant Cell Physiol. 2007;48(4):573–84.
https://doi.org/10.1093/pcp/pcm027.
Page 14/2533. Jung J. Plant bioregulators: overview, use, and development. In: ACS Publications. 1985.
https://doi.org/10.1021/bk-1985-0276.ch007.
34. Zummo G, Benedict J, Segers J. Effect of the plant growth regulator mepiquat chloride on host plant
resistance in cotton to bollworm (Lepidoptera: Noctuidae). Journal of economic entomology.
1984;77(4):922–4. https://doi.org/10.1093/jee/77.4.922.
35. Nuti RC, Viator RP, Casteel SN, Edmisten KL, Wells R. Effect of planting date, mepiquat chloride, and
glyphosate application to glyphosate-resistant cotton. Agron J. 2006;98(6):1627–33.
https://doi.org/10.2134/agronj2005.0360.
36. Bottino MC, Rosario S, Grativol C, Thiebaut F, Rojas CA, Farrineli L, Hemerly AS, Ferreira PCG. High-
throughput sequencing of small RNA transcriptome reveals salt stress regulated microRNAs in
sugarcane. PloS one. 2013;8(3):e59423. https://doi.org/10.1371/journal.pone.0059423.
37. Ferreira TH, Gentile A, Vilela RD, Costa GGL, Dias LI, Endres L, Menossi M. microRNAs associated
with drought response in the bioenergy crop sugarcane (Saccharum spp.). 2012. 7(10): e46703.
Published online 2012 Oct 11. doi: 10.1371/journal.pone.0046703.
38. Zhou Y, Liu Y, Luo Y, Zhong H, Huang T, Liang W, Xiao J, Wu W, Li L, Chen M. Large-scale profiling of
the proteome and dual transcriptome in Nile tilapia (Oreochromis niloticus) challenged with low- and
high-virulence strains of Streptococcus agalactiae. Fish Shellfish Immunol. 2020;100:386–96.
https://doi.org/10.1016/j.fsi.2020.03.008.
39. Wang M, Wang L, Pu L, Li K, Feng T, Zheng P, Li S, Sun M, Yao Y, Jin L. LncRNAs related key
pathways and genes in ischemic stroke by weighted gene co-expression network analysis (WGCNA).
Genomics. 2020;112(3):2302–8. https://doi.org/10.1016/j.ygeno.2020.01.001.
40. Do DN, Dudemaine P-L, Fomenky BE, Ibeagha-Awemu EM. Integration of miRNA weighted gene co-
expression network and miRNA-mRNA co-expression analyses reveals potential regulatory functions
of miRNAs in calf rumen development. Genomics. 2019;111(4):849–59.
https://doi.org/10.1016/j.ygeno.2018.05.009.
41. Trapnell C, Pachter L, Salzberg SL. TopHat: discovering splice junctions with RNA-SEq.
Bioinformatics. 2009;25(9):1105–11. https://doi.org/10.1093/bioinformatics/btp120.
42. Langfelder P, Horvath S. WGCNA: an R package for weighted correlation network analysis. BMC
Bioinform. 2008;9(1):559. https://doi.org/10.1186/1471-2105-9-559.
43. Qiu L, Chen R, Fan Y, Huang X, Luo H, Xiong F, Liu J, Zhang R, Lei J, Zhou H, et al. Integrated mRNA
and small RNA sequencing reveals microRNA regulatory network associated with internode
elongation in sugarcane (Saccharum officinarum L.). BMC Genomics. 2019;20(1):817.
https://doi.org/10.1186/s12864-019-6201-4.
44. 10.1007/978-94-017-7450-5_6
Gonzalez-Garay ML: Introduction to isoform sequencing using pacific biosciences technology (Iso-
Seq). In: Transcriptomics and gene regulation. Springer; 2016: 141–160.
https://doi.org/10.1007/978-94-017-7450-5_6.
Page 15/2545. Wang L, Liao J, Tan F, Tang S, Huang J, Li X, Yang R, Li Y, Huang H, Jing Y. Breeding of new high-
yield, high-sugar and lodging-resistant sugarcane variety Guitang 42 and its high-yield cultivation
technique. Journal of Southern Agriculture. 2015;46(8):1361–6.
46. Zhang J, Zhang X, Tang H, Zhang Q, Hua X, Ma X, Zhu F, Jones T, Zhu X, Bowers J. Allele-defined
genome of the autopolyploid sugarcane Saccharum spontaneum L. Nat Genet. 2018;50(11):1565–
73. https://doi.org/10.1038/s41588-018-0237-2.
47. Yang X, Luo Z, Todd J, Sood S, Wang J. Genome-wide association study of multiple yield traits in a
diversity panel of polyploid sugarcane (Saccharum spp.). The Plant Genome 2020:e20006.
https://doi.org/10.1002/tpg2.20006.
48. Garsmeur O, Droc G, Antonise R, Grimwood J, Potier B, Aitken K, Jenkins J, Martin G, Charron C,
Hervouet C. A mosaic monoploid reference sequence for the highly complex genome of sugarcane.
Nat Commun. 2018;9(1):1–10. https://doi.org/10.1038/s41467-018-05051-5.
49. Zhang D, Ren L, Yue J, Shi Y, Zhuo L, Wang L, Shen X. RNA-Seq-based transcriptome analysis of
stem development and dwarfing regulation in Agapanthus praecox ssp. orientalis (Leighton.
Leighton Gene. 2015;565(2):252–67. https://doi.org/10.1016/j.gene.2015.04.013.
50. Douglas CJ. Phenylpropanoid metabolism and lignin biosynthesis: from weeds to trees. Trends Plant
Sci. 1996;1(6):171–8. https://doi.org/10.1016/1360-1385(96)10019-4.
51. Herrmann K. Flavonols and flavones in food plants: a review. Int J Food Sci Technol.
1976;11(5):433–48. https://doi.org/10.1111/j.1365-2621.1976.tb00743.x.
52. Ringli C, Bigler L, Kuhn BM, Leiber R-M, Diet A, Santelia D, Frey B, Pollmann S, Klein M. The modified
flavonol glycosylation profile in the Arabidopsis rol1 mutants results in alterations in plant growth
and cell shape formation. Plant Cell. 2008;20(6):1470–81. https://doi.org/10.1105/tpc.107.053249.
53. Xu Y, Wang G, Cao F, Zhu C, Wang G, El-Kassaby YA. Light intensity affects the growth and flavonol
biosynthesis of Ginkgo (Ginkgo biloba L.). New Forest. 2014;45(6):765–76.
https://doi.org/10.1007/s11056-014-9435-7.
54. Pék Z, Daood H, Nagyné MG, Berki M, Tóthné MM, Neményi A, Helyes L. Yield and phytochemical
compounds of broccoli as affected by temperature, irrigation, and foliar sulfur supplementation.
HortScience. 2012;47(11):1646–52. https://doi.org/10.21273/HORTSCI.47.11.1646.
55. Hirschmann F, Krause F, Papenbrock J. The multi-protein family of sulfotransferases in plants:
composition, occurrence, substrate specificity, and functions. Front Plant Sci 2014, 5(556).
https://doi.org/10.3389/fpls.2014.00556.
56. 10.2147/RRB.S84753
Boycheva I, Vassileva V, Revalska M, Zehirov G, Iantcheva A. Cyclin-like F-box protein plays a role in
growth and development of the three model species Medicago truncatula, Lotus japonicus, and
Arabidopsis thaliana. Research and Reports in Biology 2015, 6:117.
https://doi.org/10.2147/RRB.S84753.
57. Gao S, Fang J, Xu F, Wang W, Chu C. Rice HOX12 regulates panicle exsertion by directly modulating
the expression of ELONGATED UPPERMOST INTERNODE1. Plant Cell. 2016;28(3):680–95.
Page 16/25https://doi.org/10.1105/tpc.15.01021.
Figures
Figure 1
Effects of DPC on sugarcane growth performance on different days after treatment. (A) The height of
sugarcane on different days after DPC treatment (n = 4). (B) The growth rate of sugarcane on different
days after DPC treatment (n = 4; mature period, n = 10). (C) The internode length of sugarcane in mature
sugarcane after DPC treatment. * indicated p < 0.05.
Page 17/25Figure 2
Full-length transcriptome of internode of sugarcane. (A) Length distribution of reads generated from
PacBio Sequel System sequencing. (B) Length distribution of isoforms generated from PacBio Sequel
System sequencing. (C) Distribution of annotated genes from NR database in different species. (D) GO
annotation of the isoforms.
Page 18/25Figure 3
Expression profile analysis based on RNA-seq result. (A) Principle component analyses of the eighteen
transcriptones from the internodes of sugarcane on different days in the control and DPC treatment
groups based on the FPKM. (B) Number of up-regulated and down-regulated genes of pairwise
comparisons.
Page 19/25Figure 4
GO enrichment analysis result of up-regulated genes (A) and down-regulated genes (B) from C2-vs-D2
comparison.
Figure 5
KEGG enrichment analysis result of up-regulated genes (A) and down-regulated genes (B) from C2-vs-D2
comparison.
Page 20/25Figure 6
WGCNA analysis of internode transcriptomes. (A) The influence of soft-thresholding power on scale-free
fit index. (B) The influence of soft-thresholding power on the mean connectivity. (C) Cluster dendrogram
of the clustering of dissimilarity using a consensus topological overlap. Modules were assigned to
different colors.
Page 21/25Figure 7
The heatmap of module-trait relationship between different groups and gene modules. The sienna3 is the
top positive module that correlated with D2 group. Values in each box represented the correlation
coefficient between modules and traits. Values in brackets from each box represented the P-values for the
correlation test.
Page 22/25Figure 8
Identification of hub gene in sienna3 by Cytoscape. Blue cycles represented the hub genes while green
cycles showed other genes. Grey lines showed the correlations between the genes.
Page 23/25Figure 9
Validation of RNA-seq results by qPCR. The line charts showed the log2(FPKM) values of the genes and
bar charts showed the relative expression from qPCR results.
Supplementary Files
Page 24/25This is a list of supplementary files associated with this preprint. Click to download.
Additionalfile7sienna3threehubgenes.csv
Additionalfile6enrichmentmoduleTraitPvalue.csv
Additionalfile5DEGsgoenrichment.xlsx
Additionalfile4DEGsgoenrichment.xlsx
Additionalfile3ISOannotation.xlsx
Additionalfile2Summary.xlsx
Additionalfile1Theprimersusedinthisstudy.xlsx
Page 25/25You can also read