GLOBAL STAGFLATION SPECIAL FOCUS 1 - Public Documents | The World Bank
←
→
Page content transcription
If your browser does not render page correctly, please read the page content below
SPECIAL FOCUS 1

GLOBAL STAGFLATION
G LO BAL EC O NO MIC P ROS P EC TS | J U NE 2022                                                                                 S P EC IAL FO CU S 1   53

Global inflation has risen sharply from its lows in mid-2020, on rebounding global demand, supply bottlenecks,
and soaring food and energy prices, especially since the Russian Federation’s invasion of Ukraine. Markets expect
inflation to peak in mid-2022 and then decline, but to remain elevated even after these shocks subside and
monetary policies are tightened further. Global growth has been moving in the opposite direction: it has declined
sharply since the beginning of the year and, for the remainder of this decade, is expected to remain below the
average of the 2010s. In light of these developments, the risk of stagflation—a combination of high inflation
and sluggish growth—has risen. The recovery from the stagflation of the 1970s required steep increases in
interest rates by major advanced-economy central banks to quell inflation, which triggered a global recession
and a string of financial crises in emerging market and developing economies (EMDEs). If current
stagflationary pressures intensify, EMDEs would likely face severe challenges again because of their less well-
anchored inflation expectations, elevated financial vulnerabilities, and weakening growth fundamentals. This
makes it urgent for EMDEs to shore up their fiscal and external buffers, strengthen their monetary policy
frameworks, and implement reforms to reinvigorate growth.

Introduction                                                              recession and a series of financial crises in
                                                                          EMDEs.
The global economy is in the midst of a sharp
                                                                          There has been considerable debate about current
growth slowdown following the extraordinarily
                                                                          stagflation risks. Some researchers have warned
strong rebound last year. This slowdown coincides
                                                                          that the recent surge in inflation around the world
with a steep runup in global inflation to multi-
                                                                          could mark a permanent ratcheting up of price
decade highs. Looking ahead, growth over the
                                                                          pressures after two decades of low and stable
next decade is expected to be considerably weaker
                                                                          inflation.2 Some have also noted parallels between
than over the past two decades. Although global
                                                                          the current episode and the stagflation of the
inflation is for now projected to return close to its
                                                                          1970s, including similarly negative real interest
2019 average by 2024, there is a growing risk that
                                                                          rates in both periods and the possibility of a wage-
it may remain elevated as global supply
                                                                          price spiral set off by rapid wage growth
disruptions persist and some structural drivers that
                                                                          (Blanchard 2022; Summers 2022).3 However,
depressed inflation over the past three decades
                                                                          others have pointed to material differences from
dissipate.
                                                                          the 1970s, especially in the conduct of monetary
These developments raise concerns about                                   policy, which may help prevent another bout of
stagflation—a period of both weak growth and                              stagflation: the inflation-fighting credentials
elevated inflation similar to what happened during                        accumulated since the 1980s and recent evidence
the 1970s. The experience of the 1970s is a                               of broadly stable long-term inflation expectations
reminder of the damage this could cause to the                            (DeLong 2022, Reifschneider and Wilcox 2022).4
global economy and, especially, to emerging                               Thus far, markets expect that inflation in the near
market and developing economies (EMDEs).1 The                             future will decline, albeit remaining elevated, as
stagflation of the 1970s ended with a global

                                                                               2 For these arguments, see Borio et al (2022); Eo, Uzeda, and

                                                                          Wong (2022); Forbes, Gagnon, and Collins (2021); and Ha, Kose,
    Note: This Special Focus was prepared by Jongrim Ha, M. Ayhan         and Ohnsorge (2022).
Kose, and Franziska Ohnsorge.                                                  3 Gagnon (2022) cautions that the relationship between
    1 While there is no precise definition of stagflation, the term has
                                                                          unemployment and inflation (the Phillips curve) is highly nonlinear
been used to refer to a combination of high inflation and low growth      and, as a result, current expectations of declining inflation with
(or high unemployment). Some researchers have focused on output           limited increases in unemployment may prove too optimistic. Rogoff
growth and considered stagflation as a “combination of low or             (2021) discusses the role of politically motivated spending in driving
negative output growth, and inflation that is high by historical          inflation by drawing parallels between mounting fiscal pressures in
standards” (Barsky and Killian 2002). Others have focused on              the 1970s and the current growth in public pension obligations.
unemployment, and defined stagflation as “combinations of either               4 Wilcox (2022) cautions against interpreting the 1970s as a

increasing or persistently high levels of unemployment and inflation,”    lesson that only forceful policy tightening can lower inflation;
even defining an “economic misery index” as the sum of the                instead, he argues, the lesson is that an excessive policy tightening in
unemployment rate and inflation (Bruno and Sachs 1979, Welsch             response to supply shocks, to compensate for previous excessive
2007).                                                                    loosening, will cause a recession.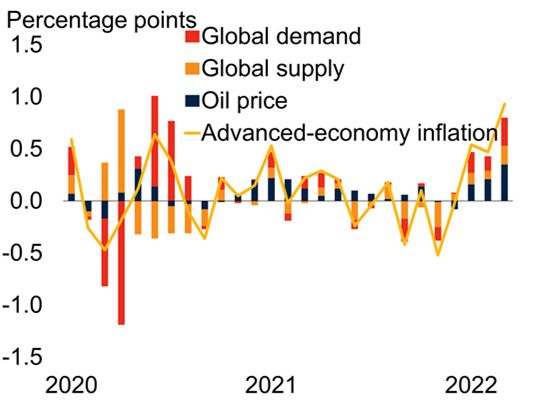
54   S P EC IAL FO CU S 1                                                      G LO BAL EC O NO MIC P ROS P EC TS | J U NE 2022

            global growth cools, monetary policy gets tighter,       broad set of countries.5 The threat of stagflation is
            fiscal support is withdrawn, energy and food prices      global since the current combination of high
            level off, and supply bottlenecks ease. Moreover,        inflation and weak growth is highly synchronized
            most commentators argue that monetary policy             across many countries. Third, this Focus explicitly
            has the tools to return inflation to target rates over   links the EMDE debt buildup of the 1970s that
            time. However, if inflation expectations de-             culminated in the debt crises of the 1980s to the
            anchor, as they did in the 1970s, as a result of         stagflation of that era and its eventual resolution in
            persistently elevated inflation and repeated             advanced economies. The 1970s witnessed the
            inflationary shocks, the interest rate increases         first global debt wave fueled by a prolonged period
            required to bring inflation back to target will be       of accommodative monetary policies in major
            greater than those currently anticipated by              advanced economies. Since 2010, the global
            financial markets. This raises the specter of the        economy has been experiencing the largest, fastest,
            steep increases in interest rates that brought           and most synchronized debt wave of the past five
            inflation under control but also triggered a global      decades amid a protracted period of monetary
            recession in 1982 (Goodfriend 2007). That global         policy accommodation. The study considers the
            recession also coincided with a string of financial      lessons of the debt accumulation of the 1970s for
            crises and marked the beginning of a protracted          the current debt wave.
            period of weak growth in many EMDEs.

            Against this background of highly uncertain global
                                                                     Evolution of inflation
            economic prospects and complex policy                    Inflation in the 1960s and 1970s. Global
            challenges, this Special Focus addresses three           consumer price inflation rose steadily in the
            questions:                                               1970s, starting from a range of 1.7-4.4 percent a
                                                                     year through the 1960s and early 1970s (figure
            •    How have inflation and growth evolved over
                                                                     SF1.1.A). In 1973, inflation surged to 10.3
                 time?
                                                                     percent, when the first oil price shock struck.
                                                                     Inflation then rose steeply through the remainder
            •    How does the current period compare with
                                                                     of the 1970s and stayed elevated until the global
                 the stagflation of the 1970s?
                                                                     recession of 1982. As a result, global inflation
            •    What challenges do stagflationary risks now         during 1973-83 averaged 11.3 percent a year,
                 pose for EMDEs?                                     more than three times as high as the average of 3.6
                                                                     percent a year during 1962-72. The inflation
            The Focus makes several contributions to the             pickup over the course of the 1970s was
            literature. First, it provides the first systematic      accompanied by a double-digit depreciation of the
            comparison of the current juncture with the              U.S. dollar (in nominal effective terms).
            stagflationary period of the 1970s. The previous
            literature has mostly focused on a comparison of         During this period, however, there were marked
            high inflation during that period with today’s           differences across countries. While inflation
            inflationary challenges and studied the role of          subsided sharply in Germany, Japan, and
            monetary policy and commodity price shocks in            Switzerland around the global recession of 1975, it
            driving inflation in the two periods. This study         dipped only briefly in the United States, France,
            considers the stagflation of the 1970s and
            examines the role of fiscal policy and broader
            structural differences in explaining weak output             5 Bruno and Sachs (1985) emphasize the importance of

                                                                     commodity price shocks (sharp increases in the prices of oil and food)
            growth and high inflation. Second, in contrast to        as the main driver of inflation in the 1970s. Blinder (1979) and
            much of the earlier work, which has focused on           Blinder and Kilian (2009) attribute the U.S. stagflation in the 1970s
            the United States, this study presents a global          mostly to supply shocks. Barsky and Kilian (2002 and 2004) find a
                                                                     prominent role for the monetary policy response to supply shocks.
            perspective by examining the evidence of                 DeLong (1997) also notes these factors but also political pressure on
            stagflation, and the challenges posed by it, for a       the U.S. Federal Reserve.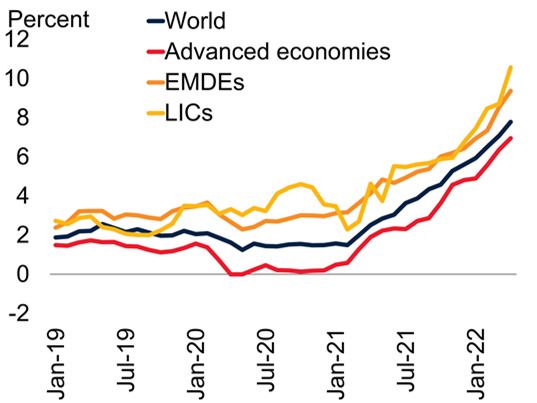
G LO BAL EC O NO MIC P ROS P EC TS | J U NE 2022 S P EC IAL FO CU S 1 55
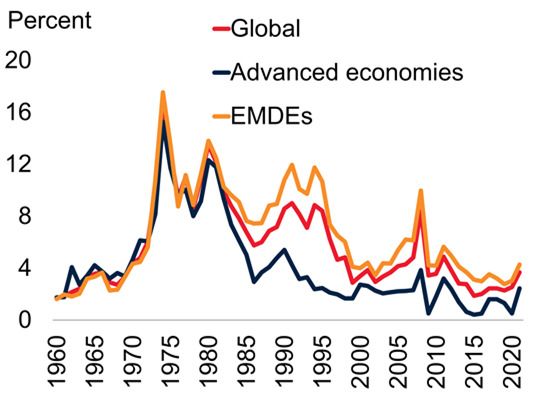
and Spain, and remained high in the Nordics and FIGURE SF1.1 Inflation
Canada. Synchronous policy tightening around
From its peak in the mid-1970s, global inflation has declined sharply.
the world, including in the United States, However, inflation has surged in 2021-22 as a result of the rebound in
contributed to the global recession of 1982, with global demand from the pandemic and soaring commodity prices,
especially since Russia’s invasion of Ukraine. While inflation rose most in
global inflation waning to 5.4 percent per year, on EMDEs in Europe and Central Asia, rising food and energy prices have
average, in the remainder of the 1980s. also sharply increased inflation in Sub-Saharan Africa. Short-term inflation
expectations have risen, especially since the start of the war, but medium-
term expectations have remained broadly stable.
Inflation between the 1970s and the pandemic.
Prior to the pandemic, many studies focused on B. Monthly CPI inflation
A. Headline CPI inflation
the remarkable decline in inflation over the past
five decades. Global inflation fell from a peak of
16.9 percent in 1974 to 2.3 percent in 2019
(figure SF1.1.A). This trend decline was broad-
based, covering both advanced economies and
EMDEs. Between 1974 and 2019, inflation in
advanced economies declined from 15.3 percent
in 1974 to 1.3 percent in 2019, while in EMDEs,
it declined from 17.5 percent to 2.6 percent.
These declines were driven by a sharper focus by C. Sectoral contributions to headline D. Countries with inflation above
monetary authorities on price stability as the CPI target
primary objective of monetary policy and also by
rapid globalization and the liberalization of
product, labor, and financial markets (Ha,
Ivanova, et al. 2019). In fact, inflation declined so
much over the 1990s and 2000s, the period
sometimes dubbed “The Great Moderation,” that
deflation had become a major concern in some
advanced economies by the early 2000s. In 2019,
before the COVID-19 pandemic struck, inflation E. Inflation in EMDE regions F. Consensus inflation expectations
was below target ranges in almost all inflation-
targeting advanced economies. In about half of
inflation-targeting EMDEs, inflation remained
within target ranges in every year of the period
2012-2019.
Inflation since the outbreak of the pandemic.
Since early 2020, global inflation has been highly
volatile (figure SF1.1.B). In the early stages of the
pandemic, between January and April 2020, Sources: Consensus Economics; Haver Analytics; International Monetary Fund; World Bank.
Note: CPI = consumer price index. EMDEs = emerging market and developing economies.
global inflation declined by about 1 percentage A. Based on a sample of 155 countries (30 advanced economies and 125 EMDEs). The values show
year-on-year headline CPI inflation. Last observation is 2021.
point amid a collapse in demand and plunging oil B.E. Year-on-year inflation. Lines show group median inflation for 81 countries, of which 31 are
prices. In May 2020, however, global inflation advanced economies and 50 are EMDEs. Low-income country (LIC) inflation is based on 8 LICs. Last
observation is April 2022.
started to pick up with a rebound in oil and food C. Median headline CPI inflation (annual averages) in 12 sectors across 147 countries. Sectors are
categorized following the International Financial Statistics. “Food” indicates food, beverages, tobacco,
prices and a recovery of activity following the and narcotics sectors. “Furnishing” indicates furnishings, household equipment, and routine
household maintenance sectors. “Housing” indicates housing, water, electricity, gas, and other fuels.
easing of the lockdowns that had been introduced “Other goods and services” include clothing, health, communication, recreation, education,
restaurants, and miscellaneous sectors. 2022 is based on average inflation between January and
during the first wave of the pandemic. The surge April 2022.
in commodity prices resulting from Russia’s D. Bars show the share of inflation-targeting economies (in percent) with average inflation during the
course of the year (or month) above the target range.
invasion of Ukraine and supply disruptions due to E. EAP = East Asia and Pacific, ECA = Europe and Central Asia, LAC = Latin America and the
Caribbean, SAR = South Asia, SSA = Sub-Saharan Africa. “Pre-pandemic” level is based on average
renewed pandemic outbreaks and movement inflation in 2019.
restrictions in China have further pushed up food F. Figure shows forecasts from Consensus Economics for median headline CPI inflation for 2022-23
based on February 2022 and May 2022 surveys of 32 advanced economies and 50 EMDEs.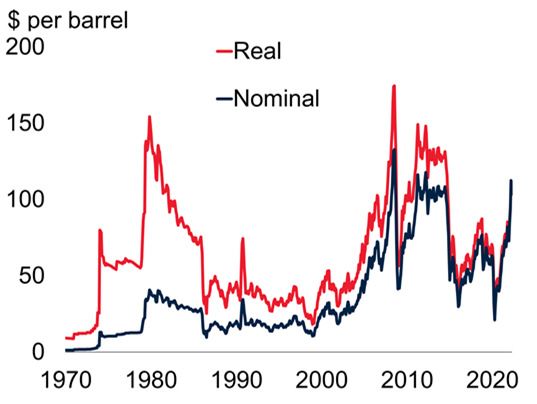
56   S P EC IAL FO CU S 1                                                               G LO BAL EC O NO MIC P ROS P EC TS | J U NE 2022

            and energy prices, and inflation more broadly                        and oil prices have affected different inflation
            (figure SF1.1.C).                                                    measures. While demand shocks were the
                                                                                 dominant force in pushing inflation down in the
            The most recent data, for April 2022, show                           first half of 2020, oil price shocks and supply
            inflation at multiyear highs: globally, at 7.8                       shocks have become more influential in pushing
            percent, its highest level since 2008. Inflation in                  inflation up since early 2021, especially for core
            advanced economies is now at its highest level                       inflation and CPI in advanced economies.
            since 1982, up from near-zero during April-
            December 2020; inflation in EMDEs is at 9.4                          •   January-May 2020. Four-fifths of the decline
            percent, its highest level since 2008, up from a                         in global inflation over this period reflected
            multidecade low in May 2020. As of April this                            the collapse in global demand as both
            year, inflation was above target in all advanced                         consumption and investment collapsed amid
            economies and almost 90 percent of inflation-                            lockdowns and uncertainty about policies and
            targeting EMDEs (figure SF1.1.D). Among                                  growth prospects (figure SF1.2.B). Another
            EMDE regions, the increase in inflation this year                        one-fifth reflected the plunge in oil prices. For
            has been most pronounced in Europe and Central                           both advanced economies and EMDEs,
            Asia (ECA) as a result of rebounding demand in                           disinflationary effects from collapsing demand
            advanced-economy Europe, disruptions driven by                           and oil prices were partly offset by the
            Russia’s invasion of Ukraine, and the commodity                          inflationary effect of supply disruptions such
            price surge. In contrast, in East Asia and the                           as disruptions to firm operations and global
            Pacific (EAP), where recurring lockdowns have                            shipping caused by pandemic restrictions to
            been implemented, inflation has also risen but has                       domestic economic activity and international
            remained within most central banks’ target ranges                        travel (figures SF1.2.C and SF1.2.D).
            (figure SF1.1.E).
                                                                                 •   May 2020-Mar 2022. The collapses in
            Drivers of recent inflation developments. To                             demand and oil prices as well as supply
            disentangle the quantitative importance of                               disruptions began to unwind from May 2020
            different forces driving global inflation, a factor-                     as consumers, firms, and investors began to
            augmented VAR (FAVAR) model (annex SF1.1).                               adjust their behavior and operations. From
            The model is applied to three global variables—                          May, as international trade and global
            inflation, output growth, and oil price growth—                          manufacturing activity rebounded, easing
            all expressed as month-on-month growth rates.6                           supply bottlenecks began to lower inflation
            The exercise is repeated for advanced economies                          but sharp rebounds in demand and oil prices
            and EMDEs separately, and for headline CPI                               put upward pressure on inflation as
            inflation, core CPI inflation, and PPI inflation.                        consumption shifted from in-person to online
            The PPI tends to have larger tradables content                           transactions. Since mid-2021, when inflation
            than the headline CPI, whereas the core CPI tends                        accelerated and became more broad-based, the
            to have smaller tradables content than the headline                      global growth rebound, rising oil prices and
            CPI (figure SF1.2.A; Ha, Kose, and Ohnsorge                              supply shocks—including shipping bottle-
            2019b). The estimation results document how                              necks, non-oil commodity price pressures and,
            drivers of inflation have shifted since January 2020                     in some countries, wage pressures—have all
            and disturbances associated with demand, supply,                         contributed to rising inflation. Since Russia’s
                                                                                     inflation of Ukraine, oil price surges have
                                                                                     further driven up inflation.
                6 Global inflation and output growth are proxied by the common

            global factors estimated using a dynamic factor model of cross-      •   Alternative inflation measures. The main
            country inflation and industrial production growth, respectively
            (annex SF1.1). The dynamic factor model includes monthly data for
                                                                                     drivers of inflation have been similar across
            31 advanced economies and 52 EMDEs for January 2001 to March             different inflation measures. However, the
            2022. The global oil price is based on the average of Dubai, West        measures differ in the relative roles of different
            Texas Intermediate, and Brent oil prices, as reported in the World
            Bank’s Pink Sheet of commodity prices.                                   types of shocks, reflecting their differing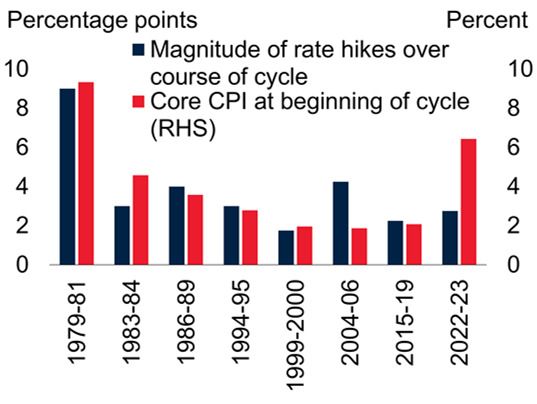
G LO BAL EC O NO MIC P ROS P EC TS | J U NE 2022                                                                                       S P EC IAL FO CU S 1               57

      tradables contents. In particular, core inflation                     FIGURE SF1.2 Drivers of inflation in 2020-22
      has been more susceptible to effects of supply                        Between January and May 2020, demand factors played a major role in
      shocks, with PPI inflation more susceptible to                        dampening global inflation. Since mid-2020, global supply and oil price
      effects from oil price and global demand                              shocks have also contributed significantly to rising inflation.

      shocks (annex SF1.1).
                                                                            A. Share of tradable components                   B. Drivers of global headline CPI
                                                                                                                              inflation in 2020-22
Inflation prospects in the near term. The recent
rise in inflation has led to a reassessment of near-
term inflation prospects. Global inflation is
expected to peak in about mid-2022 and to
decline to about 3 percent in mid-2023 (chapter
1; figure SF1.1.F). This, however, would still be
about 1 percentage point above its average in
2019. Russia’s invasion of Ukraine has resulted in
further increases in near-term inflation
expectations because Russia and Ukraine are major                           C. Drivers of advanced economy CPI                D. Drivers of EMDE CPI inflation in
                                                                            inflation in 2020-22                              2020-22
exporters of many commodities (World Bank
2022a). The war-driven supply shortages and
shipping disruptions have added to price increases
in commodity markets, on top of the sharp price
rises since mid-2020, and to global inflationary
pressures.7 Concerns about persistently above-
target inflation have already prompted central
banks in most advanced economies and many
EMDEs to tighten monetary policy amid a sharp
growth slowdown. Despite this tightening, as of                             Sources: Ha, Kose, and Ohnsorge (2021a); U.S. Bureau of Labor Statistics; World Bank.
                                                                            Note: CPI = consumer price index; EMDEs = emerging market and developing economies.
May 2022, real policy rates (adjusted by actual                             A. Share of tradable goods and services in different inflation measures in the United States. PPI
                                                                            =producer price index.
inflation) remain deeply negative in the average                            B.-D. Contributions to month-on-month inflation in headline CPI for 83 countries, of which 31 are
                                                                            advanced economies and 52 are EMDEs, based on FAVAR models over the period of 2001M1-
advanced economy (-5.2 percent) and in the                                  2022M3. Unexplained residual is omitted from the graph.
average EMDE (-3.2 percent).

Risks to inflation projections. There are material
risks that inflation could rise higher or remain                            into wage and price setting behavior. Financial
elevated for longer than currently projected. If                            market-based inflation expectations have already
supply disruptions persist or commodity prices                              risen with Russia’s invasion of Ukraine and the
continue to climb—in the event of a protracted                              supply disruptions arising from pandemic
war in Ukraine, for example, or recurring                                   outbreaks and        control measures in major
pandemic outbreaks and movement restrictions in                             EMDEs, and there are concerns that a more
China—inflation could remain above central                                  significant unanchoring of inflation expectations
banks’ target ranges in many countries. If                                  could occur that would force major advanced-
inflation remains elevated, the risk will also grow                         economy central banks to tighten policy by more
that expectations of higher inflation become baked                          than currently anticipated, slowing growth and
                                                                            even tipping some economies into recession. The
                                                                            implications of such a confluence of adverse
     7 Even if core inflation and inflation expectations remained           shocks is explored in the global outlook and risks
unaffected by surging energy and food prices, global headline               section of chapter 1.
inflation would rise significantly, at least temporarily since energy and
food together account for 40 percent of the consumption basket in a
typical country. Model-based estimates suggest that an increase in oil
prices alone of 50 percent (approximately the increase over the course
                                                                            Evolution of growth
of 2021) could be associated with a statistically significant increase in
inflation of about 4.4 percentage points after two years (Ha, Kose, et      Growth in the 1960s and 1970s. After two
al. 2019).                                                                  decades of robust global growth in the 1950s and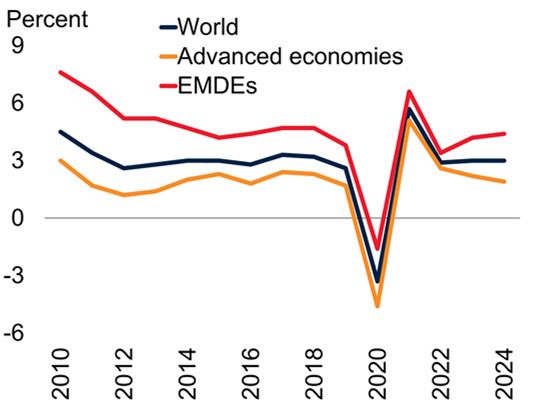
58       S P EC IAL FO CU S 1                                                                               G LO BAL EC O NO MIC P ROS P EC TS | J U NE 2022

FIGURE SF1.3 Growth                                                                                  decade low of 2.6 percent, about 1 percentage
                                                                                                     point below the 3.4 percent in 2011 (figure
The pre-pandemic decade was marked by slowing growth, especially in
EMDEs. This partly reflected a decline in potential growth that cut across                           SF1.3.A). At 3 percent a year on average over the
all EMDE regions. Prospects are for a further decline in potential growth                            decade, growth in the 2010s was considerably
over the 2020s. This has also been reflected in consensus forecasters’
downgrades of long-term growth prospects.
                                                                                                     below average growth of 3.4 percent per year in
                                                                                                     the preceding decade. The pre-pandemic decade
A. Growth                                         B. Potential growth prospects                      was beset by crises and other adverse shocks that
                                                                                                     buffeted a wide range of countries and contributed
                                                                                                     to weaker output and trade growth (Kose and
                                                                                                     Ohnsorge 2020; World Bank 2021a). A rebound
                                                                                                     from the 2007-09 global financial crisis was
                                                                                                     followed by the euro area crisis in 2010-12;
                                                                                                     financial market jitters in 2013 (the “taper
                                                                                                     tantrum”) highlighted financial stability risks in
                                                                                                     some major EMDEs; a steep commodity price
                                                                                                     slide during 2011-16 undercut the main drivers of
C. Potential growth by EMDE region                D. Long-term growth expectations                   growth in a wide swath of EMDEs; a policy-
                                                                                                     guided slowdown in China towards more
                                                                                                     sustainable growth rates eroded export demand for
                                                                                                     many EMDEs; a prolonged period of sluggish
                                                                                                     global trade and FDI flows dampened activity;
                                                                                                     and trade tensions between major economies
                                                                                                     starting in 2017 increased policy uncertainty and
                                                                                                     weakened confidence.

Sources: Consensus Economics; Haver Analytics; World Bank.
                                                                                                     Growth prospects: Near-term. After its pandemic
Note: EMDEs = emerging market and developing economies.                                              -related collapse in 2020, global growth
A. 2022-24 growth rates are based on forecasts. GDP-weighted averages (at 2010-19 average prices
and exchange rates).                                                                                 rebounded to 5.7 percent in 2021, supported by
B.C. GDP-weighted average (at 2010 prices and exchange rates) for 82 countries, including 52
EMDEs. Potential growth estimates based on a production function approach as described in Kilic
                                                                                                     unprecedented fiscal and monetary policy
Celik, Kose, and Ohnsorge (2020) and World Bank (2021b). 2020s forecasts in red bars assume that     accommodation. It is now expected to slow to 2.9
investment grows as expected by consensus forecasts, working-age population and life expectancy
evolve as envisaged by the UN Population Projections, and secondary and tertiary school enrollment   percent in 2022 and 3.0 percent in 2023 because
and completion rates decline by 2.5 percentage points.
C. EAP = East Asia and Pacific, ECA = Europe and Central Asia, LAC = Latin America and the           of the war in Ukraine, the fading of pent-up
Caribbean, SAR = South Asia, SSA = Sub-Saharan Africa.
D. Results from the latest Consensus Economics surveys in each year are presented. Sample
                                                                                                     demand, and the withdrawal of policy support
includes 84 countries (33 advanced economies and 51 EMDEs). The horizontal axis shows the years      amid high inflation (chapter 1). Global growth is
when Consensus Economics forecasts are surveyed.
                                                                                                     expected to remain at 3.0 percent in 2024 as
                                                                                                     output in advanced economies returns to its pre-
                   1960s, the 1970s were a period of sharply slowing                                 pandemic trend. The recovery will lag in EMDEs,
                   global growth. The decade was marked by a global                                  however, where output will remain about 5
                   recession in 1975 and two recessions in the                                       percent below pre-pandemic trends even in 2024.
                   United States (1969-70, 1973-75) with a third                                     These       projections     represent   significant
                   U.S. recession (1980) ushering in the subsequent                                  downgrades from forecasts six months ago. They
                   decade. Overall, global growth in the 1970s                                       are also subject to substantial uncertainty, with
                   averaged 4.1 percent per year, well below the 5.5                                 risks clearly tilted to the downside (see the risks
                   and 5.1 percent, respectively, of the 1960s and                                   section of chapter 1).
                   1950s. The global supply shocks that drove up
                                                                                                     Growth prospects: Longer-term. Beyond the
                   inflation, like the two oil price shocks of the
                                                                                                     near-term, global growth is expected to slow
                   1970s, also drove down growth.
                                                                                                     further over the 2020s, reflecting a trend
                   Growth in the pre-pandemic decade. On the eve                                     weakening of the fundamental drivers of growth
                   of the pandemic, in 2019, global growth reached a                                 (Dieppe 2021; Kose and Ohnsorge 2020; World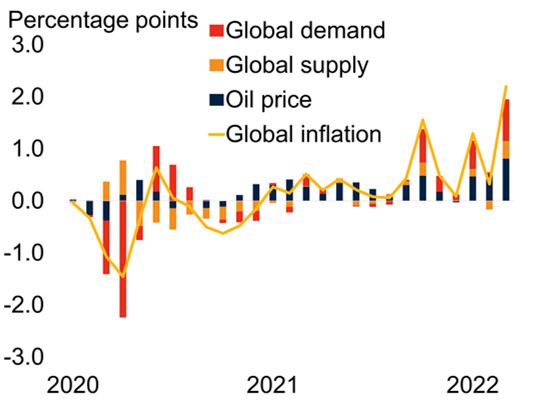
G LO BAL EC O NO MIC P ROS P EC TS | J U NE 2022 S P EC IAL FO CU S 1 59
Bank 2021b; figures SF1.3.B SF1.3.C; annex advanced economies and many EMDEs have
SF1.2). Working age population shares in strengthened central bank credibility and helped
advanced economies began declining in the mid- anchored long-term inflation expectations.
1980s; in EMDEs, this process started in about
2010 and is set to continue over the next decade. Similarities to the 1970s
The elevated uncertainty about the effects of both
The current juncture resembles the early 1970s in
the pandemic and Russia’s invasion of Ukraine on
three key respects: supply shocks and elevated
global trade and investment networks is expected
global inflation in the near-term, preceded by a
to cause investment growth to remain weak
protracted period of highly accommodative
(World Bank 2019). A global productivity growth
monetary policy in major economies, together
slowdown since the early 2010s is expected to
with recent marked fiscal expansion; prospects for
continue as the effects of earlier improvements to
weakening growth over the longer term, which
education and health outcomes as well as factor
echo the unforeseen slowdown in potential growth
reallocation wane. As a result, global potential
of the 1970s; and vulnerabilities in EMDEs to the
growth—the growth rate of the global economy
monetary policy tightening by advanced
at full capacity utilization, absent cyclical shocks—
economies that will be needed to rein in inflation.
in the 2020s is expected to be 0.6 percentage
points a year lower than in the 2010s (World Supply shocks after prolonged monetary policy
Bank 2021b). Consensus forecasters have accommodation. Supply disruptions driven by the
recognized the weakening of fundamental drivers pandemic and the recent supply shock dealt to
of growth and have steadily downgraded their long global energy and food prices by Russia’s invasion
-term (10 years ahead) growth forecasts since the of Ukraine resemble the oil shocks in 1973 and
early 2000s (figure SF1.3.D). This has been the 1979-80 (figure SF1.4.A). The 1970s witnessed
case for both advanced economies and EMDEs: the largest energy and food price shocks of the past
long-term growth forecasts for advanced fifty years. Price increases between April 2020 to
economies have been downgraded by 0.6 March 2022 were the second largest for energy
percentage point between 2012 and 2022; for and third largest for food for any equivalent period
EMDEs, they have been downgraded by 1.8 since 1970 (figure SF1.4.B). Then and now,
percentage point. monetary policy generally was highly accom-
modative in the run-up to these shocks, with
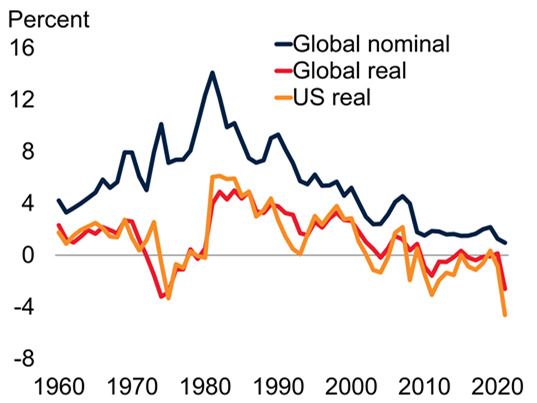
Echoes of the stagflation interest rates negative in real (inflation-adjusted)
terms for several years (figures SF1.4.C and
of the 1970s? SF1.4.D). Global real interest rates averaged -0.5
percent over both the 1970-1980 and the 2010-
The rapid emergence of above-target inflation
2021 periods. The experience of the 1970s was
around the world has raised concerns that an era
that the delay in raising monetary policy rates
of low inflation is coming to an end. Forces
ultimately made the required increase much
supporting the global expansion of output in
greater (figure SF1.4.E). After several months of
recent decades—which included technological
above-target inflation in major advanced
advances, the shift of labor out of agriculture in
economies, a steeper-than-anticipated policy
many EMDEs, globalization, and rapid
tightening may now again be required to return
population growth—were strongly disinflationary.
inflation to target—and this might trigger a hard
As these fade, alongside recent supply shocks,
landing (Blanchard 2022; Summers 2022;
inflationary pressures could build, echoing the
Gagnon 2022). With EMDE debt at multidecade
experience of the 1970s, when large supply shocks,
highs, the associated rise in global borrowing costs
accommodative policies, and a fading of structural
and exchange rate depreciations may trigger
forces that promoted growth and disinflation
financial crises, as it did in the early 1980s.
triggered prolonged stagflation. A key difference
that mitigates the risk of such a reoccurrence is Weaker growth. The global economy has been
that improved monetary policy frameworks in emerging from the pandemic-related global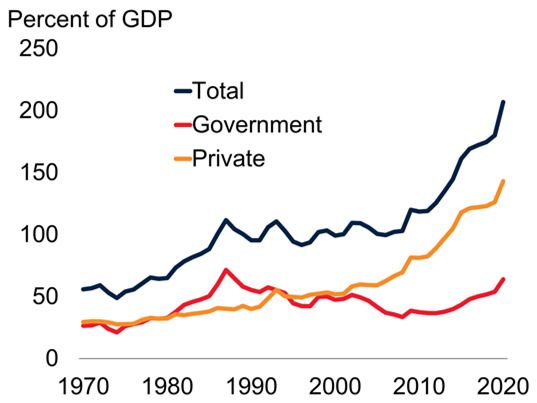
60 S P EC IAL FO CU S 1 G LO BAL EC O NO MIC P ROS P EC TS | J U NE 2022
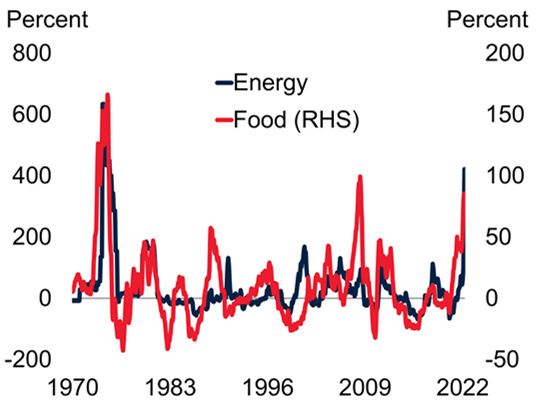
FIGURE SF1.4 Developments in the 1970s and 2020s: recession of 2020, just as it did during the
Similarities stagflationary period after the global recession in
Recently, as in the 1970s, inflation has been rising amid surges in 1975 (figure SF1.4.F).8 While the inflation run-up
commodity prices and low interest rates. The recent rise in inflation has since the 2020 global recession triggered by the
been accompanied by a steep slowdown in global growth, as in the 1970s. COVID-19 pandemic has been less steep than
that after the 1975 recession, the projected growth
slowdown is considerably steeper. Between 2021
A. Oil price B. Change in food and energy prices
and 2024, global growth is projected to slow by
2.7 percentage points, more than twice as much as
between 1976 and 1979. The slowdown is
expected to be particularly pronounced for
advanced economies, but it will also be significant
for EMDEs. This slowdown mostly represents a
return to potential growth after the post-recession
rebound, which reflected the response to massive
policy stimulus.
C. Interest rates D. Real interest rates
Over the 2020s as a whole, potential global
growth is expected to slow 0.6 percentage point
below the 2010s average. This structural weaken-
ing would resemble the prolonged growth
slowdown during the stagflation of the 1970s. For
comparison, annual average global growth slowed
by 1.2 percentage point between the 1960s and
1970s and by another 1.1 percentage point during
the 1980s (to 3 percent on average, Kose,
E. Magnitude of rate hikes and core F. Slowdowns in growth after global Sugawara and Terrones 2021).9 The current
CPI over previous U.S. Federal recessions
Reserve tightening cycles
juncture also invites comparisons to the persistent
overestimation of potential growth and
underestimation of output gaps in the 1970s.10
8 The global recession of 1975 followed the first major oil price
shock the world economy had ever experienced (Kose and Terrones
2015). Oil prices shot up fourfold following the OPEC’s oil embargo
that began in October 1973. Although the embargo ended in March
1974, the supply shock associated with the sharp rise in oil prices
Sources: Federal Reserve Economic Data; Haver Analytics; World Bank. quickly translated into a substantial increase in inflation and a deep
Note: CPI = consumer price index.; EMDEs = emerging market and developing economies. contraction in output in a number of countries.
A. Nominal and real crude oil prices (averages of Dubai, Brent, and WTI prices). Real oil prices are 9 This trend slowdown in global potential growth has also been
deflated by U.S. CPI index (March 2022 = 100).
reflected in a steady decline in the neutral real interest rate (Holston,
B. Percent change in monthly energy and food price indices over a 24-month period. Because of data
limitations, prior to 1979, the energy price change is proxied using the oil price change. Laubach, and Williams 2017). The gap between actual real interest
C. D. Figure shows nominal and real (CPI-adjusted) short-term interest rates (Treasury bill rates or rates and neutral real interest rates proxies the degree of monetary
money market rates, with the maturity of three months or less). Global interest rates are weighted by policy accommodation. Although real interest rates now are much
GDP in U.S. dollars. Sample includes 113 countries, though the sample size varies by year.
E. Blue bars show the extent of policy rate increases during previous tightening cycles: 1979-81, 1983
more deeply negative (-3.4 percent in the 2020s) than in the 1970s
-84, 1986-89, 1994-95, 1999-2000, 2004-06, 2015-19. Value for 2023 is an estimate based on market (nil on average), the gap to the respective neutral rates (4.3 percent in
expectations for the level of the Fed Funds rate in mid-2023. Core CPI for 2022-23 shows latest data the 1970s, 0.4 percent in the 2020s) is similar. Since the neutral
associated with tightening cycle.
interest rate is unobservable, its estimates are highly uncertain;
F. Figure shows changes in global growth (in percentage points) between 2021-24 and 1976-79;
covers three years following a rebound from a global recession. depend on macroeconomic forces, policy regimes, and estimation
approach; and have only a tenuous link to trend output growth
(Brand, Bielecki, and Penalver 2018; Clark and Kozicki 2005;
Hamilton et al. 2016; Summers and Rachel 2019).
10 Some researchers discussed the roles of overoptimistic
assessment of the output gap associated with the productivity
slowdown of the late 1960s and early 1970s in driving inflation and
monetary policy decisions (DeLong 1997, Orphanides 2003, and
Blinder and Rudd 2013).G LO BAL EC O NO MIC P ROS P EC TS | J U NE 2022 S P EC IAL FO CU S 1 61
Significant EMDE vulnerabilities. In the 1970s FIGURE SF1.5 EMDE vulnerabilities
and early 1980s, as now, high debt, elevated Previous waves of debt accumulation ended when real interest rates rose.
inflation and weak fiscal positions made EMDEs In the 1970s, high debt, elevated inflation, and weak fiscal positions made
EMDEs vulnerable to rising borrowing costs.
vulnerable to tightening financial conditions. The
stagflation of the 1970s coincided with the first
global wave of debt accumulation of the modern
A. Debt in EMDEs B. Total debt
era (figures SF1.5.A and SF1.5.B; Kose et al.
2020).11 Low global real interest rates and the
rapid development of syndicated loan markets
encouraged a surge in EMDE debt, especially in
Latin America and many low-income countries
(LICs), especially in Sub-Saharan Africa. In Latin
America, total external debt rose by 12 percentage
points of GDP over the course of the decade
while, in LICs, it rose by 18 percentage points of
GDP. Much of this debt was in foreign currency C. External debt and foreign currency D. U.S. policy interest rates
and short-term, as capital flowed from oil share of government debt
exporters to EMDEs with large fiscal and current
account deficits (figure SF1.5.C). When major
advanced-economy central banks—and especially
the U.S. Federal Reserve—started to forcefully
tighten monetary policy in the late 1970s to stem
inflation, a series of debt crises erupted (figure
SF1.5.D).
By comparison, the 2010s featured the fourth Sources: Haver Analytics; International Monetary Fund; Kose et al. (2020); Kose, Sugawara, and
(and current) wave of global debt accumulation Terrones (2021); World Bank.
Note: EMDEs = emerging market and developing economies.
involving the largest, fastest, and most broad- A.B. GDP-weighted averages based on a sample of up to 153 EMDEs.
C. External debt (percent of GDP) is based on GDP-weighted average of up to 137 EMDEs. Foreign
based increase in government debt by EMDEs in currency share of government debt is an average of up to 36 EMDEs.
D. Based on quarterly data. Start of a wave defined as the first three years of the wave. Crisis defined
the past 50 years. A number of LICs are already as the year before, and year of, widespread crises. First wave: 1970-72 and 1981-82; second wave:
either in or near debt distress. The sheer 1990-92 and 1996-97; third wave: 2002-04 and 2008-09; and fourth wave: 2010-12. The latest data
(data for “now” in the fourth wave) are as of 2022Q1. Real interest rates are deflated by consumer
magnitude and speed of the debt buildup price index.
heightens the associated risks. Additional
vulnerabilities have arisen from increased exposure
to nontraditional official creditors and to Smaller shocks. At least thus far, the magnitude of
commercial debt (Kose et al. 2021). This, commodity price jumps has been smaller than in
combined with the risk that inflation pressures the 1970s. In the wake of the two major oil crises,
will force steep monetary policy tightening among oil prices quadrupled (in U.S. dollar terms) in
major advanced economies, raises the specter of a 1973-74 and doubled in 1979-80. As of May
renewed series of financial crises in EMDEs, as in 2022, oil prices have roughly tripled from their
the 1980s. lows of early 2020 and doubled since early 2021,
but to a level that is still only about two-thirds of
Differences from the 1970s those in 1980. For now, global inflation in 2022 is
still less broad-based than it was in the 1970s, and
There are some important cyclical and structural core inflation has remained relatively low in most
differences between the 1970s and the current countries, even if it has recently picked up.12 This
situation. stands in contrast to 1979-80, when a steep global
11 There have been four waves of broad-based debt buildup in 12 The Unites States is an exception among advanced economies
EMDEs since 1970: 1970-89; 1990-2001; 2002-09; 2010 onwards. in its much broader-based inflation pressures.62 S P EC IAL FO CU S 1 G LO BAL EC O NO MIC P ROS P EC TS | J U NE 2022
FIGURE SF1.6 Developments in the 1970s and 2020s: United States, has been described as “go/stop”
Cyclical differences policy that oscillated between concerns about
Inflation is still lower and less broad-based than in the 1970s. Wage growth unemployment and inflation and, with the benefit
and unemployment rates are mostly still below those in the 1970s. of hindsight, ended up being accommodative
(Blinder 1979; Goodfriend 2004). Many central
A. U.S. sectoral inflation B. CPI inflation banks in advanced economies, freed in 1971 from
the constraints of the Bretton Woods system of
fixed exchange rates, aimed to support economic
activity with monetary expansion, without
realizing that potential output growth had started
to slow (DeLong 1997). Monetary policy was
guided by a naïve view of the Phillips curve, which
suggested tradeoffs between unemployment and
inflation that could be exploited for policy
purposes (Bernanke 2003).13 Policy makers tended
C. Wage inflation D. Unemployment rate to attribute rising inflation to special factors,
and underestimated the size of demand pressures
and the persistence of inflation (Blinder 1979;
Primiceri 2006).
The vast majority of EMDE central banks sought
to maintain exchange rate pegs or tightly managed
exchange rate regimes to anchor inflation during
1950-1980 (Ilzetzki, Reinhart, and Rogoff 2019).
Sources: Haver Analytics; International Monetary Fund; OECD; World Bank.
These central banks did not have operational
Note: CPI: consumer price index. independence but often dealt with challenges
A. Sectoral CPI inflation (monthly averages of year-on-year inflation) in the United States. 2022 is
based on the averages of January to April 2022. “Others” includes communication, recreation, associated with high inflation, partly driven by
education, restaurants, and miscellaneous sectors.
B. Annual averages of headline and core CPI inflation in the United States and global (average
chronic fiscal imbalances. In EMDEs, the
across 66 countries). 2022 is based on the averages of January to April 2022. financial sector was repressed as uncompetitive or
C.D. Annual averages of wage growth (C) or unemployment rate (D). 2022 is based on the averages
of January to April 2022. government-owned banks kept nominal interest
rates artificially low. International capital flows
were also subject to controls (Frankel 2010).
inflation acceleration was broad-based across In contrast, central banks in advanced economies
virtually all sectors (figures SF1.6.A and SF1.6.B). and many EMDEs now have clear mandates for
High inflation in some sectors is expected to price stability, typically expressed as an explicit
return to low levels once supply disruptions ease
and commodity prices stabilize (Ilzetzki 2022).
However, the rate of unemployment is lower now
than it was at the end of the 1970s implying 13 What became apparent over the 1970s was that the relation-
ship between unemployment and inflation was unstable because
potentially even larger wage and price pressures changes in inflation expectations, so that a given level of unemploy-
(figures SF1.6.C and SF1.6.D). ment could be accompanied by any number of inflation outcomes
(Friedman 1968; Kuttner and Robinson 2010; Phelps 1968). As a
result, central banks today estimate the Phillips curve using the con-
More credible monetary policy frameworks. cept of the non-accelerating inflation rate of unemployment, the
Monetary policy frameworks have become NAIRU, and take into account inflation expectations (Tootell 1994;
increasingly focused on price stability over time. Coibion et al. 2018). They no longer consider themselves able to
permanently change unemployment (that is, change the NAIRU) but
In the 1970s, central banks often faced competing instead focus on achieving inflation targets (Gordon 2011). In the
objectives—aiming for both high output and United Kingdom, monetary policy was less reliant on the Phillips
curve as a policy tool but generally skeptical of a major role for mone-
employment, as well as for price stability. tary policy as a driver of inflation (Nelson 2001, Nelson and Nikolov
Monetary policy in the 1970s, in particular in the 2004).G LO BAL EC O NO MIC P ROS P EC TS | J U NE 2022 S P EC IAL FO CU S 1 63
inflation target (figure SF1.7.A). They have FIGURE SF1.7 Developments in the 1970s and 2020s:
adopted transparent operating procedures, Structural differences
announcing and justifying their settings for the Inflation expectations are better anchored than in the 1970s. Inflation
policy rate after regularly scheduled monetary targeting and lower energy intensity may help contain the transmission of
surging global energy prices into core inflation. Wage-setting
policy decision meetings. Over the past three
arrangements are less centralized now than in the 1970s.
decades, many have established a credible track
record of achieving their inflation targets (Bordo A. Number of countries with inflation B. U.S. inflation expectations
et al. 2007; Eichengreen 2022). targeting
Better-anchored inflation expectations. As a result
of improvements in policy frameworks and better
anchored inflation expectations, inflation—in
particular core inflation—has become much less
sensitive to inflation surprises (figure SF1.7.B).
The correlation of core inflation with import
prices or producer prices, which are more sensitive
to commodity price shocks, has declined
significantly over time, despite continued high C. Labor market flexibility D. Global energy intensity
correlation between headline CPI inflation and
PPI and import price inflation. This weakened
correlation is also consistent with better-anchored
inflation expectations (Ha, Kose, and Ohnsorge
2019). Similarly, the response of inflation
expectations to inflation surprises, another
indicator of the strength of the anchoring of
inflation expectations, has fallen sharply over the
past two decades, especially in advanced Sources: BP Statistical Review; Haver Analytics; OECD; U.S. Energy Information Administration;
economies. World Bank.
Note: TOE=Tonnes of oil equivalent.
A. Based on the clarification of IMF Annual Report on Exchange Arrangements and Exchange
More flexible economies. The 1970s were a time Restrictions and country-specific sources.
B. U.S. consumer inflation expectations based on April 2022 University of Michigan survey.
of considerable structural economic rigidities, C. Collective bargaining rates indicate percent of employees with bargaining powers. Trade union
density rates indicate the number of union members as a percent of total employees. Aggregation is
many of which have since been changed. In the based on median across a balanced set of 25 economies.
D. Energy includes coal, natural gas, and oil. TOE stands for tonnes (metric tons) of oil equivalent.
average OECD country, collective bargaining Aggregates calculated using GDP weights at average 2010-19 prices and market exchange rates.
covered four-fifths of employees; and the use of
income and price policies as an instrument of
inflation control (purportedly to help maintain
low unemployment) was widespread among
advanced economies, with price and wage controls The intervening decades have seen sweeping
were put in place in the United States in response liberalizations of labor, product, and financial
to the oil price shock of 1973 (figure SF1.7.C).14 markets. By 2020, only half of employees in
In 1973, interest rate and credit controls were in OECD countries were covered by collective
place in all but three OECD countries and all bargaining; and by 2018, product market
EMDEs with available data had interest rate regulations had eased such that the OECD’s
controls and all but one maintained credit controls product market regulation index has fallen to two-
(Abiad, Detragiache, and Tressel 2010). thirds its level two decades previously (Égert and
Wanner 2016; OECD 2019). By 2005, interest
rate and credit controls had been entirely
14 In the United States, in addition to rising energy and food
eliminated in all but five OECD countries;
prices, the relaxation of wage and price controls in 1973 also interest rate controls had been removed in about
contributed to a jump in inflation in the early 1970s (Blinder 1982). three-quarters of EMDEs and credit controls in64 S P EC IAL FO CU S 1 G LO BAL EC O NO MIC P ROS P EC TS | J U NE 2022
almost one-half (Abiad, Detragiache, and Tressel End of stagflation of the
2010; Calice, Diaz-Kalan, and Masetti 2020).
Today’s greater economic flexibility, with less 1970s and lessons for today
centralized wage setting and less financial
repression, allow a faster supply and demand Policy tightening in the late 1970s and early 1980s
response in sectors where prices are rising to contain high inflation played a major role in
particularly rapidly and reduce the likelihood of triggering a global recession in 1982 and financial
price-wage spirals becoming entrenched. crises in EMDEs. This experience illustrates the
risk of inflation remaining elevated amid weak
In addition, the energy intensity of GDP has growth, forcing a strong monetary policy response,
fallen considerably since the 1970s (figure and triggering a global recession and financial
SF1.7.D; World Bank 2022a; Igan et al. 2022). In crises among the EMDEs. A key lesson from the
advanced economies and EMDEs, energy 1970s is that central banks need to act in a pre-
efficiency has increased, with a steady decline in emptive manner to avoid a loss of confidence in
the amount of energy needed to generate a dollar their commitment to maintaining low inflation—
of income. Oil-importing countries have taken specified today in their inflation targets—and to
numerous steps to reduce their vulnerability to prevent a de-anchoring of inflation expectations.
energy shocks. Instead of oil, they have substituted Fiscal policy also needs to do its part, not least
other sources such as natural gas and renewables, since monetary policy will struggle to be credible if
including solar and wind. fiscal positions are unsustainable.
Less fiscal accommodation. The 1960s and 1970s Aftermath of high inflation in the 1970s
were marked by expansionary fiscal policy. In
contrast, fiscal policy tightening is expected in Recessions in advanced economies. Eventually, in
coming years as governments withdraw the the late 1970s and early 1980s, monetary policy
unprecedented fiscal support provided during the tightening—guided by prioritization of the aim of
pandemic. In the two dozen advanced economies restoring price stability—reduced inflation in
with available data, primary fiscal balances advanced economies to a median of 3 percent in
weakened by 1.5-6.5 percentage points of GDP 1986 from its peak of 15 percent in 1974, and
and government spending rose by 5-25 percentage established central bank credibility, although often
points of GDP over the course of the 1970s.15 In at the cost of deep recessions with high
contrast, today, fiscal policy is expected to tighten unemployment.16 In the United States, for
in advanced economies over the forecast horizon, example, short-term interest rates almost doubled
as governments unwind fiscal support in 2020 that between early 1979 and mid-1981, with the
averaged 29 percent of GDP in advanced federal funds rate reaching a peak of 19.1 percent.
economies and 7 percent of GDP in EMDEs In the wake of these interest rate increases, U.S.
(World Bank 2022b). By 2023, two-thirds of output contracted by more than 2 percent
advanced economies are expected to have between early 1981 and mid-1982 and
unwound most of this stimulus and, by 2024, unemployment reached a peak of 10.8 percent in
two-thirds of EMDEs are expected to have done late 1982. The sharp increase in policy rates in the
so. This is likely to constitute a major brake on United States coincided with a synchronized
demand growth and help moderate price decline in global activity and played a major role
pressures. in triggering the 1982 global recession (figures
SF1.8.A and SF1.8.B; Kose and Terrones 2015).
In advanced-economy Europe, some central banks
15 Fiscal policy volatility was substantial in the United States had prioritized inflation control early, and had
during 1960-80. Great Society spending in the early 1960s was
compounded by Vietnam war spending in the mid-1960s, only
partially unwound with the 1968 tax surcharge to rein in inflation,
followed by social spending in the run-up to the 1972 presidential 16 In addition to the United States, many advanced economies
election and a tax cut in 1975 to spur a recovery, and then followed tightened monetary policy during this period, including Austria,
by fiscal consolidation amid concerns about inflation (Blinder 2004). Canada, Germany, and the United Kingdom.G LO BAL EC O NO MIC P ROS P EC TS | J U NE 2022 S P EC IAL FO CU S 1 65
responded earlier to rising inflation. As a result, in FIGURE SF1.8 End of stagflation of the 1970s and
these countries, peak inflation was lower than in vulnerabilities in EMDEs
the United States, although the inflation declines Policy tightening in the late 1970s and early 1980s to contain high inflation
were also accompanied by tighter monetary policy contributed to a highly synchronized downturn in growth in many countries
and a global recession in 1982. The global recession was followed by
and recessions in the early 1980s.17
financial crises in EMDEs in the 1980s and 1990s. Because of high debt
and sizable fiscal and current account deficits, there is a danger that
Financial crises in EMDEs. While inflation in financial stresses will again emerge in EMDEs.
advanced economies generally declined after the
1982 global recession, it remained high in A. Global recessions B. Fraction of countries in recession
EMDEs throughout the 1980s and was
accompanied by financial crises (figure SF1.8.C).
A number of Latin American countries and LICs
were particularly vulnerable to rising borrowing
costs because they had had accumulated large
debts during the 1970s (mainly funded from the
windfall reaped by the oil-exporting countries
from high world oil prices). The sharp increase in
global interest rates and the collapse of
commodity prices in the early 1980s made C. Financial crises in EMDEs D. Vulnerabilities in EMDEs
servicing this debt very difficult (Arteta et al.
2015). Amid a contraction in global trade during
the 1982 global recession, Mexico’s default in
August of that year marked the beginning of the
Latin American debt crisis and the region’s “lost
decade.” In LICs, especially in Sub-Saharan
Africa, levels of debt were much lower in nominal
terms than in Latin America, although they
became very high relative to GDP over the same
Sources: Kose, Sugawara, and Terrones (2020); Haver Analytics; International Monetary Fund;
period. Many of these countries also experienced Laeven and Valencia (2020); World Bank.
financial stress and faced sovereign debt crises in Note:
A. Figure shows global per capita GDP growth in the years of global recessions since 1960.
the 1980s. B. Share of countries in recession, defined as a contraction in per capita GDP.
C. Total number of banking, currency, and sovereign debt crises in EMDEs over respective periods.
D. Medians based on a sample of up to 155 EMDEs.
Implications for the 2020s
In the near-term, inflation is likely to remain
elevated as recent demand and supply shocks
continue to affect wage and price setting. But 1970s, central banks have well-established
there are reasons to expect that these pressures will inflation targets, strengthened operational
prove temporary. Unlike the situation in the autonomy and, in many cases, substantial
credibility built up over several decades. Inflation
expectations are therefore more likely to remain
17 Central banks in Germany, Austria, and Switzerland, in
well anchored, especially if central banks signal
particular, operated more transparent and discretionary monetary
policies, based partly on their historical experiences of high inflation, their resolve to contain price pressures (Armantier
compared with other advanced economies (Laubach and Posen et al. 2022; Bordo and Orphanides 2013). As
1997). The central banks in these countries kept money supply central banks tighten monetary policy and
growth, their main monetary policy tool at the time, lower than in
the United States and other major European countries. This resulted pandemic-related fiscal stimulus is unwound,
in lower inflation in these countries in the late 1970s—on average 2- demand pressures will moderate; as the supply
5 percent in 1976-80—than in the United States (9 percent), the
United Kingdom (14 percent), Italy (16 percent), and France (11
disruptions caused by Russia’s invasion of Ukraine
percent). Over the same period, output growth in these countries was are priced in, commodity prices will stabilize,
about 3 percent, comparable to that in the United States and other albeit at high levels; and as global production lines
major European countries.66 S P EC IAL FO CU S 1 G LO BAL EC O NO MIC P ROS P EC TS | J U NE 2022
and logistics adjust, supply bottlenecks will ease point as the share of the working-age population
(Ilzetzki 2022; Reifenschneider and Wilcox 2022; stabilizes even in EMDEs (World Bank 2018).
World Bank 2022a).
Technological advances. Automation, the increas-
However, the experience of the 1970s is a ing adaptability of computers, robotics, and artifi-
reminder that there is still a considerable risk that cial intelligence have improved production pro-
inflation remains high or continues to rise. First, cesses in many sectors. These factors have lowered
there could be further supply shocks which could demand for routine production and clerical work-
cause repeated inflation overshoots that may ers and lowered wage and price pressures (Autor,
eventually de-anchor inflation expectations. Dorn, and Hanson 2015). In some advanced
economies, disinflation has also been attributed to
Second, central banks could fail to reach their price transparency and competitive pressures in-
inflation targets often or long enough that the troduced by the growing digitalization of services
public loses confidence in their commitment or (Goolsbee and Klenow 2018; Dong, Fudurich,
ability to maintain price stability. While wage and Suchanek 2017). It is possible that the biggest
growth thus far has generally been moderate gains from such technological advanced have now
outside the United States, higher inflation been exhausted and future progress will be slower.
expectations could eventually raise it and become
entrenched in institutional arrangements such as Globalization. Over the past three decades, the
automatic indexation and cost-of-living entry of China and Eastern Europe into the global
adjustments (Boissay et al. 2022). trading system has greatly reduced the prices of
many manufactured goods. Over the past decade,
Structural forces of disinflation however, the maturing of global value chains ap-
pears to have contributed to slowing trade growth
In addition to these short-term risks to inflation,
(World Bank 2020b). New tariffs and import re-
the structural forces that have depressed inflation
strictions, rising protectionist sentiment and grow-
over recent decades may fade. Demographic
ing geopolitical risks may eventually slow or even
changes, technological advances, globalization,
reverse the pace of globalization and its disinfla-
and structural changes were instrumental in
tionary impact.
keeping inflation low over the past three decades
(Ha, Kose, and Ohnsorge 2022). Should these Sectoral shifts. In EMDEs, the large-scale shift of
forces recede, increases in short-term inflation may resources from agriculture to higher productivity
become more persistent, and thus threaten the employment in manufacturing of- fered
anchoring of long-term inflation expectations productivity gains (Dieppe 2021). The
(Gersbach 2021; Rogoff 2003, 2014). momentum for such shifts has already slowed over
While all these structural factors have been the past decade and may slow further over the
credited with contributing to the decline in next decade. As this process slows, its
inflation over the past three decades, the disinflationary impacts may recede.
magnitudes of their effects remain poorly
Policy frameworks. Over the past four decades,
understood. These forces could also interact with
many advanced economies and EMDEs imple-
cyclical shocks that could generate unpredictable
mented macroeconomic stabilization programs
swings in inflation.
and structural reforms, improved fiscal frame-
Demographic changes. Rapid labor force growth, works, and gave their central banks clear mandates
due to population growth and increased participa- to control inflation. Mounting public and private
tion of women, helped dampen increases in wages debt in EMDEs or populist sentiment could
and input costs (Goodhart and Pradhan 2020). weaken commitment to disciplined fiscal and
There is possibility that the disinflationary benefits monetary policy frameworks (Ha and Kindberg-
reaped from this process are now at an inflection Hanlon 2021; Kose et al. 2019).You can also read