Global Private Markets Outlook - Prepare to pivot: the global rates cycle is poised to unlock capital

Page created by Amber Schneider
 
CONTINUE READING
Global Private Markets Outlook - Prepare to pivot: the global rates cycle is poised to unlock capital
Global Private
Markets Outlook
Prepare to pivot: the global rates cycle is poised to unlock capital
J U LY 2 0 2 4
Global Private Markets Outlook - Prepare to pivot: the global rates cycle is poised to unlock capital
A Broad range of private market capabilities across New York Life Investments

                                                                                                                                           NYL Real Estate Investors Division

          Private Debt                                                    Private Equity                                                       Real Estate                            Private Assets Multi-Manager

 • Direct lending                                           • Fund investments                                                 • Core
 • Impact investing                                         • Secondary investments                                            • Core-plus
 • Unitranche                                               • Co-investments                                                   • Value added
 • Special situations                                       • Emerging and diverse                                             • Opportunistic
 • Junior and mezzanine                                     • GP Stakes                                                        • Real estate debt
 • CLOs                                                     • Private real assets

                Candriam has been appointed by the relevant boutique(s) to distribute some products and strategies, in those jurisdictions where it is legally and regulatory permitted

                    The products or services of certain NYL Investors affiliated boutiques are not available, and materials relating to them will not be distributed, to any person
                    domiciled in any jurisdiction or region where such distribution would be contrary to local law or regulation.

                                                                                                                                                                                                                     2
GLOBAL PRIVATE MARKETS OUTLOOK

Executive Summary

The last two years can be described as a slow-motion liquidity crunch across private markets. Consistently high interest rates have created a
domino effect on liquidity, effectively freezing portfolios with private investment exposure. Now, economic activity is beginning to slow, and
central bank rate cuts could unearth a generational opportunity in private markets allocation.
Our view of the market
                                                  Capital markets conditions                                                                Impact on private markets
                      • Stable economic growth                                                                  • “Search for yield” drove rapid growth in private markets fundraising, and a build up
    Post-GFC period

                                                                                                                  in private equity dry powder
                      • Low interest rates
                                                                                                                • Growth in private credit market, offering an alternative to traditional banks for
                      • Significant increase in money supply globally due to central bank policy
                                                                                                                  financing
                      • Banking regulation increased in response to the global financial crisis
                                           Attractive, stable returns for public equities                                 Attractive private markets performance with limited dispersion
                      • Sticky inflation impacts corporate profits                                              • Fundraising, deal activity, and exit activity have slowed significantly
 Post-pandemic

                      • Higher interest rates and less availability of leverage make debt financing more        • Investors see a persistent bid-ask spread on valuations among buyers and sellers
                        expensive
     period

                                                                                                                • Dry powder continues to be concentrated in large and mega funds
                      • Falling profits and higher cost of debt may contribute to an increase in bankruptcies
                                                                                                                • Default risk is increasing as the cost of debt rises
                      • Geopolitical risk is on the rise, increasing macroeconomic-related volatility
                                                                                                                • Less debt capital and higher interest rates may impact ability to generate returns
                                   Economic uncertainty driving volatility in public markets                                           Expected return dispersion to increase
                      • Moderate inflation and rates are likely here to stay                                    • An impending global shift in yields, coupled with secular economic disruptions,
                                                                                                                  creates a generational opportunity for investors in our view
                      • Global economic cycles are diverging, as countries outside the U.S. begin to cut
    Looking ahead

                        interest rates                                                                          • The exit environment is showing signs of a modest rebound, as private equity sellers
                                                                                                                  seek to monetize both aging and higher-quality portfolio companies
                      • Structural trends related to digitization, electrification and climate change, and
                        supply chain re-globalization keep upward lean to prices

                        Persistence of macroeconomic headwinds means that business building and
                                                                                                                Outperformance potential remains, but investment selection, diversification, and
                             earnings growth will matter more than financial engineering when
                                                                                                                    value add opportunities are more critical to achieving attractive results.
                                                   generating returns.
                                                                                                                                                                              Opinions of New York Life Investments, 2024.

                                                                                                                                                                                                                         4
Our view of key asset classes

                       Private equity                                    Private credit                                           Real estate                                         Real assets
•    After a two-year slide in deals, exits, and        •   There is still ample room to run in private        •   The early phase of countries’ rate-cutting       •   Infrastructure now represents an independent
     funds closed, private equity activity stabilized       credit, in our view. Current yields remain             cycles may kickstart a generational                  allocation category among investors.
     somewhat in the first half of 2024. LP                 attractive on an absolute and relative basis.          opportunity in real estate allocation. A
                                                                                                                                                                    •   Global trends related to digitization, climate
     pressure is beginning to generate deal                                                                        normalizing yield curve tends to signal the
                                                        •   Despite the growth in commitments to                                                                        change, and supply chain re-globalization are
     activity.                                                                                                     largest range in debt and equity opportunities
                                                            private credit over time, investors remain                                                                  already fueling a structural increase in real
                                                                                                                   for private investors.
•    Paths to liquidity are evolving, creating              underweight in this asset class relative to                                                                 assets demand. Private real assets represent
     durable opportunities in secondaries                   their targets, suggesting room for future          •   Credit opportunities remain strong as rates          a diversified and in some cases undervalued
     markets in our view.                                   expansion.                                             move steadily lower. Adding to this                  opportunity to capture that demand.
                                                                                                                   opportunity is the fact that many countries’
•    Fundraising has been concentrated in large         •   In the event of a more significant economic
                                                                                                                   banks are still on the sidelines due to
     and mega funds. In response, we are                    slowdown, we are focused on the factors that
                                                                                                                   regional banking concerns and prospects for
     focused on markets with supply-demand                  have historically provided resilience,
                                                                                                                   enhanced regulation.
     dynamics that enable high investment                   including conservative capital structure,
     selectivity.                                           availability of liquidity, and debt coverage.      •   Though there is likely downside in U.S. office
                                                            Contrary to common assumption, size is the             to come, the bottom in valuations may
•    As the macroeconomic environment evolves,
                                                            least significant factor contributing to default       already be in for many sectors, creating a
     business building and earnings growth may
                                                            frequency over time. Compared to similar               market timing opportunity in equity.
     matter more than financial engineering for
                                                            asset classes, default rates for middle market
     generating private equity returns.                                                                        •   Investors who can see to recapitalization and
                                                            private companies have been lower and
                                                                                                                   liquidity needs may see opportunistic
•    Consider lower leverage opportunities as               recovery rates have been higher.
                                                                                                                   investments among otherwise high quality
     economic activity slows.
                                                                                                                   managers and assets.
                                                                                                               •   Focus on sectors experiencing secular
    The “deep dive” section at the end of this piece illustrates one of our highest conviction                     demand.
    perspectives in this turning point period: size. We see the lower middle market as an opportunity
    for diversification, relative stability, and attractive supply-demand dynamics for investors.

Opinions of New York Life Investments, 2024.

                                                                                                                                                                                                                     5
Table of contents

   1                                                      2                    3
   Capital market                                         Asset class views    Deep dive
   conditions                                             •   Private equity   • A global case for investing in the lower
                                                                                 middle market: private equity and
                                                          •   Private credit
                                                                                 private credit
                                                          •   Real estate
                                                          •   Real assets

CLICK ON ANY TITLE OR SUBTITLE TO JUMP TO THAT SECTION.

                                                                                                                            6
GLOBAL PRIVATE MARKETS OUTLOOK

Capital Markets Conditions
Private markets represent more than $13 trillion in assets globally
         At the same time, private markets’ small size relative to global capital markets suggests there may be room for growth.

Private markets assets under management (AUM) by strategy and geography
              4500
                                                                North America             Europe          Asia       Rest of world
                                                                                                                                                                                                                             Private markets size in context
                             98
              4000

              3500          379                                                                                                                                                                                    Private markets make up less than 5% of
                                                                                                                                                                                                                   global financing markets:
              3000
                            1003                          120                                                                                                                                                      • Global private capital AUM: $13 trillion

              2500                                                                                                                                                                                                 • Global fixed income outstanding: $103 trillion
 $ billions

                                                                                                                                                                                                                   • Global equity market capitalization: $101 trillion
              2000                                       1294
                                                                                                                       87                            80                                                            • Global size of banking sector balance sheets:
                                                                                                                                                                                  147                                $98 trillion
              1500                                                                       97                           117                           226
                                                                                                                      442                                                         161
                            2393                          213                                                                                       379
              1000                                                                      515                                                                                       486
                                                                                        135
              500                                        1079                                                        1047                           989
                                                                                        625                                                                                       725

                 0
                          Buyout                   Venture capital                    Growth                     Private debt                 Real estate                  Infrastructure
                                                   Private equity                                                Private debt                                Real assets

Source for the chart: McKinsey, “Global Private Markets Review 2024.” Preqin, data as of 31 December 2023. Source for the “in context” list on the right: SIFMA for fixed income and equity market capitalizations, Bank for International Settlements for banking sector balance sheets. Data as of 31 March 2024.

                                                                                                                                                                                                                                                                                                                      8
Investor allocation to private markets has continued to increase...
    In the past, “lower for longer” interest rate drove investor attention to private markets. Now, even amid higher rates, allocation has grown.

•   After the global financial crisis, lower rates forced institutional investors to seek yield and higher returns from private markets. In the current environment, interest rates are higher, but allocations
    continue to grow. Data on investor allocations suggests that investors have more appreciation of the diversifying benefits of the allocation.

Institutional investors have steadily increased their allocations to private markets…
Institutional investor asset allocations, 2014-2023, %

                                                                                                                                                               Private equity
                                                                                                                                                               Real estate
                                                                                                                                                               Infrastructure
                                                                                                                                                               Private credit
                                                                                                                                                               Multi-asset strategies
                                                                                                                                                               Fixed Income
                                                                                                                                                               Stocks

       2014                2015                2016                2017                2018   2019   2020   2021          2022           2023
Sources: McKinsey, CEM Benchmarking, 2024. Allocations as of the beginning of each year.

                                                                                                                                                                                                                  9
... and data suggests there may be more room for growth
    Private markets have grown slower than global financing markets so far, suggesting there may be room for expansion over time.

  Despite relative growth, private markets make up less than 5% of global financing markets,
                    and only 6.7% of the financing growth in the last decade.

 Size and growth of public vs. private markets
                                                                                                                                                                                                                          Private markets growth in context
                                                 Growth 2013-2023 (US$ T, lhs)       Size of market in 2013 (US$ T, lhs)                  % growth 2013-2023 (rhs)

                                     120                                                                                                                                              70%
                                                                                                                                                                                                                  Private markets have grown much slower than
                                                           61.5%                                                                                                                                                  global financing markets over the past decade:
                                                                                                                                                                                      60%
                                     100
                                                                                                                                                                                                                    • $8 trillion increase in private markets AUM
     Size of market, US$ trillions

                                                                                                                                                                                      50%
                                      80                                                                                                                                                                            • $42 trillion increase in global fixed income markets
                                                                                                                                                                                                                      size

                                                                                                                                                                                              % growth
                                                                                      40.8%                                                                                           40%
                                      60                                                                                 34.7%                                    34.7%
                                                                                                                                                                                                                    • $35 trillion increase in global equity market
                                                                                                                                                                                      30%                             capitalization

                                      40                                                                                                                                                                            • $34 trillion increase in the size of global banking
                                                                                                                                                                                      20%                             sector balance sheets
                                      20
                                                                                                                                                                                      10%

                                       0                                                                                                                                              0%
                                           Global private capital assets   Global fixed income          Global equity market               Global size of banking sector
                                               under management               outstanding                  capitalization                         balance sheets

Sources for the chart: Private markets size is gathered from PitchBook; fixed income and equity sizes are gathered from SIFMA, and banking data is gathered from the Bank for International Settlements (BIS). Data gathered on June 2024 for end of year 2023. Source for the “in context” list on the right: SIFMA
for fixed income and equity market capitalizations, Bank for International Settlements for banking sector balance sheets, July 2024.. Since the latest data for some segments goes only to June 30, 2023, data for all segments is provided as of that date, and “the past decade” measures June 3013 to June 2023.

                                                                                                                                                                                                                                                                                                                  10
The rates cycle is likely at a turning point, but markets price “higher for longer”
       We believe expected interest rate cuts would improve market sentiment this year, but long-term expectations are for higher rates.

Higher for longer interest rates are being priced into SOFR and EURIBOR futures

            6                                                                                           SOFR                  SOFR futures                     Euribor                 Euribor futures

            5

            4
  Percent

            3

            2

            1

            0

            -1
                 2014                             2016                                 2018                                 2020                                 2022                                 2024                                 2026                                 2028

Sources: New York Life Investments Global Market Strategy, Federal Reserve, ECB (European Central Bank), Bloomberg, Macrobond, July 2024. The Secured Overnight Financing Rate (SOFR) is a broad measure of the cost of borrowing cash overnight collateralized by Treasury securities. The Euro
Interbank Offered Rate is a daily reference rate, published by the European Money Markets Institute, based on the averaged interest rates at which Eurozone banks borrow unsecured funds from counterparties in the euro wholesale money market.

                                                                                                                                                                                                                                                                                                   11
Higher rates have led to slower fundraising, investment, and exit activity…
                       As interest rate expectations rose in 2022, private markets saw a sharp slowdown in investment and exit activity.

                                            A previously steady increase in fundraising has stalled in recent years.                                                                                          New deal flow and exits have also slowed considerably.

U.S. private equity fundraising activity                                                                                                                                 U.S. private equity deal and exit count

                                          Capital raised ($B), lhs             Fund count, rhs                                                                                                New platform count                    Exit count

                                   $450                                                                                                               1,000                            900                                                                                                                                   700
                                                                                                                        863       847                 900
                                   $400                                                                                                                                                800
                                                                                                                                                                                                                                                                                                                             600
                                   $350                                                                                                               800                              700
  Capital raised, USD $ billions

                                                                                                                                                                                                                                                                                                                             500
                                                                                                                                                      700                              600
                                   $300

                                                                                                                                                                         Investments
                                                                                                    578       582
                                                                                542                                                                   600                                                                                                                                                                    400

                                                                                                                                                            Fund count
                                                                                                                                                                                       500

                                                                                                                                                                                                                                                                                                                                   Exits
                                   $250
                                                                                          471
                                               445                   445                                                                    439       500
                                                         410                                                                                                                           400                                                                                                                                   300
                                   $200
                                                                                                                                                      400                              300
                                   $150                                                                                                                                                                                                                                                                                      200
                                                                                                                                                      300
                                                                                                                                                                                       200
                                   $100                                                                                                               200                                                                                                                                                                    100
                                                                                                                                                                                       100
                                                $148.9

                                                          $142.5

                                                                      $191.3

                                                                                 $251.8

                                                                                           $208.7

                                                                                                     $360.5

                                                                                                               $270.3

                                                                                                                         $363.9

                                                                                                                                   $384.0

                                    $50                                                                                                      $370.2   100
                                                                                                                                                                                          -                                                                                                                                  -
                                     $0                                                                                                               0                                        Q1 Q2 Q3 Q4 Q1 Q2 Q3 Q4 Q1 Q2 Q3 Q4 Q1 Q2 Q3 Q4 Q1 Q2 Q3 Q4 Q1 Q2 Q3 Q4 Q1
                                              2014       2015        2016      2017       2018      2019      2020      2021      2022      2023                                                     2018                2019               2020                2021                2022               2023         2024

Sources: PitchBook, as of March 31, 2024, accessed July 2024. Since full-year data is not available for 2024, data is shown through year end 2023.                                     Sources: PitchBook, as of March 31, 2024, accessed July 2024. Since full-year data is not available for 2024, data is shown through year end 2023.

                                                                                                                                                                                                                                                                                                                                     12
… and contributed to considerably tighter bank lending conditions
  Tighter bank lending standards have constrained economic activity in the U.S. and Europe, giving private actors an opportunity to step in.

In both the U.S. and Europe, higher policy rates have led to an inverted yield curve. This disincentivizes bank lending, and has contributed to a tightening of credit standards, pullback in bank lending, and
less business demand for bank loans. We believe tighter bank credit conditions may provide private lenders the opportunity to fill significant need.

                                                                                                                                                                                                                  13
Company profits have been resilient, but may be reaching a turning point
 After a strong post-pandemic recovery, corporate profits in many countries are now stagnating.

• Fiscal stimulus (pandemic programs) and monetary stimulus (low interest rates, credit facilities)
  allowed companies to both build up cash and deleverage throughout the
  post-pandemic period. As a result, many businesses have protected their bottom lines.
• Large companies with access to public capital markets have maintained strong liquidity (below
  chart), supporting earnings resilience by allowing those companies to invest cheaply-acquired
  capital in a higher-rate environment.
• But for much of the market, cracks are beginning to appear. Top-line revenue growth has slowed
  and profit margins have stagnated (right chart). Indeed, at an aggregate level, corporate profit
  margins after tax are now deteriorating. Results vary meaningfully by company, with some sectors
  and business models still showing impressive resilience. In our view, investors will increasingly
  need to focus on careful credit selection.

                                                                                                      14
Despite headwinds, private market returns have been strong
    Private markets’ historical outperformance of public markets has continued under current macroeconomic conditions.

•   It is difficult to perfectly benchmark private investments to public ones. Risks to private investments can be underestimated by lower reporting frequency. Manager selection and survivorship bias can be
    more important in private markets, which means the aggregate figures can hide large performance dispersion. That said, investors have historically seen higher returns in private markets, thanks in part
    to their illiquidity premium relative to public markets. In addition, there is evidence of this private markets outperformance being rooted in their business models and the more direct influence asset
    managers can have on their portfolio companies or assets. The resulting steady increase in investor allocation to private markets may suggest investors see sustained benefit of that exposure.

Private markets’ historical outperformance has continued in the current environment
Annualized performance of public and private markets asset classes; private assets are indicated by striped bars

       20%                                                                                                                            2010 to 2020           Since 2020
       18%
       16%
       14%
       12%
       10%
         8%
         6%
         4%
         2%
         0%
        -2%
                Buyout funds         Small cap     Distressed        Private                    Venture         Private debt         S&P 500          Private real Liquid private Direct public Global listed                      U.S. high          DJ global            REITs               U.S.
                                    public equity private equity infrastructure                 capital                                                  estate     companies infrastructure infrastructure                          yield          infrastructure                         investment
                                                                                                                                                                                                                                                                                              grade

Sources: New York Life Investments Global Market Strategy and Apogem, July 2024. Sources for public market indices: Bloomberg. Small cap public equity is represented by the Russell 2000. Liquid private companies re represented by LPX50TR. Direct public infrastructure is represented by EDHUSA. Global
listed infrastructure is represented by LPXDITU. GDJ Global infrastructure is represented by the Dow Jones Brookfield Global Infrastructure Index. REITs are represented by the FTSE NAREIT. Source for Private Markets Indices: Preqin Private Capital Performance Quarterly Indices. Please see the disclosure
section of this presentation for additional benchmark details.

                                                                                                                                                                                                                                                                                                             15
The biggest risk to private markets may be overheating – not recession
     Investors often fear recession, but we believe a re-freezing of deal activity due to a turnaround in U.S. inflation could be more perilous.

•    Though global economies have different economic cycles, the size and depth of U.S. capital
     markets means its interest rate cycle has impacted global capital flows. In recent quarters, the
     U.S. economy has been slowing, giving investors confidence that interest rate cuts – and
     therefore improvements in private markets activity – may be coming. In our view, a key risk to
     private markets is if this trend does not materialize. If the U.S. economy – and inflation – were to
     re-accelerate, potentially reminiscent of the double peak in inflation in the 1980s (chart), it could
     contribute to a more challenging fundraising, distribution, and credit cycle.

Drivers of an economic overheating
    Indicator            Description
                         Amid an economic backdrop of sticky inflation and a tight labor market, incremental
    Policy change        government spending or a large increase in tariffs may increase the likelihood of
                         economic overheating.

                         Profit margins are the last stronghold keeping the labor market intact, but have
    Profit margins
                         been slowing. A reversal in this trend could signal sustained corporate health, but
    rise                 may also mean wage pressures stay high.

                         Manufacturing PMIs are a key leading indicator of the U.S. economy, and have
    Manufacturing
                         signaled contraction for 18+ months. If the manufacturing sector were to re-
    turnaround           accelerate, it would be a sign that the economy may be speeding back up.

                         Loose market financial conditions – in other words, the rally in public equity and
    Loose financial
                         credit spreads – can contribute to greater consumer and CEO confidence, and
    conditions           make it harder to fight inflation.

    Bank lending         As long as the yield curve is inverted, U.S. banks face meaningful pressure on
    standards            their balance sheets and have to be more careful with lending. If this reversed, we
    loosen               could see more support of economic activity.

                                                                                                                                                   16
Global megatrends may shape the private markets opportunity
    Global economic shifts make higher corporate and government spending, inflation, and sector disruption more likely, in our view

•   A powerful combination of global economic and geopolitical events – The COVID-19
    pandemic, the resulting inflation wave, the increasing visibility of climate change,
                                                                                                    Global transitions are shaping capital markets outcomes
    Russia’s invasion of Ukraine, the rapid rise in computing power of semiconductors — is
    overlapping to create sizable change in investor opportunities.
                                                                                                                       Self-sufficiency in semiconductor production is an
•   We believe that the combination of national interest (public funding), corporate                                   impractical and nearly impossible goal for every country.
    leadership (capital expenditure), and universal application (household interest) in these    Digitization
                                                                                                                       Achieving scale in artificial intelligence (AI) production
    trends will result in durable investment.                                                    and AI                will require significant investment in infrastructure and
•   In the near term, we expect these transitions to be highly capital-intensive, resulting in                         application — and may create meaningful opportunity.
    higher inflation: More materials required, higher cost of those materials, and potentially
    “higher for longer” interest rates as a result.
•   In the medium term, as trend adoption broadens and deepens in the medium to long
    term, greater productivity is widely expected to follow, pushing down costs for                                    Existing climate goals, and the more visible impact of
    consumers as certain services become automated.                                                                    climate change, are contributing to stricter regulations on
                                                                                                 Climate change
•   In the long term: How interest rates absorb the impact of any productivity shock remains                           company activities and property types. In addition, a
                                                                                                 and electrification   green transition will require extensive use of raw
    uncertain. It comes down to the simplest economic growth formula: The potential growth
    rate depends on the amount of capital stock, the amount of labor, and how productive                               materials, especially if limited to current technology.
    labor is in making use of this capital.
•   For private markets: market disruptions and capital-intensive investments impact supply
    and demand factors in some markets (e.g. real assets), and the ability to compete in
    others (e.g. company results). Investors can assist by identifying attractive supply-                              Investors have been focused on de-globalization, but the
    demand dynamics or provide the business-building acumen and capital reserves that            Supply chain          complex nature of global supply chains makes it more
    enable companies to better navigate or even capture these economic transitions.
                                                                                                 re-globalization      likely that re-globalization – A focus on access rather
                                                                                                                       than efficiency of production — will become the norm.

                                                                                                                                    Opinions of New York Life Investments Global Market Strategy, July 2024.

                                                                                                                                                                                                         17
GLOBAL PRIVATE MARKETS OUTLOOK

Asset class views
PRIVATE EQUITY                        PRIVATE CREDIT                    REAL ESTATE                    REAL ASSETS

                  PRIVATE EQUITY                       PRIVATE CREDIT                 REAL ESTATE                    REAL ASSETS

 Summary
                  Our key takeaways per asset class, explored in depth throughout this section.

                                Private equity                                                                         Private credit                                   Real estate                                                 Real assets
 •                A sharp decline in credit availability and M&A                           •    During a turbulent time, private credit has        •    The early phase of countries’ rate-cutting         •    In our view, global transitions towards
                  activity has resulted in depressed exit                                       been a relative bright spot, topping private            cycles may kickstart a generational                     digitization, electrification, and supply chain
                  activity for PE funds and ultimately lower                                    markets asset classes in terms of fundraising           opportunity in real estate allocation. A                re-globalization are likely to increase demand
                  distributions for LPs. Without the distributions                              growth, increases in assets under                       normalizing yield curve tends to signal the             for real assets. We believe this demand may
                  LPs need to reinvest, PE funds struggled to                                   management, and performance.                            largest range in debt and equity opportunities          come through at least two channels. The first
                  fundraise at the same pace as previous                                                                                                for private investors.                                  is a physical need for commodities and
                                                                                           •    Despite the growth in commitments to
                  years.                                                                                                                                                                                        materials to build the structures and items
                                                                                                private credit over time, investors remain         •    Europe has seen more price discovery
                                                                                                                                                                                                                (infrastructure) required to fuel these global
 •                In response to higher rates, investors are                                    underweight in this asset class relative to             already. While the U.S. may see more
                                                                                                                                                                                                                megatrends. The second is that this capital-
                  seeing more conservative capital structures                                   their targets.                                          volatility, especially in office, we believe the
                                                                                                                                                                                                                intensive stage in the global economic
                  and lower use of leverage. Historically,                                                                                              bottom is in on many sectors’ valuations. In
                                                                                           •    In the event of a more significant economic                                                                     environment may increase inflation and
                  middle market private equity managers utilize                                                                                         our view, this means a market timing
                                                                                                slowdown, private credit may be able to                                                                         interest rate volatility. Historically, real assets
                  leverage more conservatively than their large                                                                                         opportunity in equity may be arising.
                                                                                                navigate the environment more fluidly                                                                           have outperformed in periods of higher
                  and mega peers, which has contributed to
                                                                                                because the direct relationship between            •    Investors have often focused on disruptions             inflation and rates volatility.
                  the proven resilience of fund performance
                                                                                                borrowers and lenders can provide higher                to office space related to work-at-home
                  during higher rate and recessionary periods.                                                                                                                                             •    We believe that demand for infrastructure
                                                                                                flexibility. This appears to be even more the           adjustments. But similar disruptions are
                                                                                                                                                                                                                may have knock-on effects for other asset
 •                With less availability of leverage and longer                                 case for the middle market. Historically                driving higher rents in other sectors.
                                                                                                                                                                                                                classes as well, including listed equity,
                  hold periods, we believe PE funds will need                                   speaking, default rates for middle-market               Environmental improvements, better
                                                                                                                                                                                                                bonds, as well as private assets including
                  to implement effective value creation                                         private companies have been lower and                   amenities, and strong demand related to
                                                                                                                                                                                                                private equity and demand for loans.
                  initiatives and grow company profits in order                                 recovery rates have been higher when                    secular changes (i.e. demand for data
                  to deliver strong returns.                                                    compared to similar asset classes.                      centers warehousing, and logistics) create
                                                                                                                                                        opportunities in our view.

                                                                                               Investor approach: Capture the benefits of higher       Investor approach: Investors who can play across
                 Investor approach: Focus on lower leverage                                                                                                                                                    Investor approach: Capture benefits of global
                                                                                               yield in both U.S. and European direct lending.         the capital stack, risk spectrum, and geographies
                 opportunities and markets with supply-demand                                                                                                                                                  transitions related to digitization, climate change,
                                                                                               We favor the middle market and lower-middle             can potentially capitalize on market disruption.
                 dynamics that enable high investment selectivity.                                                                                                                                             and supply chain re-globalization.
                                                                                               market due to their historical relative safety.         Focus on sectors experiencing secular demand.
                                                                                                                                                                                                           Opinions of New York Life Investments, 2024.

                                                                                                                                                                                                                                                                      19
PRIVATE EQUITY                                       PRIVATE CREDIT                    REAL ESTATE                  REAL ASSETS

                 PRIVATE EQUITY                                       PRIVATE CREDIT                 REAL ESTATE                  REAL ASSETS

Private equity: fundraising has slowed overall, and strongly favors larger firms
                 Investors observe ample capital chasing too few deals in large and mega funds, a dynamic that has continued even as fundraising slowed

 •               In the years after the global financial crisis, private equity fundraising volumes seemed to go in only one direction: up. But since 2022, higher financing costs and an uncertain macroeconomic
                 environment has created a challenging backdrop for private equity managers. Fundraising slowed, and managers were on the fundraising trail longer to raise this capital: funds that closed in 2023 were
                 open for a record-high average of 20.1 months, compared to 18.7 months in 2022 and 14.1 months in 2018, according to McKinsey.
 •               Despite the challenges for aggregate fundraising, market structure in private equity has remained consistent. Large and mega funds have dominated the fundraising environment (chart).
 •               As the macroeconomic environment shifts away from the stable, low rate, “wind at your back” period of the 2010s, business building and earnings growth may matter more than financial engineering
                 when generating private markets returns. We believe this creates opportunities in less efficient parts of the market, and in areas where supply-demand dynamics enable investment selectivity.

        Large and mega funds have dominated fundraising
        US private equity fundraising by fund size, two-year rolling average

                                            400                                                                                                                         +240% in large and mega fundraising
PRIVATE EQUITY                     PRIVATE CREDIT                    REAL ESTATE                 REAL ASSETS

                 PRIVATE EQUITY                     PRIVATE CREDIT                 REAL ESTATE                 REAL ASSETS

 Private equity: dry powder is also concentrated in large and mega funds
                 A buildup of dry powder in large and mega funds creates a deep pool of durable capital for potential acquirers of middle market companies

  •              Despite fundraising challenges, large and mega private equity funds’ dry powder has increased by an average of 13% annually over the past 3 years, relative to 5% and 5% for core middle market and
                 lower middle market funds, respectively.
  •              Just as fundraising has favored large and mega private equity funds, dry powder in these funds now accounts for 55% of total private equity dry powder. While this is seemingly positive for asset
                 gatherers, these markets continue to see intense competition for deals, driving up multiples even in the current environment.
  •              We view the size and concentration of dry powder as a potential positive for middle market private equity, as it means there is less competition in the space, and more capital up-market for companies to
                 exit into. As deal volume resumes, investors may find a modest period in which a relatively lower volume of capital can be deployed in a rising number of deals.

 Average year-over-year change in dry powder by fund size
                                                                                                                                                   Funds > $5B: Potential acquirers of middle market companies

                                                                                                                             13%                                                                < $1B
                                                                                                                                                                                                 11%

                                                                                                                                                                     Funds > $5B
                                                                                                                                                                     55% of Dry
                                                                                                                                                                     Powder
                              5%                                                      5%                                                                                                            $1B - $5B
                                                                                                                                                                                                      34%

                             < $1B                                                 $1B - $5B                                 $5B+

  Sources: Pitchbook, data through December 31, 2023. Data shows average year-over-year change in dry powder by fund size over the last three years, for U.S. private equity.

                                                                                                                                                                                                                         21
PRIVATE EQUITY                                 PRIVATE CREDIT                    REAL ESTATE                  REAL ASSETS

                             PRIVATE EQUITY                     PRIVATE CREDIT                 REAL ESTATE                  REAL ASSETS

Private equity companies are acting with discipline amid higher rates and risk
                             Leverage for large corporate leveraged buy-outs has fallen. More conservative structures may reduce risk in a downturn by creating more flexibility.

 •                           Higher rates have resulted in more discipline among private equity companies. We are seeing more conservative capital structures and lower use of leverage. These developments may allow for more
                             flexibility, as well as a high ability to withstand downturns.
 •                           Historical private equity performance has been driven significantly by leverage, which accounted or approximately 50% of investment returns for buyout deals from 2010 to 2021, according to Bain.
                             Reduced use of leverage in the current environment, combined with the higher cost of financing, would have a mitigating effect on investment returns for the current vintage of deals, all else equal. This
                             trend, combined with lower exit multiples, should they sustain, will make operational improvements within portfolio companies critical for investment outperformance in the current environment.

 Leverage has declined in the recent higher rate environment
 Median North America and Europe PE buyout EV-to-EBITDA multiples

                             14.0x                                                                                             Median EV/EBITDA      2024 YTD

                             13.0x
     EV-to-EBITDA multiple

                             12.0x

                             11.0x

                             10.0x

                              9.0x

                              8.0x

                              7.0x
                                      2010                      2011     2012                  2013    2014                 2015     2016     2017    2018        2019           2020            2021            2022            2023        2024 YTD

 Sources: New York Life Investments Global Market Strategy, PitchBook, “Q1 2024 Global Private Markets Fundraising report.” Year to date (YTD) 2024 represents partial year data., as of 31 March 2024. EV indicates enterprise value, which is an economic measure reflecting the market value of a business.
 EBITDA indicates earnings before interest, tax, depreciation, and amortization.

                                                                                                                                                                                                                                                                                                                 22
PRIVATE EQUITY                     PRIVATE CREDIT                    REAL ESTATE                     REAL ASSETS

                 PRIVATE EQUITY                     PRIVATE CREDIT                 REAL ESTATE                      REAL ASSETS

 Paths to liquidity are evolving; both traditional and new sources appear to be on the rise
                 Longer hold times have allowed the secondaries market to mature, and have contributed to the growth of strategic add-on or value add.

  •              Among traditional sources of liquidity: Large private equity funds have durable pools of capital that have continued to grow even among higher interest rates and macroeconomic volatility. Corporate
                 buyers are holding larger stockpiles of cash as well. We believe these buyers will be motivated to put capital to work as – and even before – the M&A environment normalizes.
  •              Among new sources of liquidity: The secondary market has grown rapidly in the last decade. This growth has been driven in part by increasing sophistication of LPs in utilizing the secondary market to
                 manage their private markets exposure – allowing them to exercise more control over their portfolio and liquidity. This provides other secondary investors with more consistent deal flow, as sales are not
                 exclusively tied to economic downturns. The market has also seen an increase in GP-led secondary volume, most prominently continuation vehicles (CVs). CV transactions enable GPs to continue
                 holding their favored assets, while allowing LPs the option to receive liquidity from the transaction or roll their exposure into the new structure.
  •              In addition, many larger PE funds have focused on strategic add-ons to grow companies. This strategy has become particularly attractive when managers can grow existing platforms with management
                 teams they know rather than risk acquisition of a new platform. Add-on deal activity has been relatively resilient in the current environment, which can present a new path to exit for portfolio companies.

                                                         Traditional sources of liquidity                                                                                                         Evolving sources of liquidity

                            +35% increase                                                                    +47% increase                                           50% increase                                                        75%+
                          … in corporate cash                                                      … in large & mega PE dry powder                           … in annual secondary volume                                     … of new PE deals are add-ons
          US$ trillions                                                                    US$ billions                                                US$ billions                                                    Deal count

                                                                                                                                    398                                                          $111                     2018       2023
                                                           2.5

                         1.8                                                                                       270                                               $74

                                                                                                                                                                                                                                           4,864
                                                                                                                                                                                                                             3,266
                                                                                                                                                                                                                                                          1,759         1,436

                        2018                              2023                                                     2018            2023                             2018                         2023                              Add-on                   New Platform

  Source: Bloomberg, July 2024                                                            Source: PitchBook. Includes U.S. and Canada PE Funds > $5   Source: Greenhill, “Global Secondary Market Review, H1 2023.”   Source: PitchBook, “US Private Equity Breakdown, 2024 Q1”, data
                                                                                          billion, as of December 31, 2023.                           Figures as of December 31, 2023.                                as of 31 March 2024.

                                                                                                                                                                                                                                                                                        23
PRIVATE EQUITY                                              PRIVATE CREDIT                     REAL ESTATE                  REAL ASSETS

                 PRIVATE EQUITY                                              PRIVATE CREDIT                  REAL ESTATE                  REAL ASSETS

Private credit: the bright side of higher rates
                 Private credit’s risk-return characteristics are, in our view, well suited to the current environment.

 •               In the last 15+ years, allocation to private credit has grown as (1) bank regulation resulted in banks stepping back from loan making, and (2) “lower for longer” interest rates encouraged more asset
                 allocators to learn about the asset class. Private credit loan volume surpassed the broadly syndicated loan market in 2018, with market share expanding more rapidly in the COVID and high inflation
                 environments of the last few years (left chart).
 •               Despite the growth in commitments to private credit over time, investors remain underweight in this asset class relative to their targets. In fact, the allocation gap has only grown wider in recent years, in
                 contrast to other private asset classes, suggesting investors may commit even more new capital to the asset class just to reach current target, as is explored on the next page.
 •               Private credit’s risk-return characteristics are, in our view, well suited to the current environment. With interest rates at their highest in more than a decade, current yields in the asset class have grown
                 more attractive on both an absolute and relative basis (right chart), particularly if higher rates sustain and put downward pressure on public market returns. In our view, the built-in security derived from
                 debt’s privileged position in the capital structure also appeals to investors that are wary of market volatility and valuation uncertainty.

                 Private credit has consistently expanded market share over the past decade                                                                                         Direct lending yields remain elevated, compensating investors well
                                                                                                                                                                                                        for any risk taken, in our view
        Annual middle market sponsored lending loan volumes                                                                                                             Direct lending yields and spreads
                                               140
                                                                                                                                                                                                    Middle-market unitranche spreads                    Middle-market unitranche yield
                                                                                       Broadly Syndicated              Private Credit                                  14%
                 Loan volume ($ in billions)

                                               120
                                                                                                                                                                       12%
                                               100
                                                                                                                                                                       10%
                                                80                                                                                                                      8%

                                                60                                                                                                                      6%
                                                                                                                                                                        4%
                                                40
                                                                                                                                                                        2%
                                                20
                                                                                                                                                                        0%
                                                 0                                                                                                                             Q1 Q2 Q3 Q4 Q1 Q2 Q3 Q4 Q1 Q2 Q3 Q4 Q1 Q2 Q3 Q4 Q1 Q2 Q3 Q4 Q1 Q2 Q3 Q4
                                                     2014        2015              2016       2017             2018    2019               2020    2021   2022   2023                  2018                 2019                 2020                2021               2022              2023

 Sources: Apogem, LSEG LPC’s 1Q24 US Sponsored Middle Market Private Deals Analysis. Compares middle market sponsored broadly syndicated                               Sources: New York Life Investments Global Market Strategy Team, LSEG LPC, May 2024.
 loans to middle market sponsored broadly direct lending.

                                                                                                                                                                                                                                                                                                24
PRIVATE EQUITY                                   PRIVATE CREDIT                      REAL ESTATE                     REAL ASSETS

                  PRIVATE EQUITY                                  PRIVATE CREDIT                   REAL ESTATE                     REAL ASSETS

 Several factors contribute to sustained growth potential for private credit
                   Growth in loan demand and loan volume appears to be healthy, not bubble-esque.

  •                  First, private credit assets under management have increased by more than 12% annually since COVID, but remains relatively small in the private markets landscape. Related, average allocations for
                     private credit have fallen behind institutional investor targets (left chart), meaning that even catching up to current targets could result in stronger allocations.
  •                  Second, sustained dry powder accumulation in private equity creates a strong potential capital base for private credit deals (right chart) in our view.
  •                  Third, we have seen more private credit loans replacing banks and broadly syndicated loans in recent years, particularly in the middle market. Why? Borrower preference. A smaller group of long-term-
                     focused lenders can facilitate workouts during challenging periods that are otherwise more complicated when a syndicate of lenders or banks are involved.
  •                  And finally, the maturity wall of loans and public bonds coming due in the next 2-3 years is likely to create an opportunity for direct lending to step in.

                                            Investors are under-allocated to private credit relative to targets                                                            Sustained expansion in private equity dry powder creates, in our view, a strong
                                                                                                                                                                                          potential capital base for private credit deals

        Difference between effective and policy allocations by private markets                                                                                          Dry powder: North American buyout private equity vs. private credit
        asset class by year
                                                                                                                                                                                              Private equity buyout & growth dry powder                      Private credit dry powder
                                 1.5           Private equity                      Real estate                   Infrastructure                  Private debt
                                                                                                                                                                                     $900                                                                                                  $846
                                                                                                                                                                                                                                                                                 $789
                                 1.0                                                                                                                                                 $800
                                 0.5                                                                                                                                                 $700                                                                   $639      $630
                 DIfference, %

                                                                                                                                                                                                                                                  $571
                                                                                                                                                                                     $600

                                                                                                                                                                           USD $bn
                                 0.0                                                                                                                                                                                              $493
                                                                                                                                                                                     $500                            $421
                                 -0.5                                                                                                                                                $400   $328        $357
                                                                                                                                                                                                                                                                          $237      $242          $263
                                                                                                                                                                                     $300                                                                      $213
                                 -1.0                                                                                                                                                                                                      $171      $159
                                                                                                                                                                                     $200      $113          $119         $143
                                 -1.5                                                                                                                                                $100
                                 -2.0                                                                                                                                                  $0
                                     2019                              2020                             2021                              2022                  2023                         2015        2016         2017          2018           2019      2020      2021       2022      2023

  Source: McKinsey, CEM Benchmarking, 2024. Annual data is shown as of the beginning of each year.                                                                     Source: Preqin, as of December 31, 2023. Data accessed July 2024.

                                                                                                                                                                                                                                                                                                         25
PRIVATE EQUITY                         PRIVATE CREDIT                    REAL ESTATE                  REAL ASSETS

                 PRIVATE EQUITY                         PRIVATE CREDIT                 REAL ESTATE                  REAL ASSETS

 We believe private credit is well positioned to weather any upcoming economic storm
                 Flexibility between borrower and lender can provide flexibility in troubled times. This has historically been truer in the middle market.

  •               Direct lending is a long-term investment, with funds often targeting 5, 7, or even 12 years of invested capital. Changes in the macroeconomic environment, and the arrival of unexpected risk, are likely to
                  occur in those time frames. As a result, underwriters work to understand a borrower’s demand drivers, cost structure, and sensitivity to impacts to those drivers. This deep understanding of a borrower’s
                  creditworthiness helps not only in making the proper security selection and investment structure, but also in the ability to take a proactive stance in supporting borrowers when risks arise. The capital
                  structure, collateral, and covenants that our investors require create room for the risks that arise.
  •               In the event of a more significant economic slowdown, private credit may be able to navigate the environment more fluidly because the direct relationship between borrowers and lenders can provide
                  higher flexibility. This appears to be even more the case for the middle market. Historically speaking, default rates for middle-market private companies have been lower and recovery rates have been
                  higher when compared to similar asset classes.

                 Historically, middle market default rates have been lower and recovery rates have been                                                                                 Covenant-lite loans are not prevalent in direct lending deals.
                                      higher when compared to similar asset classes.
                                                                                                                                                                                 % of new deals issued over the last 12 months
        Default rate %, 1995-2019                                                            Recovery rates %, 1995-2019
                                                                                                                                                                                100%
                                                                                                      Middle market had a
                 4.0%                                                                        90%     higher rate of recovery
                           Middle market                                                                                                                                          80%                                                                                   90%
                                         3.70%                                               80%
                             had fewer
                              defaults.                         3.50%                        70%                      80%
                 3.0%                                                                                                           75%
                                                                                             60%                                                                                  60%
                                  2.50%                                                      50%
                 2.0%
                                                                                             40%                                                                                  40%
                                                                                             30%
                 1.0%                                                                        20%                                                                                  20%
                                                                                                                                            20%                                                                   22%
                                                                                             10%
                 0.0%                                                                         0%                                                                                   0%
                                                                                                Middle market          Broadly syndicated   High-yield bonds                                        Covenant-lite direct loans                       Broadly syndicated loan market
                  Middle market    Broadly syndicated              High-yield bonds

  Sources: Mercer S&P Credit Pro, 2021. The “middle market” and “broadly syndicated” market default and recovery rates are calculated by S&P Global            Sources: J.P. Morgan Investment Bank, data as of March 2024. Covenant-lite or “cov-lite” loans refer to loan agreements that do not contain the usual
  Market Intelligence research. High yield bonds are defined by the S&P U.S. High Yield Corporate bond index, which is designed to track the                   protective covenants for the benefit of the lending party.
  performance of U.S. high yield corporate bonds. Past performance is not indicative of future results. AN investment cannot be made in an index.

                                                                                                                                                                                                                                                                                                                       26
PRIVATE EQUITY                       PRIVATE CREDIT                    REAL ESTATE                 REAL ASSETS

                 PRIVATE EQUITY                       PRIVATE CREDIT                 REAL ESTATE                 REAL ASSETS

Real estate: a confluence of global trends
                 Investors have been focused on disruptions to office, but there are layers of structural factors impacting real estate supply and demand.

Key factors impacting real estate supply and demand                                                                                      In response to global trends, real estate valuations have declined in
                                                                                                                                         both the U.S. and Europe
            Factor                Description

                                  Higher interest rates directly influence capitalization rates (cap rates) both by
                                                                                                                                                                      Green Street Commercial Property Price Indices (2007=100)
            Cost of
                                  reducing a property’s current market value, and by increasing its operating                                 170
            capital               cost through higher commercial mortgage rates.

                                                                                                                                              150
            Economic
                                  Slowing economic activity tends to reduce investor optimism for real estate.
            cycle                                                                                                                             130

                                                                                                                                              110
                                  Real estate asset performance can be directly driven by national and localized
            Regulations           factors such as rent control, environmental mandates, zoning, and transfer tax
                                  policy.                                                                                                       90

                                                                                                                                                70
                                  The rising cost of materials and labor (including for construction or renovation                                                                                                                                      Europe          US
            Rising costs          and operating costs) and capital expenditure (via higher interest rates)
                                                                                                                                                50
                                  increases real estate operator’s costs, reducing net operating income.

                                                                                                                                                     2007

                                                                                                                                                             2008

                                                                                                                                                                     2009

                                                                                                                                                                             2010

                                                                                                                                                                                     2011

                                                                                                                                                                                             2012

                                                                                                                                                                                                       2013

                                                                                                                                                                                                              2014

                                                                                                                                                                                                                     2015

                                                                                                                                                                                                                            2016

                                                                                                                                                                                                                                   2017

                                                                                                                                                                                                                                          2018

                                                                                                                                                                                                                                                 2019

                                                                                                                                                                                                                                                         2020

                                                                                                                                                                                                                                                                 2021

                                                                                                                                                                                                                                                                        2022

                                                                                                                                                                                                                                                                               2023

                                                                                                                                                                                                                                                                                      2024
            Sector-               Property values may be impacted by other trends such as an investor flight to
            specific              quality, lease timelines, specific supply and demand factors, remote work and
            factors               hybrid work, and the trend towards e-commerce.

 Opinions of NYL Real Estate Investors, July 2024. Capitalization or “cap” rates are calculated by dividing a property’s net operating   Sources: Tristan Capital Partners, Green Street, July 2024.
 income by its current market value.

                                                                                                                                                                                                                                                                                             27
PRIVATE EQUITY                               PRIVATE CREDIT                      REAL ESTATE                      REAL ASSETS

                 PRIVATE EQUITY                               PRIVATE CREDIT                   REAL ESTATE                      REAL ASSETS

More than just office apocalypse: geographic and sector diversification
                 Investors have focused on office-related risks, but geographic, sector, and structural divergence create opportunity in our view.

 •               Commercial real estate (CRE) has experienced a one-two punch in recent years. First came the pandemic, which pushed many white-collar jobs to work at home for a time, a trend that has proven to
                 be sticky in the U.S. Then came the interest rate hiking cycle of 2022-2023, which has impacted capitalization rates and valuations across commercial real estate asset classes. As explored on the
                 previous page, environmental mandates in select jurisdictions, higher operating and higher tenant improvement costs have also impacted the sector.
 •               The extent of now-empty office space gets much of investors’ attention. For example, in the U.S. office values have dropped 39% this cycle, vs -47% in the GFC (Green Street Advisors); Fitch Ratings
                 expects office delinquencies to rise to 9.9% in 2025, surpassing the GFC peak.
 •               But we see important areas of nuance and resilience among these trends. First, and four years after the pandemic, investors now have concrete data showing that office trends vary meaningfully by
                 country (left chart). Within countries, too, there are differences. Using the U.S. as an example, newer class A+ office buildings have outperformed; geographies like south Florida benefited from the
                 migration of corporations, jobs, and people. Finally, structural trends make it such that other areas of commercial real estate have yet to settle out. (right chart). In our view, this points to potential
                 opportunity varying by geography and sector.

                                                                    Divergence within global office markets                                                                     Commercial real estate is a diversified asset class, and performance dispersion has
                                                                                                                                                                                                           changed sector composition.
       Share of workers who would prefer to never or rarely work in the office
       (%)                                                                                                                                                                 U.S. private real estate index weights
            60                                                                                                                                                                40%
                                                                                                                                                                                                                                                                                         Apartment
                                                                                                                                                                                                                                                                                 33.6%
                                                                                                                                                                                                                                                                                         Industrial
                         43
                                                                                                                                                                              30%                                                                                                        Office
            40                                                                                                                                                                                                                                                                   29.2%
                                     32                        31                                                                                                                                                                                                                        Retail

                                                                                                                                                                                                                                                                                 18.0%   Hotel
                                                                         24               24                                                                                  20%
                                                                                                                                                                                                                                                                                         Healthcare
            20                                                                                      17         16                  15       14                                                                                                                                   10.6%   Self storage
                                                                                                                                                        9                     10%
                                                                                                                                                                                                                                                                                         Land
                                                                                                                                                                   4                                                                                                             3.7%
                                                                                                                                                                                                                                                                                         Other
                 0                                                                                                                                                             0%
                     United States   Spain                     Japan    Canada     Ireland         United    Singapore           Germany   France   Switzerland   China          2012      2013    2014     2015    2016     2017     2018    2019   2020   2021   2022   2023
                                                                                                  Kingdom

 Source: Tristan Capital Partners, Cushman & Wakefield, JLL, Capital Economics, July 2024.                                                                                Sources: NCREIF, data accessed June 2024 and available through Q1 2024.

                                                                                                                                                                                                                                                                                                        28
PRIVATE EQUITY                     PRIVATE CREDIT                      REAL ESTATE                  REAL ASSETS

                 PRIVATE EQUITY                     PRIVATE CREDIT                   REAL ESTATE                  REAL ASSETS

 Economic conditions point to emerging capital allocation opportunity
                                                                                                                                                                                                                           • Real estate valuations are driven by more than just the
                 A typical economic cycle: Impacts to interest rate expectations and investor allocation                                                                                                                     economic cycle, but capital markets conditions do have a
                                                                                                                                                                                                                             meaningful impact on the timing and nature of investor
                                                                                                                                                                                                                             opportunity.
                                                                 Cycle Peak
                                                                                                                                                                                                                           • We see different countries and regions as being at different
                                                                                                           Late cycle: Higher rates and slowing growth                                                                       phases in their economic cycles – at least temporarily. Large
                                                                                                           contribute to yield curve inversion. Investors                                                                    fiscal and monetary supports have resulted in stickier inflation
                                                                                                           concerned about overheating (higher rates) or                                                                     and interest rates in the United States. By contrast, the
                                                                                                           valuation pressures may pause allocations or look to                                                              business cycle in places like Canada and Europe has been less
                                                                                                           lower risk elements of the real estate market, such
                                                                                                                                                                                                                             pronounced. As a result, we believe the bottom on real estate
                                                      Expansion: As an economy                             as senior or whole loan credit. Bank lending
                                                                                                           contracts.                                                                                                        valuations may already be in for European markets. In the U.S.,
                                                      grows, a steep yield curve
                                                                                                                                                                                                                             by contrast, there is likely still valuation pain to come –
                                                      promotes demand for riskier                                                                                                                    Economic
                                                      parts of the real estate                                                                                                                                               especially in the office sector. However there are other reasons
                                                                                                                                                                                                     Recovery
                                                      markets, including core-                                                                                                                                               to be constructive: several non-office sectors such as industrial,
                  Economic                                                                                                                                      We believe                                                   warehousing, senior living, and student living may have already
                                                      plus, value-add, and                                                           Market bottoming:
                  Recovery                            opportunistic equity.                                                                                     Europe and                                                   seen their cycle lows.
                                                                                                                                     Yield curve
                                                      Leverage may increase.                                                         normalizes, and            some
                                                                                                                                     valuations reach           segments                                                   • Central banks focus on price stability and, in some cases,
                                                                                                                                     their cycle lows. We       of U.S. real                                                 economic growth. If both hold up in the near term, then interest
                                                                                                                                     believe this is the        estate are                                                   rate cuts may come more slowly than in past cycles. In our
                                                                     Slowdown: An inverted yield curve                               point of largest           here.                                                        view, this would extend the valuation “bottoming” process in
                                                                     and sticky inflation increase investor                          range in debt and                                                                       real estate. In our view, this may create an opportunity for debt
                                                                     concerns. Valuations deteriorate and                            equity opportunities                                                                    and equity to perform well at the same time.
                                                                     activity stalls. A financial crisis or other                    for private investors.
                                                                     freeze-up in capital availability would                                                                                                               • Private investors are also impacted by the entry and exit of
                                                                     amplify the duration and extent of                                                                     Recovery: Yield curve                            bank financing into the system. Bank lending conditions tend to
                                                                     market pain felt.                                                                                      steepens, and banks re-                          contract as the cycle tops, and only re-enter as the yield curve
                                                                                                                                                                            enter the market. Valuations                     steepens in recovery. In this cycle, banks may not return to the
                                                                                                                                                                            show clear improvement.
                                                                                                                                          Cycle Trough                                                                       real estate lending market to the same extent as in previous
                                                                                                                                                                            Investors tend to increase
                                                                                                                                                                            allocation and risk.
                                                                                                                                                                                                                             cycles, due to “Basel III Endgame” provisions increasing the
                                                                                                                                                                                                                             amount of capital banks hold against credit, operational, and
                                                                                                                                                                                                                             market riskiness of their business. All else equal, higher
                                                                                                                                                                                                                             regulatory requirements may reduce bank’s willingness or
   Sources: Opinions of New York Life Investments Global Market Strategy in discussion with Tristan Capital partners, NYL Real Estate, July 2024. For illustrative purposes only. The trough of an economic cycle is the     ability to lend into the space, increasing the opportunity for
   lowest point in economic growth for a country during an economic cycle. A trough does not necessarily mean that there is a recession, but rather depends on the economic cycle.                                           investors with lending skill and a patient capital base.

                                                                                                                                                                                                                                                                                             29
PRIVATE EQUITY                     PRIVATE CREDIT                    REAL ESTATE                 REAL ASSETS

                 PRIVATE EQUITY                     PRIVATE CREDIT                 REAL ESTATE                 REAL ASSETS

 Europe: the central bank pivot has begun, creating investment opportunity
                 Calling the bottom in the markets is challenging, but central bank interest rate cuts are a powerful signal.

  •              Rate cuts have historically contributed to a normalizing yield curve and improvement in private-led credit supply.
  •              The euro area and United Kingdom business cycles have been less pronounced than the United States, but face similar tradeoffs between high wages and tight credit conditions. The European Central
                 Bank (ECB) began cutting interest rates in June. As a result, and based on historical experience, we believe that a normalization in the yield curve and credit supply is soon to begin.

                                                                                                                                                                                                                  30
PRIVATE EQUITY                    PRIVATE CREDIT                    REAL ESTATE                 REAL ASSETS

                 PRIVATE EQUITY                    PRIVATE CREDIT                 REAL ESTATE                 REAL ASSETS

Europe: key themes for investing
                 Our investors are focusing on opportunities where disruption creates space for value-add.

                          Macro dynamics of recovery                                                                  Exploit equity and credit opportunities                       High conviction themes
                                                                                                                             as the cycle bottoms out

• Sticky inflation due to tight labor markets and less                                                           • Target secular themes where nominal cashflow        • Demographic-led change across all elements of
  global supply chain flexibility, shortages of critical                                                           growth will be most robust as early cycle plays       living, including hospitality
  materials, commodities and energy might slow
  speed of cuts                                                                                                  • Implies rotating into markets where demand may      • Re-globalization is driving even more demand for
                                                                                                                   significantly outrun supply                           logistics/light industrial and manufacturing
• Long term rates already coming down as
  economy has slowed and financial conditions                                                                    • Look to seize short-term opportunities in           • Innovation is ‘coming home’ – driving demand for
  should ease but 10-year yields might remain ‘high’                                                               markets where distress is visible, and forcing        data, life science and research and development
  by post-global financial crisis standards                                                                        creditors to act                                      (R&D) assets that meets new needs for power
                                                                                                                                                                         and/or security
• Modest improvement in volumes likely as the                                                                    • Debt and equity shortages may persist for some
  yield curve normalizes and supports credit supply                                                                time as many investors are distracted and may not   • The more visible impacts of clime change and
  and transaction flows will follow as unallocated                                                                 immediately move to plug the gap                      associated demand for energy efficiency are
  equity gets to work                                                                                                                                                    driving need for upgrades/improvements to meet
                                                                                                                                                                         net-zero carbon targets, impacting all sectors and
                                                                                                                                                                         major determinant of success in office

 Source: Opinions of Tristan Capital Partners, 2024.

                                                                                                                                                                                                                              31
PRIVATE EQUITY                              PRIVATE CREDIT                                    REAL ESTATE                                         REAL ASSETS

                 PRIVATE EQUITY                              PRIVATE CREDIT                                 REAL ESTATE                                          REAL ASSETS

 United States: price discovery is still pending
                 Higher interest rates have slowed transaction volumes, which has negatively impacted price discovery.

                 Quarterly transaction volume has stabilized at lower levels. We believe this dynamic                                                                                                                                          Valuations vary based on index methodology and may not yet reflect market
                    will persist until owners are forced to mark their assets to market and/or sell.                                                                                                                                                                        developments.

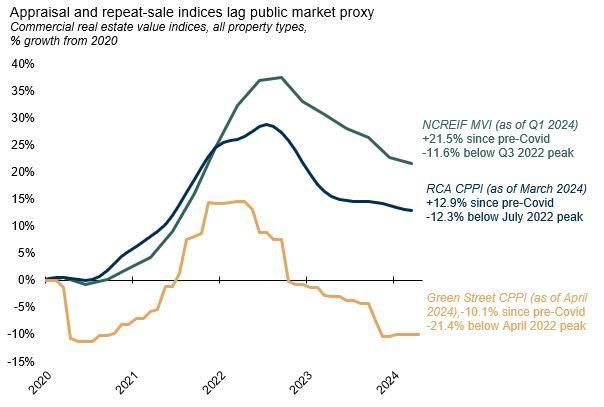
         Quarterly transaction volume declines further in Q1 2024                                                                                                                                                                    Appraisal and repeat-sale indices lag public market proxy
                                                                                                                                                                                                                                     Commercial real estate value indices, all property types,
                                                                              Retail                   Industrial                   Office                         Apartment                                                         % growth from 2020
                                                                                                                                                         $344                                                                        40%
                  $350
                                                                                                                                                                                            On an annualized
                                                                                                                                                                                              basis, current                         35%
                  $300                                                                                                                                                                    transactions are 15%
                                                                                                                                                                                                                                     30%
                                                                                                                                                                                          below 2023 levels and                                                                                                                           NCREIF MVI (as of Q1 2024)
                                                                                                                                                                                         60% below 2022 levels.                                                                                                                           +21.5% since pre-Covid
                  $250                                                                                                                                                                                                               25%
                                                                                                                                                                                                                                                                                                                                          -11.6% below Q3 2022 peak
                                                                                                                                                                         $203                                                        20%
                                                                                                                                          $196
                  $200                                                                                                                                                                                                                                                                                                                     RCA CPPI (as of March 2024)
                                                                                                                                                                 $175            $170                                                15%                                                                                                   +12.9% since pre-Covid
                                                             $157                                                  $152
                                 $143$149                 $143                                                                    $138                                                                                               10%
                                                                                                                                                                                                                                                                                                                                           -12.3% below July 2022 peak
                  $150                                 $128                                                                                                                              $129
                                                                $120
                         $108                                                                                                                                                                                                          5%
                                                    $98                                                                    $96
                  $100                                                                                                                                                                           $79 $81 $84 $78
                                                                                                            $68                                                                                                              $70       0%
                                                                                              $48                                                                                                                                                                                                                                          Green Street CPPI (as of April
                   $50                                                                                                                                                                                                                -5%                                                                                                  2024),-10.1% since pre-Covid
                                                                                                                                                                                                                                                                                                                                           -21.4% below April 2022 peak
                                                                                                                                                                                                                                    -10%
                   $-
                                                                                                                                                                                                                                    -15%
                          18Q2
                                  18Q3
                                         18Q4
                                                         19Q1
                                                                19Q2
                                                                       19Q3
                                                                               19Q4
                                                                                       20Q1
                                                                                              20Q2
                                                                                                            20Q3
                                                                                                                    20Q4
                                                                                                                           21Q1
                                                                                                                                   21Q2
                                                                                                                                           21Q3
                                                                                                                                                          21Q4
                                                                                                                                                                  22Q1
                                                                                                                                                                          22Q2
                                                                                                                                                                                  22Q3
                                                                                                                                                                                          22Q4
                                                                                                                                                                                                 23Q1
                                                                                                                                                                                                        23Q2
                                                                                                                                                                                                               24Q3
                                                                                                                                                                                                                      23Q4
                                                                                                                                                                                                                             24Q1

  Source: Strategy and Research Group of NYL Real Estate Investors, MSCI Real Assets, data available through Q1 2024.                                                                                                               Source: Strategy and Research Group of NYL Real Estate Investors , NCREIF Market Value Indices (MVI) quarterly data available through Q1 2024;
                                                                                                                                                                                                                                    MSCI Real Capital Analytics Commercial Property Price Index (CPPI) monthly data available through March 2024. Green Street Commercial Property
                                                                                                                                                                                                                                    Price Index (CPPI) monthly data available through April 2024.

                                                                                                                                                                                                                                                                                                                                                                                     32
PRIVATE EQUITY                    PRIVATE CREDIT                    REAL ESTATE                 REAL ASSETS

                 PRIVATE EQUITY                    PRIVATE CREDIT                 REAL ESTATE                 REAL ASSETS

 United States: regional banking risk has likely stabilized

 We are not as concerned with banking stability in the near
 term:
        • Commercial real estate (CRE) fears bleed into banking concerns, given small and
          mid-sized ($100M-$10B in assets) banks’ outsized exposure to CRE loans (chart).
        • Though we believe that portions of the CRE market will see meaningful valuation
          pressure, particularly under a recession scenario, we see this as a symptom in line
          with broad economic pressure, rather than a trigger of recession through the likes
          of a major banking crisis.

 This view has four prongs:
        • First, the CRE holdings of SMID U.S. banks – those outside of the 25 largest – are
          less concentrated than feared. SMID banks hold roughly a third of domestic CRE
          debt, less than the commonly believed 70%.
        • Second, other key CRE holders, including life insurers and government sponsored
          entities, may have enhanced risk management thanks to their equity capabilities,
          meaning they can potentially step in as subordinate capital providers where
          necessary.
        • Third, there is still dry powder in institutional portfolios to be put to work – about
          $280 billion, by New York Life Real Estate Investors’ internal estimates as of Q4
          2023.
        • Fourth, ongoing strength in consumer credit could potentially offset any liquidity
          strain in CRE, particularly for smaller, regional banks that have relatively small
          individual CRE loan balances relative to consumer credit.

                                                                                                                            33
You can also read