Geometric estimation of volcanic eruption column height from GOES-R near-limb imagery - Part 2: Case studies - Recent
←
→
Page content transcription
If your browser does not render page correctly, please read the page content below
Atmos. Chem. Phys., 21, 12207–12226, 2021
https://doi.org/10.5194/acp-21-12207-2021
© Author(s) 2021. This work is distributed under
the Creative Commons Attribution 4.0 License.

Geometric estimation of volcanic eruption column height from
GOES-R near-limb imagery – Part 2: Case studies
Ákos Horváth1 , Olga A. Girina2 , James L. Carr3 , Dong L. Wu4 , Alexey A. Bril5 , Alexey A. Mazurov5 ,
Dmitry V. Melnikov2 , Gholam Ali Hoshyaripour6 , and Stefan A. Buehler1
1 Meteorological   Institute, Universität Hamburg, Hamburg, Germany
2 Institute of Volcanology and Seismology, Far East Branch of the Russian Academy of Sciences (IVS FEB RAS),
Petropavlovsk-Kamchatsky, Russia
3 Carr Astronautics, Greenbelt, MD, USA
4 NASA Goddard Space Flight Center, Greenbelt, MD, USA
5 Space Research Institute of the Russian Academy of Sciences (SRI RAS), Moscow, Russia
6 Institute of Meteorology and Climate Research, Karlsruhe Institute of Technology (KIT), Karlsruhe, Germany

Correspondence: Ákos Horváth (akos.horvath@uni-hamburg.de, hfakos@gmail.com)

Received: 21 February 2021 – Discussion started: 23 March 2021
Revised: 2 July 2021 – Accepted: 6 July 2021 – Published: 16 August 2021

Abstract. In a companion paper (Horváth et al., 2021), we       side views of vertical columns protruding from the Earth
introduced a new technique to estimate volcanic eruption col-   ellipsoid and thereby facilitate a simple height-by-angle
umn height from extremely oblique near-limb geostationary       technique. In principle, the method can be applied to data
views. The current paper demonstrates and validates the tech-   from any geostationary instrument, but in practice it is best
nique in a number of recent eruptions, ranging from ones        suited to the latest-generation Advanced Baseline Imager
with weak columnar plumes to subplinian events with mas-        (ABI) aboard the Geostationary Operational Environmental
sive umbrella clouds and overshooting tops that penetrate       Satellite-R (GOES-R) series and the almost identical Ad-
the stratosphere. Due to its purely geometric nature, the new   vanced Himawari Imager (AHI) aboard the Himawari third-
method is shown to be unaffected by the limitations of the      generation satellites. The ABI and AHI provide currently the
traditional brightness temperature method, such as height un-   finest visible channel geostationary imagery (500 m resolu-
derestimation in subpixel and semitransparent plumes, am-       tion at the subsatellite point) and, in the case of the former,
biguous solutions near the tropopause temperature inversion,    best-in-class georegistration. Part 1 also included a prelimi-
or the lack of solutions in undercooled plumes. The side view   nary validation by using the proposed method to determine
height estimates were in good agreement with plume heights      the height of known Kamchatkan mountain peaks identified
derived from ground-based video and satellite stereo obser-     in GOES-17 images.
vations, suggesting they can be a useful complement to es-         In Part 2, we apply the side view height estimation to
tablished techniques.                                           seven volcanic eruptions from 2019 and 2020, which were
                                                                observed by GOES-17 near the limb of the full disk im-
                                                                age. Our goal is to further test the method and demonstrate
                                                                its strengths and limitations in a variety of cases that repre-
1   Introduction                                                sent a range of explosivity, plume morphology, and observ-
                                                                ing conditions. The side view plume heights are compared
In Part 1 (Horváth et al., 2021), we gave a detailed descrip-   with heights from the basic temperature method, GOES-17–
tion of our geometric method that exploits the near-limb        Himawari-8 stereo retrievals, and where available estimates
portion of daytime geostationary imagery to derive point        from ground-based video footage.
estimates of eruption column height in the vicinity of the
vent. Such oblique observations offer close-to-orthogonal

Published by Copernicus Publications on behalf of the European Geosciences Union.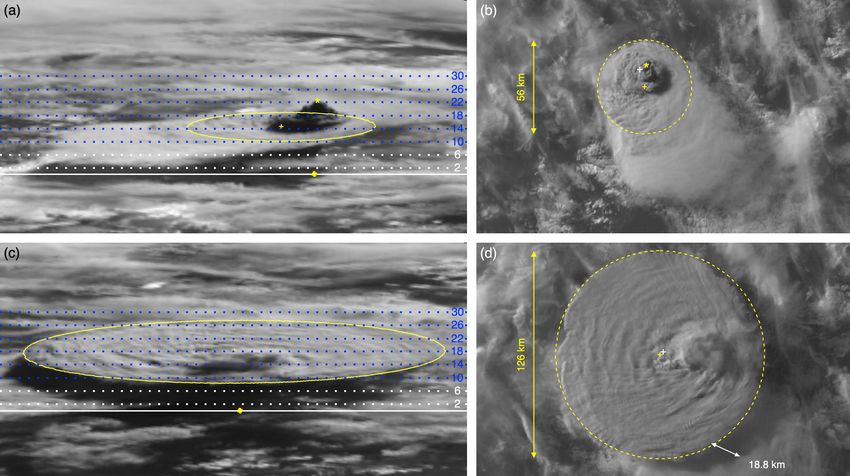
12208 Á. Horváth et al.: Geometric estimation of volcanic eruption column height – Part 2
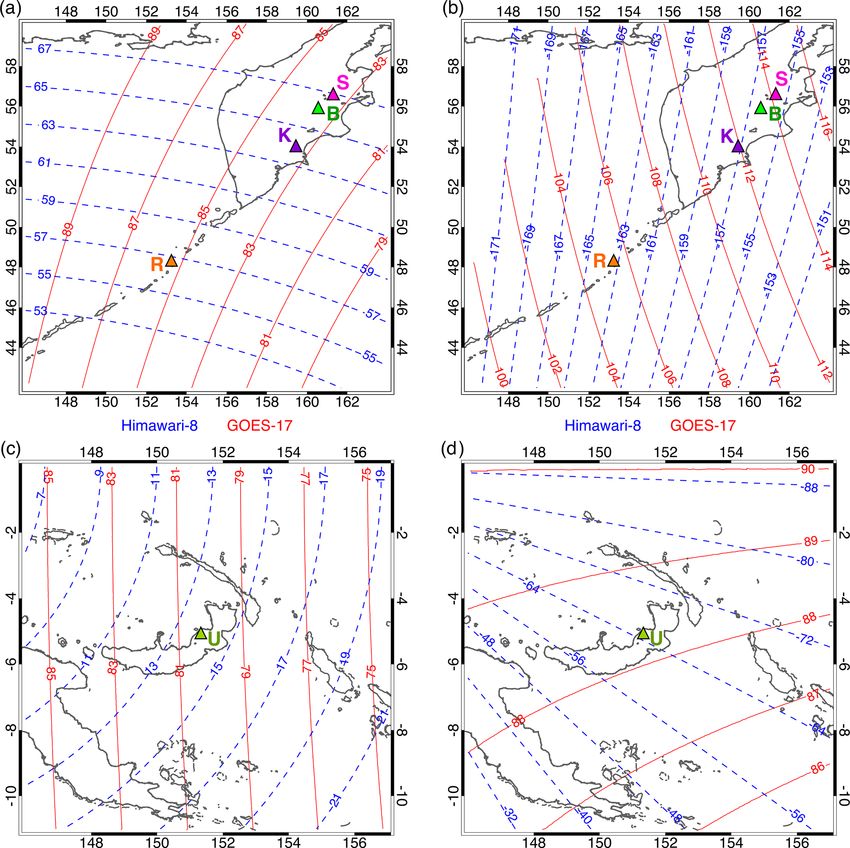
Figure 1. GOES-17 (solid red) and Himawari-8 (dashed blue) view geometry for our case study volcanoes (triangles). View zenith angle
for (a) Sheveluch (S), Bezymianny (B), Karymsky (K), and Raikoke (R), as well as (c) Ulawun (U). The corresponding view azimuth angle
measured clockwise from north (+) for GOES-17 and counterclockwise from north (−) for Himawari-8 is given in panels (b) and (d).
2 Notes on VolSatView and the GOES-17 loop heat perature profiles. The GOES-17 ABI unfortunately suffered
pipe anomaly a loop heat pipe (LHP) anomaly, which prevented cooling
the thermal focal plane to its operational temperature. After
Two technical points are worth mentioning about the tem- a number of performance recovery steps, 97 % of imaging
perature methods used for comparison. First, the VolSatView capability in the thermal infrared bands was regained (Mc-
information system (Bril et al., 2019; Girina et al., 2018; Corkel et al., 2019). To minimize any potential effects of the
Gordeev et al. 2016) operated by the Kamchatka Volcanic LHP anomaly on our results, we only use ABI brightness
Eruption Response Team (KVERT) derives plume heights temperatures with a data quality flag (DQF) of 0, indicating
from Himawari-8 11 µm brightness temperatures (BT11 ). “good pixels”.
The algorithm uses forecast profiles from the Historical
Unidata Internet Data Distribution (IDD) Gridded Model
Data archive, given at 1◦ spatial and 3 h temporal resolution. 3 Case studies
A temperature profile is interpolated to the geographic loca-
tion and acquisition time of a pixel, and then plume height We analyze eruption plumes from Sheveluch (also known
is set to the interpolated profile altitude whose temperature as Shiveluch), Bezymianny, and Karymsky in Kamchatka,
matches the measured BT11 . A standard atmosphere profile Raikoke in the Kuril Islands, and Ulawun in Papua New
can alternatively be selected for the retrievals, a choice of- Guinea, all located near the limb of the GOES-17 full disk
ten exercised to mitigate height underestimation in small thin image. The GOES-17 and Himawari-8 view geometries for
plumes. these volcanoes are plotted in Fig. 1. GOES-17 observes the
Second, we also estimate plume height by matching volcanoes in Kamchatka and the Kuril Islands from east-
Himawari-8 and GOES-17 dark pixel BT11 to ERA5 tem- southeast at very oblique view zenith angles (VZAs) of 83–
Atmos. Chem. Phys., 21, 12207–12226, 2021 https://doi.org/10.5194/acp-21-12207-2021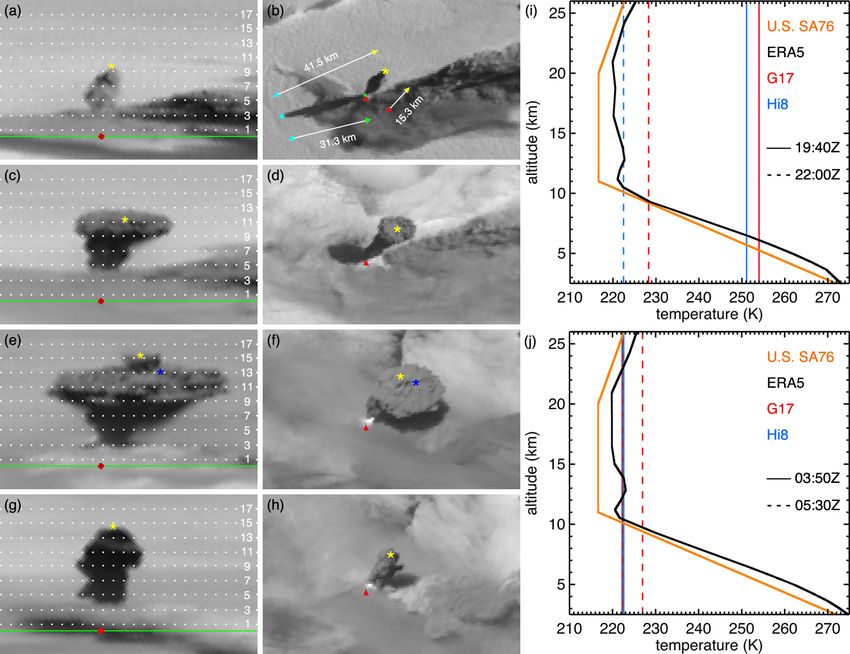
Á. Horváth et al.: Geometric estimation of volcanic eruption column height – Part 2 12209
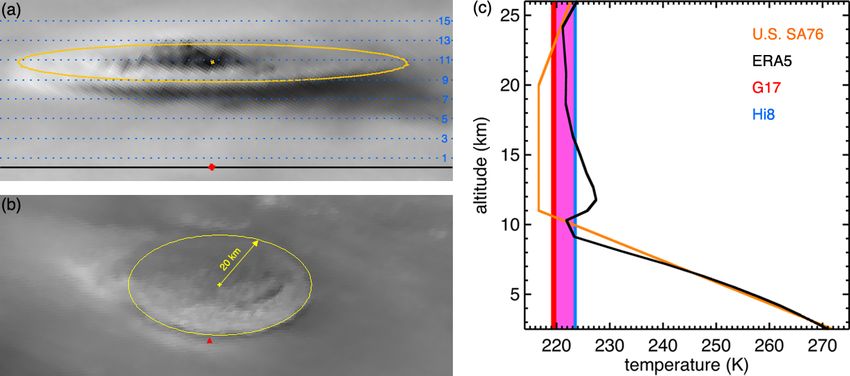
Figure 2. GOES-17 band 2 fixed grid image (8× magnification) of the 8 April 2020 eruption of Sheveluch at (a) 19:10 UTC, (b) 19:20 UTC,
(c) 19:30 UTC, and (d) 19:10 UTC with plume geometry indicated. The images were rotated clockwise by the geodetic colatitude angle; south
is left, north is right, west is up, and east is down. The red and black diamonds respectively mark the base and vent of Young Sheveluch. In
panel (d), the umbrella cloud is fitted with a circle of 5.9 km radius (distorted into an ellipse in the fixed grid view), and the blue diamond is
our best visual estimate plume top position above the vent.
86◦ , while Himawari-8 observes them from south-southwest plume from Klyuchevskoy, especially after 23:00 UTC, is
at much smaller VZAs of 57–67◦ . Ulawun, situated slightly also evident. The Himawari-8 fixed grid view is not dramat-
south of the Equator, is viewed almost exactly from the east ically different from the equirectangular map thanks to the
at a VZA of 80◦ by GOES-17 and from the northwest at a smaller view zenith angles and, hence, is excluded.
near-nadir VZA of 14◦ by Himawari-8. As shown, the plume was advected south-southeast by the
wind and eventually drifted over the ocean. The gradual tilt-
3.1 Sheveluch, 8 April 2020 ing of the plume and expansion of the umbrella cloud are
apparent in the 19:20–19:30 UTC fixed grid images, which
also hint at faint ash fallstreaks underneath the southern half
As briefly discussed in Part 1, an explosive eruption of the
of the umbrella cloud. The animation vividly demonstrates
volcano occurred on 8 April 2020 sometime between 19:00
the vastly different and complementary perspectives offered
and 19:10 UTC, slightly after sunrise (solar zenith angle
by GOES-17 and Himawari-8: the former observes the plume
∼ 84◦ ). The Kamchatka Volcanic Eruption Response Team
from the east-southeast (∼ 114◦ azimuth) at very oblique
(KVERT) issued an orange-coded Volcano Observatory No-
view zenith angle (VZA, ∼ 84◦ ), while the latter provides
tice for Aviation (VONA 2020-40, http://www.kscnet.ru/ivs/
a view from the south-southwest (about −156◦ azimuth) at
kvert/van/?n=2020-40, last access: 10 August 2021), report-
much smaller but still considerable VZA (∼ 67◦ ). For GOES-
ing a plume height of 9.5–10.0 km as determined by the basic
17 near-limb data the fixed grid image is a more natural
temperature method from Himawari-8 11 µm data. This erup-
and easier-to-interpret representation than equirectangular
tion is well suited to a detailed analysis, because it produced
remapping, which suffers from extreme zonal stretching. A
a single puff in a weak wind field, resulting in a nearly ver-
notable consequence of the different view geometries is that
tical eruption column with minimal bending and an isotrop-
the dispersing plume becomes semitransparent in Himawari-
ically spread umbrella cloud (strong plume). The GOES-17
8 images by the time it reaches the ocean, but it remains
visible band fixed grid images covering the eruption and the
opaque in GOES-17 images due to the longer slant path. The
initial evolution of the plume between 19:10–19:30 UTC are
GOES-17 fixed grid side view clearly shows the advecting
plotted in Fig. 2a–c, while the estimated eruption geome-
ash volume splitting into two vertically distinct layers due
try is sketched in Fig. 2d. The advection and dispersion of
to wind shear: a faster moving upper layer of the umbrella
the plume in the first 5 h after the eruption are depicted in
cloud and a slower moving lower layer that developed from
Supplement Animation 1, which shows the GOES-17 and
the “stem” of the initial mushroom cloud. The superior geo-
Himawari-8 images in equirectangular map projection as
well as the GOES-17 fixed grid view – degassing and a weak
https://doi.org/10.5194/acp-21-12207-2021 Atmos. Chem. Phys., 21, 12207–12226, 2021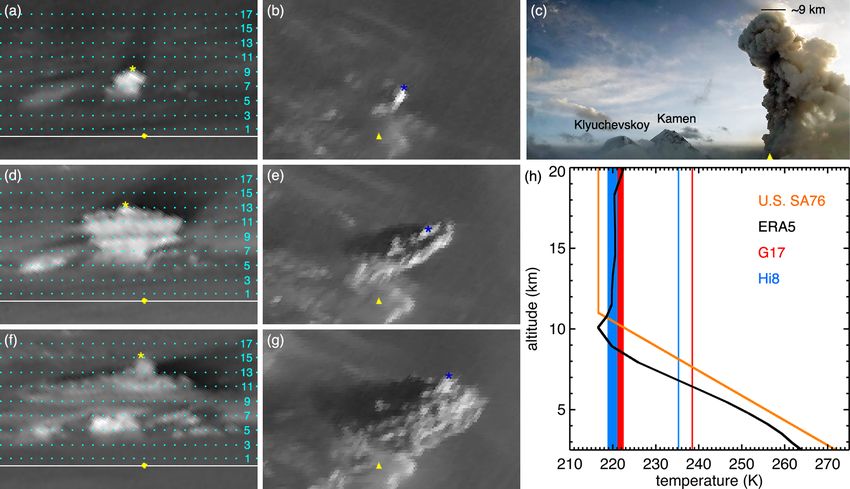
12210                                     Á. Horváth et al.: Geometric estimation of volcanic eruption column height – Part 2

Figure 3. Effect of shifting the plane of isoheights, illustrated on the 19:10 UTC GOES-17 band 2 image of the 8 April 2020 eruption of
Sheveluch. In all three panels the solid white line is the circular fit to the umbrella cloud from Fig. 2d, and the dashed white line is the
surface projection of that fit. The baseline (zero line) of the isoheights (red diamond and black line) is fixed to (a) the westernmost point of
the surface-projected fit, (b) the volcano base (default) or equivalently the center of the surface-projected fit, and (c) the easternmost point
of the surface-projected fit. Shifting the plane of the isoheights in panels (a) and (c) back and forth compared to panel (b) roughly accounts
for the westward/eastward expansion of the far side/near side of the umbrella cloud. With such base adjustments, the isoheights consistently
indicate an elevation of ∼ 8 km for the middle as well as the edges of the umbrella cloud.

registration of GOES-17 compared to Himawari-8 is also ap-                pansion as explained in Sect. 4.1 of Part 1. The latitudinal
parent in the time-lapse imagery.                                         (south–north or left–right) expansion/advection of the plume,
   The geometry of the plume at the time of the eruption is               in contrast, has little effect on the height estimates. The far-
sketched in Fig. 2d. As shown in Fig. 10d of Part 1 and also              side/near-side plume edge is located behind/in front of the
in Fig. 3 of the current paper, the side view method yields a             plane of isoheights drawn in Fig. 3b. These height biases due
plume height of ∼ 8 km above the ellipsoid and, thus, a col-              to the westward/eastward plume expansion can be roughly
umn height of ∼ 5.5 km above the vent. The umbrella cloud                 corrected for by shifting the isoheights plane accordingly, as
can be reasonably well fitted with a circle of ∼ 5.9 km ra-               demonstrated in Fig. 3a and c. Shifting the baseline (zero
dius, which appears distorted as a large eccentricity ellipse             line) to the westernmost (Fig. 3a) or easternmost (Fig. 3c)
near the limb of the fixed grid projection. The geographical              point of the surface projection of the circular plume top fit
coordinates of the fitted finite circle are calculated from the           (white dashed line) leads to height estimates of ∼ 8 km for
direct solution on the sphere as described by Bildirici and               the edges of the umbrella cloud too.
Ulugtekin (2011) and Bildirici (2015). Such geometry esti-                   The side view height estimate can be compared with es-
mates offered by the oblique side view might be useful in the             timates from traditional geometric methods (see Sect. 3 of
evaluation of plume simulations. For example, the radius-to-              Part 1), which are listed for the current and all subsequent
height aspect ratio of ∼ 1.07 determined for this plume is in             eruptions in Table 1. The GOES-17 and Himawari-8 visi-
good agreement with the ∼ 1.06 near-field aspect ratio ob-                ble band images at 19:10 UTC are plotted in equirectangu-
tained by Burton et al. (2020) in their idealized simulations             lar map projection in Fig. 4. The location of characteristic
of a buoyant gas plume in a quiescent atmosphere. The ERA5                features of the plume and its shadow, as well as the vec-
profiles show north-northwesterly winds that increase from 4              tors between these points, are also indicated. Compared to
to 9 m s−1 between the vent and the plume top. The aver-                  Himawari-8, the GOES-17 image of the low-level cloud layer
age plume rise speed is ∼ 9.2 m s−1 , although this likely is             is rather blurred and shows little detail due to the large near-
an underestimate because the plume reached its maximum                    limb GIFOV (ground-projected instantaneous field of view).
altitude in less than 10 min, as evidenced by the spread of               More detail and texture are seen in the image of the vertical
the umbrella cloud. Compared to the layer-mean wind of                    eruption column and the mountains thanks to the fine VI-
∼ 6.5 m s−1 this rise speed indicates a strong eruption; as a             FOV (vertically projected instantaneous field of view), but
result, the center of the plume was shifted south of the vent             the equirectangular remapping generally suffers from ex-
by only ∼ 2.5 km at 19:10 UTC.                                            treme zonal stretching near the limb. This zonal stretching
   The side view method requires the plume top position right             also leads to non-negligible azimuth distortions, which have
above the vent. Our visual estimate of this point is marked by            to be considered when measuring distances and directions
the blue diamond in Fig. 2d, which lies halfway between the               between points (see Sect. 3.5 in Part 1). For example, there is
far-side (western) and near-side (eastern) edges of the um-               a 10◦ /15◦ difference between the true and mapped view az-
brella cloud. When the isoheights are drawn relative to the               imuths for GOES-17/Himawari-8. The true solar azimuth is
volcano base (default), this plume location yields a height               close to east and thus has small (1–2◦ ) distortion.
estimate of ∼ 8 km, as shown in Fig. 3b. The far-side and                    Height can be estimated from the sensor-projected col-
near-side plume edges, however, appear at ∼ 9 and ∼ 7 km,                 umn length measured along the map distorted view azimuth
respectively, due to retrieval biases caused by the radial ex-            (method 1). The good alignment of the map projection of

Atmos. Chem. Phys., 21, 12207–12226, 2021                                                   https://doi.org/10.5194/acp-21-12207-2021
Á. Horváth et al.: Geometric estimation of volcanic eruption column height – Part 2                                                                 12211

Table 1. Case study plume height estimates, in kilometer and rounded to the nearest hectometer, derived from GOES-17 (G17) and Himawari-
8 (Hi8) satellite data or webcam/quadcopter footage. The retrieval methods are described in Part 1. The three traditional geometric methods
are as follows. Method 1 (M1): sensor-projected length, method 2 (M2): true (stick) shadow length, and method 3 (M3): edge shadow length;
method 3 can also be applied in “stereo mode” using the parallax between the GOES-17 and Himawari-8 image locations of a given plume
feature. Height is also estimated by matching the minimum 11 µm brightness temperature (BT11 ) to the ERA5 temperature profile; if the
reanalysis profile yields no solution due to plume undercooling (X), the height derived from the U.S. Standard Atmosphere 1976 temperature
profile is given instead in parenthesis. VolSatView (VSV) is the temperature method used by KVERT. The last column is the new geometric
side view estimate, obtained from GOES-17 fixed grid imagery.

                                                                                                                                                    Side
                                  M1        M1       M2       M2       M3        M3    M3 stereo         BT11          BT11     VSV     Webcam/     view
                                  G17       Hi8      G17      Hi8      G17       Hi8   G17–Hi8            G17           Hi8      Hi8   quadcopter   G17
 Sheveluch                         8.2       7.9     8.0a     8.3a     7.6a     7.8a         8.0           6.8     7.6, 11.0,    9.6                  8.0
 2020-04-08, 19:10Z                                                                                                     14.0
 Sheveluch                         7.1       6.9                                             7.0           4.6           4.5     6.5          7.0     7.2
 2019-04-10, 03:00Z
 Sheveluch                                                                                           X / (10.6)   X / (10.4)    10.5                 10.8
 2019-08-29, 03:10Z
 Sheveluch                         7.3       7.0                                             6.8           5.0           4.7     6.5      7.0–7.5     7.2
 2019-08-30, 08:00Z
 Karymsky                          6.8       7.0                                         6.9, 7.3          5.9           5.5     4.7      4.0-4.5     7.1
 2019-08-14, 04:30Z
 Bezymianny                        9.4       8.7                                             9.1           6.4           6.8     7.7          9.0     9.3
 2020-10-21, 20:30Z
 Bezymianny                       13.5     12.4                                             13.1      8.5, 19.7    8.9, 12.6    10.6                 13.2
 2020-10-21, 20:40Z
 Bezymianny                       15.7     15.5                                             15.2      8.6, 19.5    9.1, 11.2    10.7                 15.3
 2020-10-21, 20:50Z
 overshooting top
 Ulawun                           21.5                                                      21.3     16.1, 17.6      X / (X)                         22.3
 2019-06-26, 06:10Z
 overshooting top
 Ulawun                                                                                              16.4, 17.1   16.5, 16.9                         18.3
 2019-06-26, 07:00Z
 umbrella cloud
 Raikoke                           9.7     10.0               9.6b              9.8b        10.0           6.1           6.5     8.8                  9.9
 2019-06-21, 19:40Z
 Raikoke                                                                                    11.6           9.4    10.7, 12.2,   10.0                 11.3
 2019-06-21, 22:00Z                                                                                               13.7, 23.7
 Raikoke                                                                                    16.1    11.3, 14.7,      X / (X)    11.1                 16.5
 2019-06-22, 01:20Z                                                                                        22.5
 overshooting top
 Raikoke                                                                                    15.8    10.4, 12.2,   10.4, 12.5,   10.1                 15.6
 2019-06-22, 03:50Z                                                                                  14.1, 23.1   13.8, 23.4
 overshooting top
 Raikoke                                                                                    13.7    10.4, 12.2,   10.4, 12.5,   10.1                13.0–
 2019-06-22, 03:50Z                                                                                  14.1, 23.1   13.8, 23.4                         14.0
 umbrella cloud
 Raikoke                                                                                    14.6           9.7    10.4, 12.4    10.2                 14.5
 2019-06-22, 05:30Z                                                                                               13.4, 22.8
a Low-level CTH estimate of 1.2 km added. b Low-level CTH estimate of 0.7 km added.

https://doi.org/10.5194/acp-21-12207-2021                                                               Atmos. Chem. Phys., 21, 12207–12226, 2021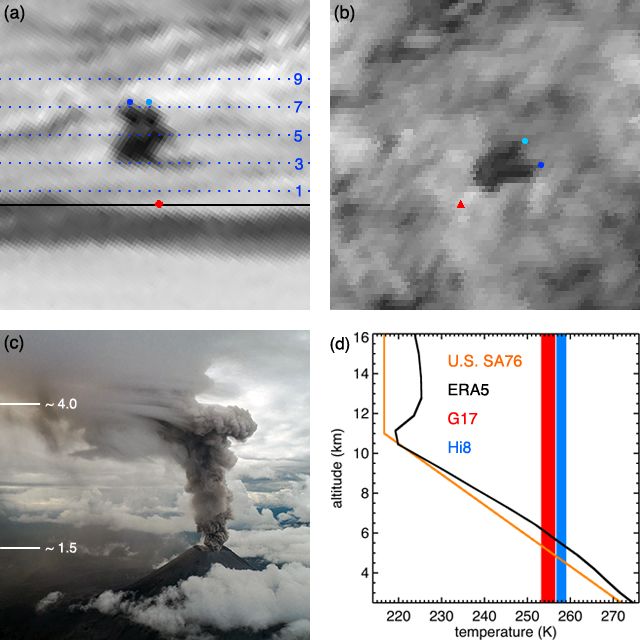
12212                                    Á. Horváth et al.: Geometric estimation of volcanic eruption column height – Part 2

Figure 4. Equirectangular map projection of the 19:10 UTC (a) GOES-17 band 2 and (b) Himawari-8 band 3 image of the 8 April 2020
eruption of Sheveluch. The red and black triangles mark the volcano base and the vent, respectively. The green dot indicates the start point
of the visible shadow, which for the Himawari-8 image is nearly the same as the vent location (thus, the black triangle is not shown in
panel b), while the yellow dot is the shadow terminus on the cloud layer. The yellow triangle is the estimated position of the shadow terminus
had it been cast directly on the surface without the intervening cloud layer. The blue and cyan dots respectively correspond to the center
and the westernmost edge of the umbrella cloud; the GOES-17 image location of the plume center is shown in the Himawari-8 image too.
Double-headed arrows indicate the ellipsoid-projected distance and direction between the points matching the color of the arrowheads. The
white arrow marks the shadow of the low-level cloud layer on which the eruption column casts its shadow. The true and map distorted view
azimuths at the volcano base (φ = 114◦ and φ = 104◦ for GOES-17, and φ = −156◦ and φ = −141◦ for Himawari-8) as well as the mapped
solar azimuth (φ = 86◦ , little distortion) are also indicated.

the eruption column with the distorted view azimuth direc-               lead to under- or overestimation, similar to the side view
tion indicates little tilting and advection relative to the vent.        method. These measured lengths combined with the corre-
The ellipsoid distance between the volcano base (red trian-              sponding view zenith angles lead to height estimates of ∼ 8.2
gle) and the plume center (or center of the fitted circle, blue          and ∼ 7.9 km.
dot) is respectively ∼ 75.7 and ∼ 18.8 km for GOES-17 and                   For the special case of a vertical column, height can
Himawari-8. Here the distance to the center of the umbrella              similarly be estimated from the true (stick) shadow length
cloud is needed, because taking plume edge points would                  (method 2), which, however, is a more challenging technique

Atmos. Chem. Phys., 21, 12207–12226, 2021                                                  https://doi.org/10.5194/acp-21-12207-2021
Á. Horváth et al.: Geometric estimation of volcanic eruption column height – Part 2                                        12213

in practice. Determining the exact location of the shadow ter-    cast on the cloud layer (yellow dot) in the direction opposite
minus can be difficult due to the blurring effect of the penum-   to the (map distorted) view azimuth by a distance of CTH
bra, the lighter outer part of the shadow where the sun disk is   times the tangent of the view zenith angle and then (ii) shift-
only partially blocked. For the GOES-17 near-limb view, this      ing this intermediate point in the solar azimuth direction by
is compounded by the large GIFOV and severe map distor-           a distance of CTH times the tangent of the solar zenith an-
tions. In this particular case, part of the true shadow is also   gle. This backward and forward projection roughly removes
obscured in the GOES-17 image by the eruption column it-          the cloud height parallax, which is responsible for the signif-
self, because the satellite is close to the principal plane and   icantly different image locations (yellow dots) of the cloud-
on the same side as the rising sun. Finally, the shadow of        top shadow end in GOES-17 and Himawari-8 data. The dis-
the eruption column is cast on a cloud layer rather than on       crepancy between the estimated clear-sky shadow end image
the surface and hence corresponds to height above the cloud.      locations (yellow triangles) is much smaller. Using the dis-
This, however, is a relatively minor nuisance, because ac-        tance between the yellow triangles and the volcano base in
counting for the height of a flat low-level cloud layer is no     Eq. (2) directly yields the height above the ellipsoid; in our
more error prone than the handling of the complex local to-       case a distance of ∼ 92.0 km results in a height estimate of
pography would be under clear-sky conditions.                     ∼ 8.2 km.
   The height of the cloud layer, which we assume constant           The edge shadow technique (method 3), which is the gen-
over the scene, can be estimated from the length (∼ 10.3 km)      eralization of the previous stick shadow technique to a hor-
and direction of its shadow. The cloud shadow is visible in       izontally extensive suspended ash layer, can also be used as
the Himawari-8 image (marked by the double-headed white           a separate estimate for a vertical eruption column. In this
arrow) but invisible from the particular sun-view geometry of     method, height is fixed by the length and direction of the
GOES-17. In order to avoid topography effects, we actually        line segment connecting the plume edge to the shadow ter-
measured the cloud edge shadow over the ocean, northeast          minus; for a suspended ash layer this line segment is the ap-
of the land shadow used for illustration in Fig. 4b. Applying     parent (observed) shadow, but for a narrow vertical column
method 3 to this edge shadow measurement yields a cloud           it actually runs through an unshadowed area (see Sect. 3.3
top height (CTH) of ∼ 1.2 km. The ERA5 profiles indicate          in Part 1). As shown in Fig. 4, the distance between the
a low-level temperature inversion over the ocean, between         westernmost edge point of the umbrella cloud (cyan dot) and
0.93 and 1.36 km. Considering that marine stratus tends to        the shadow terminus cast on the cloud layer (yellow dot) is
be located near the base of the temperature inversion and has     ∼ 37.6 km for GOES-17 and ∼ 80.0 km for Himawari-8. For
a typical thickness of 200–300 m, the CTH estimated by the        the sun-satellite geometry of the plotted images, these dis-
edge shadow method seems reasonable.                              tances respectively correspond to an above-cloud height of
   The start point and end point of the visible plume shadow      ∼ 6.4 and ∼ 6.6 km or an above-ellipsoid height of ∼ 7.6 and
are marked by the green and yellow dots, respectively. The        ∼ 7.8 km. As before, considering the line segment between
start point observed in the Himawari-8 image is the actual        the plume edge and the estimated clear-sky shadow end (cyan
shadow start point, i.e., the vent location, which leads to an    dot to yellow triangle) directly yields similar above-ellipsoid
observed (full) shadow length of ∼ 77.7 km. In contrast, the      height values, without the need to add the CTH.
beginning portion of the shadow (between the black triangle          Finally, method 3 can also be applied in “stereo mode”,
of the vent and the green dot in Fig. 4a) is obscured by the      using as input the GOES-17 and Himawari-8 image loca-
eruption column itself from the GOES-17 perspective, and          tions and sun-view geometry angles of the center of the um-
thus the observed shadow length is a shorter ∼ 68.5 km. The       brella cloud (blue dots in Fig. 4b). The ∼ 80.0 km parallax
distance between the vent and the shadow terminus (or de-         between these two sensor-projected locations is unaffected
duced shadow length), however, is ∼ 76.8 km in the GOES-          by the presence of the low-level cloud layer and translates to
17 image, similar to the one actually observed by Himawari-       an above-ellipsoid height of ∼ 8.0 km.
8. Plugging the Himawari-8-measured full shadow length               It is difficult to put exact error bars on these height esti-
and the corresponding solar zenith angle into Eq. (2) of Part 1   mates, but an uncertainty of a few hundred meters seems rea-
yields a plume height of ∼ 7.1 km above the cloud layer or,       sonable. The traditional geometric methods use the flat earth
by adding the CTH, a height of ∼ 8.3 km above the ellip-          approximation, which is usually justified by evoking that the
soid. Similarly, the full shadow length deduced from, but not     radius of earth is much greater than the length of the shadow
entirely observed in, GOES-17 data translates to an above-        or that of the map-projected image of the eruption column.
ellipsoid height of ∼ 8.0 km.                                     Over the horizontal distances measured in Fig. 4 (maxi-
   Here we note that the ellipsoid-projected location of the      mum ∼ 90 km), the GOES-17 view zenith angle and the solar
shadow terminus that would be observed under cloud-free           zenith angle can change by up to ∼ 0.7◦ due to earth’s curva-
conditions (and no surface topography) can be approximately       ture. Near a zenith angle of 84◦ , this change leads to a ∼ 12%
determined from the sun-satellite geometry and the estimated      change in the tangent function used to convert distance to
CTH. This clear-sky shadow end (marked by a yellow trian-         height. In our calculations, we used the average of the zenith
gle) can be obtained by (i) shifting the observed shadow end      angles at (i) the volcano base and (ii) the shadow terminus

https://doi.org/10.5194/acp-21-12207-2021                                       Atmos. Chem. Phys., 21, 12207–12226, 2021
12214                                   Á. Horváth et al.: Geometric estimation of volcanic eruption column height – Part 2

Figure 5. Band 14, 11.2 µm brightness temperature (BT11 ) image of the 8 April 2020 eruption of Sheveluch at 19:10 UTC from (a) GOES-17
fixed grid data and (b) Himawari-8 CEReS V20190123 gridded and resampled data (0.02◦ or ∼ 2 km resolution). The red triangle marks the
volcano base. In panel (c) the black line is the ERA5 temperature profile above the vent (2.5 km altitude). The red and blue shaded areas
respectively indicate the range of the GOES-17 and Himawari-8 minimum BT11 between 19:10 UTC (warmest dark pixel) and 19:50 UTC
(coldest dark pixel).

or sensor-projected plume top position, which is a first-order         crease in plume height and a reduced beam-filling error as the
correction for surface curvature. In fact, an advantage of the         plume expands, but the individual contributions of these two
side view method, which operates in angular space, is that             effects cannot be determined. Illustrating a common prob-
it avoids the non-linear sensitivity to the tangent function,          lem with the temperature method, the Himawari-8 minimum
which is a feature of the methods based on surface-projected           BT11 leads to multiple solutions because of the temperature
distances. The discussed difficulty in determining the shadow          inversion at the tropopause in the ERA5 profile. At the erup-
terminus, neglecting refraction effects on solar zenith angle,         tion time the dark pixel temperature matches the ERA5 data
and spatial variations in the height of the low-level cloud            at 7.6, 11.0, and 14.0 km, while later on there are two match-
layer represent additional uncertainties for the shadow-based          ing heights varying between 8.0–10.5 km. The VolSatView
estimates. Nevertheless, the height estimates from these al-           algorithm retrieves a height of ∼ 9.6 km at 19:10 UTC, close
ternative geometric techniques are consistent with the side            to the average of the two lowermost solutions. The warm-
view estimate and cluster around ∼ 8 ± 0.5 km.                         biased GOES-17 dark pixel temperature results in a single
   The GOES-17 and Himawari-8 band 14, 11 µm brightness                but low-biased height between 6.8–7.2 km. Overall, the low-
temperatures at the eruption time of 19:10 UTC are plotted             ermost temperature-based heights derived from Himawari-
in Fig. 5a and b. The thermal infrared channel has a reso-             8 data close to the eruption time are consistent with the
lution of ∼ 2 km at the subsatellite point. For the extensive          19:10 UTC geometric retrievals. A height of ∼ 8 km indi-
low-level cloud layer around the volcano, the GOES-17 BT11             cates a plume that did not penetrate the cold point tropopause
(252.1–253.1 K) is 3–4 K lower than the Himawari-8 BT11                (∼ 8.7 km), which is in accordance with the observed spread-
(255.6–256.6 K) due to limb cooling caused by the increased            ing of the umbrella cloud and the lack of overshooting tops.
optical pathlength of the absorbing atmosphere at oblique
view angles. For the ash plume, however, the temperature               3.2   Sheveluch, 10 April 2019
contrast between the satellites is the opposite: the GOES-17
minimum BT11 (“dark pixel”, 231.2 K) is 5.4 K higher than              An explosive eruption of the volcano occurred on 10 April
the Himawari-8 minimum value (225.8 K). From the oblique               2019 at 02:53 UTC with continuous ash removal until
side view perspective of GOES-17, the plume fills a smaller            04:25 UTC. KVERT issued an orange-coded VONA (2019-
fraction of the relatively large infrared pixels than from the         77, http://www.kscnet.ru/ivs/kvert/van/?n=2019-77, last ac-
less oblique Himawari-8 view point. The larger beam-filling            cess: 10 August 2021), reporting a plume height of 7.5–
(or subpixel ash cloud) error over the plume leads to a more           8.0 km at 03:13 UTC based on video surveillance. The
significant contamination of GOES-17 infrared data by the              GOES-17 and Himawari-8 visible imagery depicting the
warmer lower-level cloud layer.                                        plume’s evolution until 05:00 UTC are given in Supple-
   The plume heights corresponding to the dark pixel tem-              ment Animation 2 (SA 2). The corresponding ground-based
peratures between 19:10–19:50 UTC are shown in Fig. 5c.                video footage at 1 min cadence obtained from the webcam
For both satellites the minimum BT11 decreases by 3–4 K                located at the Levinson-Lessing Kamchatkan Volcanologi-
over this time period; however, the GOES-17 temperatures               cal Station in Klyuchi (yellow square in SA 2; 56.3167◦ N,
remain 5–6 K warmer than the Himawari-8 ones. The de-                  160.8333◦ E), ∼ 45 km southwest of Sheveluch, is given in
crease in BT11 is due likely to the combination of a slight in-        Supplement Animation 3. As shown, the eruption produced

Atmos. Chem. Phys., 21, 12207–12226, 2021                                               https://doi.org/10.5194/acp-21-12207-2021
Á. Horváth et al.: Geometric estimation of volcanic eruption column height – Part 2                                             12215

a weak bent plume without an umbrella cloud, which was
quickly advected south by strong northerly winds; the ERA5
wind speed increased from 6.1 m s−1 at the vent to a max-
imum of 19.5 m s−1 at an altitude of 8.7 km. Plume height
estimates obtained by the different geometric and tempera-
ture methods at the eruption time are summarized in Table 1.
   The GOES-17 fixed grid image at 03:00 UTC is plotted
in Fig. 6a with base-relative isoheights drawn. The height of
the bent plume right above the vent is ∼ 6 km. Because the
plume expanded perpendicular to the line of sight, the maxi-
mum plume height can be determined with little error using
plume top locations south of the vent. The plume top element
marked by the blue dot yields an altitude of ∼ 7.2 km. Iden-
tifying this plume top location in the equirectangular map
(see SA 2) leads to a projected column length of ∼ 66.0 km,
which results in a height of ∼ 7.1 km using method 1 with
the GOES-17 VZA.
   The Himawari-8 gridded and resampled image (CEReS
V20190123) is shown in Fig. 6b, with the volcano base and
the same plume top element also marked. In this case, a pro-
jected column length of ∼ 16.3 km corresponds to a height of       Figure 6. (a) GOES-17 band 2 fixed grid image (8× magnifica-
∼ 6.9 km using method 1 with the Himawari-8 VZA. Finally,          tion), (b) Himawari-8 band 3 CEReS V20190123 gridded and re-
the ellipsoid-projected parallax between the GOES-17 and           sampled image (0.005◦ or ∼ 0.5 km resolution, 3× magnification),
Himawari-8 plume top locations (blue dots) is ∼ 70.0 km,           and (c) Klyuchi webcam image of the 10 April 2019 eruption of
which translates to a height of ∼ 7.0 km using method 3            Sheveluch at 03:00 UTC. The red diamond/triangle marks the vol-
(shadow method in stereo mode).                                    cano base, and the blue dots indicate the same plume top element
   The Klyuchi webcam image of the plume at 03:00 UTC              in the satellite images. In panel (a), the baseline (solid black) and
is shown in Fig. 6c. The volcano and lower parts of the            the odd number isoheights (in km, dotted cyan) are also drawn.
plume were obscured by clouds from this vantage point.             In panel (c), the black triangle denotes the vent. Panel (d) shows
                                                                   the ERA5 temperature profile above the vent (black line), the U.S.
Webcam data are approximately calibrated by identifying in
                                                                   Standard Atmosphere 1976 temperature profile (orange line), the
cloud-free images the location of known features, such as
                                                                   GOES-17 and Himawari-8 minimum BT11 at 03:00 UTC (red and
degassing and incandescence on the Young Sheveluch lava            blue vertical lines), and the range of the minimum BT11 between
dome (∼ 2.5 km elevation, black triangle) and the peak of          03:10–04:00 UTC (red and blue shaded areas).
Old Sheveluch (∼ 3.3 km elevation), as well as by theodo-
lite measurements of further image points. Note that the
plume’s movement or bending along the line of sight intro-
duces height biases similar to those of the side view tech-        tween 03:10–04:00 UTC the GOES-17 and Himawari-8 min-
nique. The height reported in the VONA is based on expert          imum BT11 decreases from 236.4 to 231.0 K and from 231.2
analysis of video data from two cameras and tries to account       to 226.6 K, respectively (red and blue shading in Fig. 6d).
for the particulars of the eruption, such as bending of the col-   As before, the GOES-17 dark pixel temperatures are 4–5 K
umn. With this caveat in mind, expert analysis of the video        warmer than the Himawari-8 values, because of the com-
data yielded an estimate of ∼ 7 km for the plume top element       paratively larger beam-filling error in the oblique side view.
marked in Fig. 6c.                                                 These BT11 values correspond to plume heights between
   The plume heights derived from the dark pixel tempera-          6.2–6.9 km for GOES-17 and 6.9–7.5 km for Himawari-8.
tures between 03:00–04:00 UTC are shown in Fig. 6d. The               Using the U.S. Standard Atmosphere 1976 profile (ITU-R,
red and blue vertical lines near 245–246 K respectively in-        2017) instead of ERA5, which is an option in VolSatView,
dicate the GOES-17 and Himawari-8 minimum BT11 at                  results in heights that are ∼ 2 km higher, highlighting the
03:00 UTC. Due to the small size of the plume at that time,        sensitivity of the temperature method to the assumed atmo-
both brightness temperatures suffer from a large beam-filling      spheric profile. At 03:00 UTC this leads to a better agreement
error and are thus biased warm, leading to a height esti-          with the geometric estimates; later on, however, the derived
mate of ∼ 4.5 km that is significantly lower than the ge-          heights are considerable overestimates.
ometric height estimates. Ten minutes later, the GOES-17              In sum, the temperature-based plume height is a severe
and Himawari-8 minimum BT11 exhibits a large decrease              underestimate at eruption time, but it catches up with the
(by ∼ 9 and ∼ 15 K) thanks to a considerable reduction in          geometric heights, especially for Himawari-8, as the mag-
the beam-filling error over the rapidly expanding plume. Be-       nitude of the beam-filling error decreases with the spread-

https://doi.org/10.5194/acp-21-12207-2021                                         Atmos. Chem. Phys., 21, 12207–12226, 2021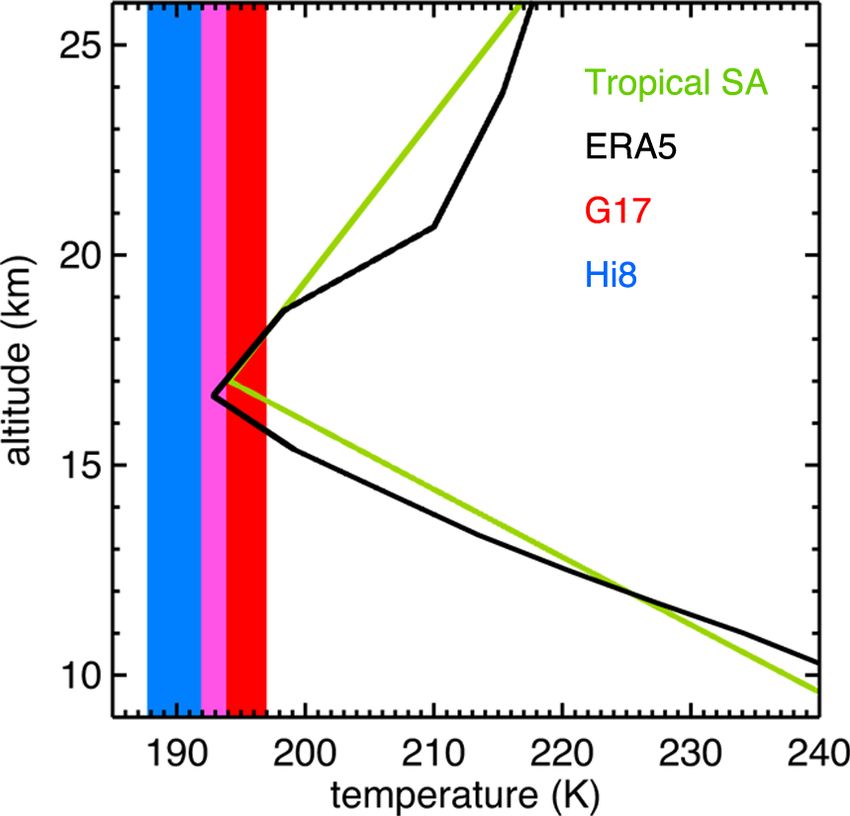
12216 Á. Horváth et al.: Geometric estimation of volcanic eruption column height – Part 2
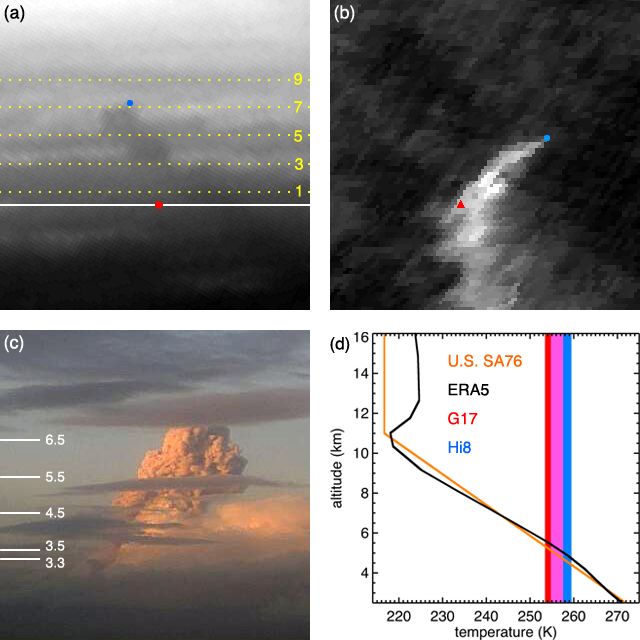
Figure 7. (a) GOES-17 band 2 fixed grid image (8× magnification) and (b) Himawari-8 band 3 CEReS V20190123 image of the 29 Au-
gust 2019 eruption of Sheveluch at 03:10 UTC. The red diamond/triangle marks the volcano base, and the solid yellow line is a circle of
20 km radius fitted to the umbrella cloud. In panel (a), the baseline (solid black) and the odd number isoheights (in km, dotted blue) are also
drawn. Panel (c) shows the ERA5 temperature profile (black line), the U.S. Standard Atmosphere 1976 temperature profile (orange line), and
the range of the GOES-17 and Himawari-8 minimum BT11 between 02:00–04:00 UTC (red and blue shaded areas, overlap in magenta).
ing of the plume. In general agreement with our results, is also apparent at this time. Later images show overshooting
Bril et al. (2019) also found temperature-based heights un- tops and, thus, individual explosions of diminishing magni-
derestimating stereo heights for small plume tops below the tude occurring until 04:30 UTC (see SA 4). The umbrella
tropopause temperature inversion. cloud keeps spreading at ∼ 11 km altitude with the clearly
visible propagation of circular shock waves and becomes
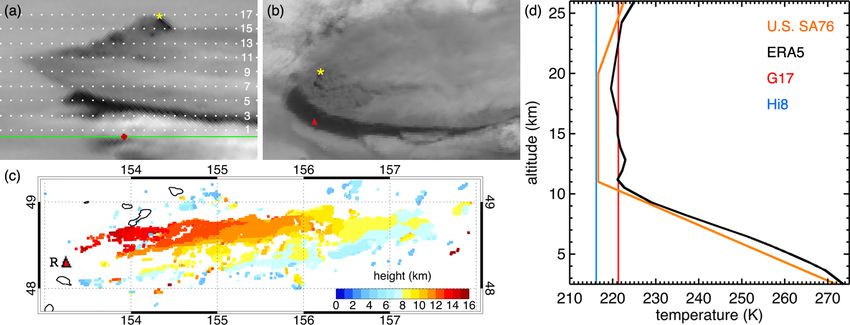
3.3 Sheveluch, 29–30 August 2019 increasingly elongated in the downwind northwesterly
direction. By 04:30 UTC the still circular upwind side of the
On 29 August 2019 the volcano showed prolonged eruptive anvil cloud expands to a radius of ∼ 50 km.
activity, which eventually resulted in a strong plume with a The variation of the minimum BT11 between 02:00–
large umbrella cloud. The GOES-17 and Himawari-8 visible 04:00 UTC and the ERA5 temperature profile at 03:00 UTC
imagery between 01:00–07:00 UTC are given in Supplement (which is representative of this time period) are plotted in
Animation 4 (SA 4). A high-level cloud layer at an altitude Fig. 7c. The beam-filling error (subpixel effect) is negligi-
of ∼ 8 km (7–9 km) obscured the satellite view of the vol- ble over the large umbrella cloud, and hence the GOES-
cano and the lower part of the eruption column, while low- 17 brightness temperatures (219.0–223.2 K) are 1–2 K lower
level clouds obscured the view of the entire plume from the than the Himawari-8 values (220.0–223.8 K) due to limb
Klyuchi webcam. Nevertheless, the satellite animation sug- cooling. The reanalysis profile shows a sharp inversion at the
gested explosions at least from 01:00 UTC. The rising erup- tropopause cold point of 221.9 K near an altitude of 10.3 km.
tion column pierced the high cloud layer at 01:50 UTC and As a result, the warmer end of the measured BT11 range leads
by 02:50 UTC started to flatten and spread out to form an to multiple height solutions: lower values between 9–11 km
umbrella cloud of rapidly increasing size. The ERA5 data and higher values in a wide range between 16–26 km. After
indicated northwesterly winds at lower levels and southeast- 02:40 UTC, however, the measured dark pixel temperatures
erly winds at higher levels, with wind speed increasing from indicate undercooling below the ERA5 cold point and thus
5 m s−1 at the vent to a maximum of 11.5 m s−1 at an altitude yield no height solution at all.
of 9.5 km. These dark pixel temperatures can technically be matched
KVERT issued an orange-coded VONA (2019-125, to an altitude if a standard model atmosphere with a colder
http://www.kscnet.ru/ivs/kvert/van/?n=2019-125, last tropopause is used instead, although such a model profile is a
access: 10 August 2021), reporting a plume height of less accurate representation of the actual temperature struc-
9.0–10.0 km at 03:10 UTC based on Himawari-8 brightness ture than ERA5. For example, considering the U.S. Stan-
temperatures. The corresponding GOES-17 fixed grid image dard Atmosphere 1976 used in VolSatView, the GOES-17
(with base-relative isoheights) and the Himawari-8 CEReS and Himawari-8 dark pixel temperatures at 03:10 UTC cor-
V20190123 image are shown in Fig. 7a and b. The umbrella respond to a plume height of ∼ 10.6 and ∼ 10.4 km, respec-
cloud can be fitted well with a circle of ∼ 20 km radius. tively, in apparently good agreement with the side view es-
Using the center of the circle as a representative plume timate of ∼ 10.8 km. Higher estimates (∼ 12.4 km) would be
top location yields a height of ∼ 10.8 km by the side view obtained using the midlatitude summer atmosphere, but the
method. An overshooting top at an altitude of 12.0–12.5 km
Atmos. Chem. Phys., 21, 12207–12226, 2021 https://doi.org/10.5194/acp-21-12207-2021Á. Horváth et al.: Geometric estimation of volcanic eruption column height – Part 2 12217
The contrast-enhanced GOES-17 fixed grid image is plot-
ted in Fig. 8a. The plume is close to the day–night terminator,
and GOES-17 views its shadowed eastern side. Nevertheless,
the shape of the ash column, bent perpendicular to the line of
sight, can be made out fairly well in the image. The plume
top element marked by the blue dot indicates an altitude of
∼ 7.2 km. Identifying this plume top feature in an equirect-
angular map (not shown) leads to a projected column length
of ∼ 67.8 km, which results in a height of ∼ 7.3 km using
method 1 with the GOES-17 VZA.
The contrast-enhanced Himawari-8 gridded image is
shown in Fig. 8b, with the volcano base and the same plume
top element also marked. The lighting conditions are more
favorable here, because the satellite observes the plume’s
western side illuminated by the setting sun. In this case,
a projected column length of ∼ 16.7 km corresponds to a
height of ∼ 7.0 km using method 1 with the Himawari-8
VZA. Finally, the ellipsoid-projected parallax between the
GOES-17 and Himawari-8 plume top locations (blue dots)
is ∼ 68.7 km, which translates to a height of ∼ 6.8 km using
method 3 (shadow method in stereo mode).
Figure 8. (a) GOES-17 band 2 fixed grid image (8× magnification, The corresponding Klyuchi webcam image of the plume
contrast enhanced), (b) Himawari-8 band 3 CEReS V20190123 im-
is shown with altitude markings in Fig. 8c. Analysis of
age (contrast enhanced), and (c) Klyuchi webcam image of the
30 August 2019 eruption of Sheveluch at 08:00 UTC. The red di-
the video data, considering the bending of the column and
amond/triangle marks the volcano base, and the blue dots indicate the partial obscuration of the plume top by meteorological
the same plume top element in the satellite images. In panel (a), the clouds, resulted in a height estimate of 7.0–7.5 km. In sum,
baseline (solid white) and the odd number isoheights (in km, dotted the satellite and ground-based geometric estimates are fairly
yellow) are also drawn. In panel (c), the white markings indicate consistent and indicate a plume height near 7 km.
height in kilometers. Panel (d) shows the ERA5 temperature pro- The dark pixel brightness temperatures between 08:00–
file (black line), the U.S. Standard Atmosphere 1976 temperature 09:00 UTC and the ERA5 temperature profile at 08:00 UTC
profile (orange line), and the range of the GOES-17 and Himawari- are plotted in Fig. 8d. The beam-filling error is generally sub-
8 minimum BT11 between 08:00–09:00 UTC (red and blue shaded stantial for this relatively small plume, but it has a larger
areas, overlap in magenta). effect on Himawari-8 BT11 than GOES-17 BT11 , because
the plume appears narrower from the former’s perspective
due to the combination of plume morphology and view ge-
putatively more appropriate subarctic summer atmosphere
ometry. As a result, the GOES-17 minimum BT11 (253.4–
with a tropopause at 225 K would result in plume undercool-
257.6 K) is 1–2 K colder than the Himawari-8 values (254.8–
ing and no height solution, similar to the ERA5 profile. Over-
259.5 K). These temperature ranges correspond to respective
all, this case demonstrates again the sensitivity of the temper-
height ranges of 5.0–5.6 km and 4.7–5.4 km with the ERA5
ature method to the assumed atmospheric profile.
profile. For reference, using the U.S. Standard Atmosphere
Another weaker explosion occurred on 30 August 2019 at
profile would lead to 0.3 km lower heights. These results
08:00 UTC, for which KVERT also issued an orange-coded
again demonstrate that the temperature-based height is a con-
VONA (2019-128, http://www.kscnet.ru/ivs/kvert/van/?n=
siderable underestimate for small and thin plumes. For an
2019-128, last access: 10 August 2021). This case is just be-
eruption with sustained and larger ash release, such as the
fore sunset and thus provides a good demonstration of the
10 April 2019 event, the temperature method can catch up
side view method in a low-light environment. The eruption
with the geometric estimates as the plume spreads and opti-
produced a weak plume without an umbrella cloud, which
cally thickens. This, however, is not the case for the current
was bent and then advected south-southeast by strong north-
short duration puff, whose plume quickly dispersed.
northwesterly winds; the ERA5 wind speed increased from
6 m s−1 at the vent to a maximum of 20 m s−1 at an altitude
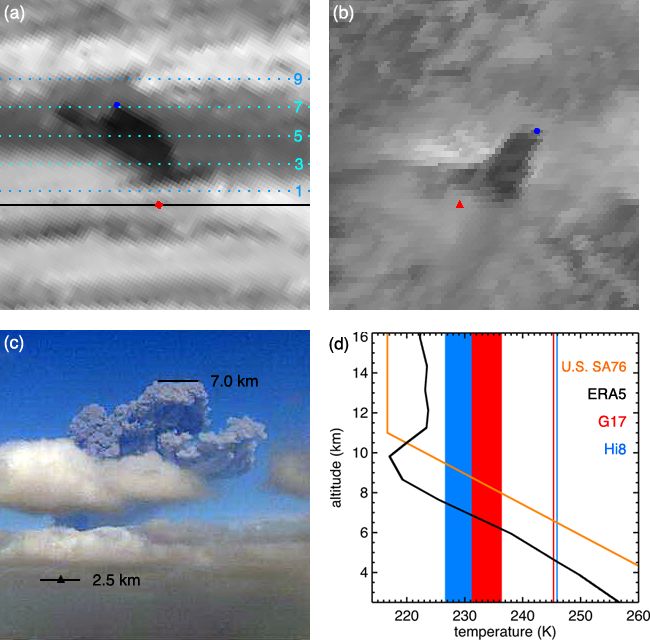
3.4 Karymsky, 14 August 2019
of 10.5 km. The plume is generally similar to the 10 April
2019 case (see Sect. 3.2 and Fig. 6). As before, height es-
The volcano erupted on 14 August 2019, shortly before
timates obtained by the various methods are summarized in
04:30 UTC. The GOES-17 and Himawari-8 visible imagery
Table 1.
between 04:00–06:00 UTC are plotted in Supplement Ani-
mation 5 (SA 5). The vicinity of the volcano is covered by
https://doi.org/10.5194/acp-21-12207-2021 Atmos. Chem. Phys., 21, 12207–12226, 202112218 Á. Horváth et al.: Geometric estimation of volcanic eruption column height – Part 2
a mid-level cloud layer at an altitude of 4.0–4.5 km, while
further inland Cu and Cb clouds are developing. In fact, at
05:40 UTC the GOES-17 fixed grid image (top left corner)
shows a textbook side view of a faraway thundercloud with
an overshooting top and anvil. At 04:30 UTC, the eruption
plume breaks through the mid-level clouds and quickly dissi-
pates without forming an umbrella. The ERA5 data indicate
a wind speed of 5 m s−1 at the vent and 8 m s−1 at an alti-
tude of 10 km, with north-northeasterly winds at lower lev-
els and west-northwesterly winds at higher levels. The plume
splits in two, with the upper main part advecting east and the
smaller lower part advecting south.
KVERT issued an orange-coded VONA (2019-116,
http://www.kscnet.ru/ivs/kvert/van/?n=2019-116, last
access: 10 August 2021), reporting a plume height of
4.0–4.5 km at 04:45 UTC based on visual data by nearby
volcanologists. The GOES-17 fixed grid image and the
Himawari-8 image at 04:30 UTC are shown in Fig. 9a
and b. Two plume top peaks can be clearly identified in the
satellite images, marked by the light and dark blue dots.
The side view technique indicates both peaks at an altitude
of ∼ 7.1 km. For the peak closer to the vent (light blue Figure 9. The 14 August 2019 eruption of Karymsky: (a) GOES-
17 band 2 fixed grid image (8× magnification) at 04:30 UTC,
dot, minimal bending), the projected length is ∼ 66.0 and
(b) Himawari-8 band 3 CEReS V20190123 image at 04:30 UTC,
∼ 14.5 km in the GOES-17 and Himawari-8 mapped image, and (c) quadcopter image at 04:45 UTC. The red diamond/triangle
respectively, which yields a height of ∼ 6.8 and ∼ 7.0 km marks the volcano base, while the light and dark blue dots indi-
using method 1. The ellipsoid-projected parallaxes between cate two identifiable plume top elements in the satellite images. In
the GOES-17 and Himawari-8 plume top locations are panel (a), the baseline (solid black) and the odd number isoheights
∼ 68.7 km (light blue dots) and ∼ 73.4 km (dark blue dots), (in km, dotted blue) are also drawn. In panel (c), the white markings
which translate to height values of ∼ 6.9 and ∼ 7.3 km using indicate height in kilometers. Panel (d) shows the ERA5 tempera-
stereo method 3. ture profile (black line), the U.S. Standard Atmosphere 1976 tem-
The photo of the lower part of the plume obtained by a perature profile (orange line), and the range of the GOES-17 and
quadcopter at 04:45 UTC is shown in Fig. 9c. Obviously, the Himawari-8 minimum BT11 between 04:30–05:30 UTC (red and
quadcopter image only captures the plume below the cloud blue shaded areas).
layer and hence provides a height underestimate. Consid-
ering that the summit of the volcano is at an elevation of
∼ 1.5 km, a rough visual estimate from the photo results in heights are biased low by at least 1 km, in line with our pre-
a plume height of 4.0–4.5 km, as reported in the VONA. vious findings for small and thin plumes.
The variation of the minimum BT11 between 04:00–
06:00 UTC and the ERA5 temperature profile at 05:00 UTC 3.5 Bezymianny, 21 October 2020
are plotted in Fig. 9d. Because the plume is small, the
brightness temperature is likely affected by substantial beam- A detailed description of this case is provided by Girina et
filling error for both satellites. However, while Himawari- al. (2020); here we focus only on the salient early features
8 observes the plume against the warmer background of of the eruption. KVERT issued red-coded VONAs (2020-
the mid-level cloud layer surrounding the volcano, GOES- 190, http://www.kscnet.ru/ivs/kvert/van/?n=2020-190, last
17 observes the plume partially against the background of access: 10 August 2021, and 2020-191, http://www.kscnet.
the convective clouds developing further inland in the west. ru/ivs/kvert/van/?n=2020-191, last access: 10 August 2021),
Combined with limb cooling, this leads to the GOES-17 reporting a plume height of 8.0–9.0 km based on video data
dark pixel BT11 (253.3–256.5 K) being 2–3 K colder than and Himawari-8 brightness temperatures. According to video
the Himawari-8 value (256.8–259.1 K). These temperature surveillance from the Kirishev seismic station, located 16 km
ranges correspond to respective height ranges of 5.7–6.2 and west-southwest of Bezymianny and operated by the Kam-
5.3–5.7 km using the ERA5 profile; the heights are ∼ 0.8 km chatka Branch of the Geophysical Survey of the Russian
lower when using the U.S. Standard Atmosphere profile in Academy of Sciences, the explosive eruption of the vol-
VolSatView. In sum, the geometric methods consistently in- cano started at 20:22 UTC, just around sunrise. The ground-
dicate a plume height of ∼ 7 km, while the temperature-based based video of the first 30 min of the eruption is available
at https://www.youtube.com/watch?v=LFOSJtGRON8 (last
Atmos. Chem. Phys., 21, 12207–12226, 2021 https://doi.org/10.5194/acp-21-12207-2021Á. Horváth et al.: Geometric estimation of volcanic eruption column height – Part 2 12219
Figure 10. The 21 October 2020 eruption of Bezymianny: GOES-17 band 2 fixed grid image (8× magnification) at (a) 20:30 UTC,
(d) 20:40 UTC, and (f) 20:50 UTC; the corresponding Himawari-8 band 3 CEReS V20190123 image at (b) 20:30 UTC, (e) 20:40 UTC,
and (g) 20:50 UTC; and (c) the webcam image from the Kirishev seismic station at 20:29 UTC. The yellow diamond/triangle marks the
volcano base, while the yellow and blue asterisks indicate the plume top in the satellite images. In panels (a), (d), and (f), the baseline (solid
white) and the odd number isoheights (in km, dotted cyan) are also drawn. Panel (h) shows the ERA5 temperature profile (black line), the
U.S. Standard Atmosphere 1976 temperature profile (orange line), the GOES-17 and Himawari-8 minimum BT11 at 20:30 UTC (red and
blue vertical lines), and the range of the minimum BT11 between 20:40–22:30 UTC (red and blue shaded areas).
access: 10 August 2021), while the GOES-17 and Himawari- the nearby Klyuchevskoy (∼ 4.8 km) and Kamen (∼ 4.6 km)
8 visible images between 20:00–23:00 UTC are given in Sup- volcanoes, is ∼ 9 km.
plement Animation 6. Note that the GOES-17 view (azimuth By 20:40 UTC (Fig. 10d and e), the column rises further
of 112◦ ) and the Himawari-8 view (azimuth of −156◦ ) are al- and starts to develop an umbrella, spreading out mostly in the
most exactly perpendicular to each other, resulting in a rather SW–NE direction. The side view method indicates a peak
different appearance of the early minimally expanded erup- height of ∼ 13.2 km. The projected lengths (∼ 133.5 and
tion column. At 20:50 UTC the overshooting top of the ash ∼ 28.4 km) yield height estimates of ∼ 13.5 and ∼ 12.4 km
column, which penetrated the stratosphere, is very promi- for GOES-17 and Himawari-8, respectively, while the paral-
nent in the GOES-17 side view but difficult to discern in lax (∼ 134 km) results in a top height of ∼ 13.1 km.
the Himawari-8 image. The plume eventually split into three At 20:50 UTC (Fig. 10f and g), the overshooting top of the
parts: the lowest part expanded towards north-northwest, a eruption column reaches its maximum altitude of ∼ 15.3 km
higher lobe advected south-southeast, and the highest part according to the side view technique. The height estimates
that directly originates from the overshooting top drifted east based on the projected lengths (∼ 158.5 and ∼ 35.7 km) are
due to relatively modest winds of 5–11 m s−1 . 15.7 and 15.5 km for GOES-17 and Himawari-8, respec-
The GOES-17 fixed grid image and the Himawari-8 im- tively, and the parallax (∼ 159.5 km) corresponds to a height
age at 20:30 UTC are shown in Fig. 10a and b, while the of ∼ 15.2 km.
Kirishev webcam image at 20:29 UTC is plotted in Fig. 10c The variation of the dark pixel BT11 between 20:30–
(by 20:30 UTC the plume top is out of frame). The plume 22:30 UTC and the ERA5 temperature profile at 21:00 UTC
top location is indicated by the yellow and blue asterisks are plotted in Fig. 10h. The GOES-17 brightness temper-
in the satellite images. The side view technique yields a atures are 2–3 K warmer than the Himawari-8 ones, due
peak height of ∼ 9.3 km. The projected length of the erup- likely to the differing interplay between plume morphol-
tion column is ∼ 89.6 and ∼ 19.8 km in the GOES-17 and ogy, view geometry, and the background against which the
Himawari-8 mapped image, respectively, which converts to a plume is observed. The red (238.5 K) and blue (235.3 K) ver-
height of ∼ 9.4 and ∼ 8.7 km using method 1. The ellipsoid- tical lines respectively indicate the GOES-17 and Himawari-
projected parallax between the GOES-17 and Himawari-8 8 minimum BT11 at 20:30 UTC. Because of the initially
plume top locations is ∼ 90.1 km, which translates to a height small size of the plume, these temperature values are bi-
of ∼ 9.1 km using stereo method 3. The plume height esti- ased warm, leading to low-biased height estimates of 6.4 and
mated from the webcam image, considering the elevation of 6.8 km with the ERA5 profile, or 7.7 and 8.1 km with the
U.S. Standard Atmosphere profile used by VolSatView. Ten
https://doi.org/10.5194/acp-21-12207-2021 Atmos. Chem. Phys., 21, 12207–12226, 202112220 Á. Horváth et al.: Geometric estimation of volcanic eruption column height – Part 2
minutes later, as the plume rapidly expands and the beam- 06:10 UTC; the corresponding GOES-17 and Himawari-8
filling error decreases, the BT11 drops by ∼ 15 K and re- images are plotted in Fig. 11a and b, respectively.
mains at values that correspond to dual height solutions fluc- The umbrella cloud of the pulses starting at 05:20 UTC
tuating within a wide range. The ERA5 temperature pro- can be fitted with a circle of ∼ 28 km radius at 06:10 UTC.
file is characterized by a cold point tropopause (216.6 K) The center of this fitted circle (yellow plus sign), located
at 10.1 km and a thick nearly isothermal (220–221 K) layer slightly southeast of the volcano, is at a height of 14.7 km,
between 11.0–20.0 km. As a result, the dark pixel BT11 af- while the highest point of the overshooting top (yellow aster-
ter 20:30 UTC yields below-tropopause heights between 8.5– isk) is at an altitude of ∼ 22.3 km, according to the side view
9.3 km and above-tropopause heights between 11.0–20.0 km. technique. The projected length of the overshooting peak is
VolSatView avoids the issue of multiple solutions, at the ex- ∼ 147.1 km in the GOES-17 mapped image, which yields a
pense of using a less accurate standard temperature profile, height of ∼ 21.5 km using method 1. The parallax between
and retrieves a plume height near ∼ 10.7 km. the GOES-17 and Himawari-8 overshooting top locations is
Overall, this case highlights again the good agreement be- ∼ 149.7 km, which translates to a height of ∼ 21.3 km using
tween the geometric methods but also the potential prob- method 3 in stereo mode.
lems affecting the temperature method: low-biased heights The bulk of the 06:10 UTC puff spreads out in a highly
for small and thin plumes as well as retrieval difficulties as- isotropic manner, forming a rapidly growing and almost
sociated with the tropopause temperature inversion and small perfectly circular umbrella cloud above the previous south-
lapse rates (multiple solutions, excessive uncertainty). wardly elongated ash layer. Note the outwardly propagat-
ing concentric gravity waves in the animation. As plotted
in Fig. 11c and d, the radius of the upper-level umbrella
3.6 Ulawun, 26 June 2019
increases to ∼ 63 km by 07:00 UTC (the radius eventually
reaches ∼ 95 km by sunset at 07:50 UTC). The center of
The volcano experienced a major subplinian eruption on the fitted circle, which is horizontally very close to the vol-
26 June 2019, which triggered an aviation warning with a cano indicating little advection, corresponds to an altitude of
red color code. Supplement Animation 7 shows the GOES- ∼ 18.3 km by the side view method. The shadow this upper-
17 and Himawari-8 visible images depicting the explosive level umbrella casts on the lower-level ash cloud is ∼ 18.8 km
activity between 04:00–07:50 UTC. Ulawun is observed by long in the azimuth direction of ∼ 115◦ (Fig. 11d), which re-
GOES-17 from almost exactly east (view azimuth of ∼ 88◦ ) sults in a ∼ 3.2 km height differential between the layers us-
at a view zenith angle of ∼ 80◦ (Fig. 1). Himawari-8, on the ing method 3. This shadow-based height difference estimate
other hand, observes the volcano from the northwest (view is consistent, within error bars, with the side view plume
azimuth of about −64◦ ) at a small view zenith angle of height estimates (∼ 14.7 and ∼ 18.3 km). The isotropic ex-
∼ 14◦ . Thanks to the nearly overhead view, the height par- pansion of the upper umbrella cloud at ∼ 18 km altitude is
allax is small in the Himawari-8 images. Also note that the aided by a local wind speed minimum (∼ 6.5 m s−1 ) at 17 km
equatorial location (5.05◦ S, 151.33◦ E) results in negligible altitude in the ERA5 data. Finally, there is an even higher
distortion in the mapped view and solar azimuth directions. plume element that directly originates from the overshooting
Explosions of varying strength and the peculiarities of the top. The eastward movement of this smaller ash mass and
wind profile produced a multilayer plume, the highest part its estimated height (∼ 22.3 km) are again consistent with the
of which penetrated the stratosphere. The first major pulse at ERA5 wind profile, which shows strong westerlies in the 19–
04:40 UTC attained an altitude of 14–15 km according to the 24 km altitude range with a maximum speed of ∼ 19.5 m s−1 .
side view method, with its plume spreading south-southeast The variation of the minimum BT11 between 05:50–
by north-northwesterly winds, which were present between 07:50 UTC and the representative ERA5 temperature profile
10–15 km and showed a local maximum (∼ 13.5 m s−1 ) at at 07:00 UTC are plotted in Fig. 12. The tropical standard at-
14 km altitude in the ERA5 profile. Note that this eruption mosphere profile (ITU-R, 2017) is also shown, which is close
column can be clearly seen in the GOES-17 oblique view to the reanalysis data up to an altitude of 19 km and thus leads
already at 04:40 UTC when its top has a radius of merely to similar derived heights. The GOES-17 dark pixel tempera-
5 km, but the plume is difficult to distinguish from the sur- tures (191.9–197.0 K) are 4–5 K warmer than the Himawari-
rounding meteorological clouds in the Himawari-8 overhead 8 values (187.7–193.8 K), despite limb cooling. A potential
view, where the plume only becomes apparent in subsequent reason for this temperature contrast is that the longest optical
images as its umbrella grows. path in the nearly overhead Himawari-8 view samples almost
Another series of pulses started at 05:20 UTC, which pro- the entire vertical extent of the tall eruption column, while the
duced overshooting tops between 16–18 km. The umbrella oblique GOES-17 side view only samples the shorter hori-
formed by these puffs is darker than that of the 04:40 UTC zontal cross section of the narrow column. Furthermore, the
puff, but it also expanded mostly to the south and at the same thickest plume core is observed against the background of
14–15 km level. The strongest pulse began at 06:00 UTC, the high and cold ash umbrella in the near-nadir Himawari-
and its overshooting top reached its maximum altitude at 8 image, but it is observed partially against the background
Atmos. Chem. Phys., 21, 12207–12226, 2021 https://doi.org/10.5194/acp-21-12207-2021You can also read