Geographically distinct blue whale song variants in the Northeast Pacific
←
→
Page content transcription
If your browser does not render page correctly, please read the page content below
Vol. 46: 19–33, 2021             ENDANGERED SPECIES RESEARCH
                                                                                                Published September 9
    https://doi.org/10.3354/esr01145            Endang Species Res

                                                                                                   OPEN
                                                                                                   ACCESS

     Geographically distinct blue whale song variants
                in the Northeast Pacific
Alexander Carbaugh-Rutland1,*, Jeppe Have Rasmussen1, Blair Sterba-Boatwright2,
                                 Ana Širović1
      1
    Department of Marine Biology, Texas A&M University at Galveston, 200 Seawolf Parkway, Galveston, TX 77554, USA
2
 College of Science and Engineering, Texas A&M University-Corpus Christi, 6300 Ocean Drive, Corpus Christi, TX 78412, USA

          ABSTRACT: The Northeast Pacific (NEP) population of blue whales Balaenoptera musculus mus-
          culus is currently managed as a single stock. We investigated the fine-scale frequency character-
          istics of 1 NEP blue whale song unit, the B call. We analyzed B calls from passive acoustic data col-
          lected between 2010 and 2013 at 2 low-latitude sites, Palmyra Atoll and the Hawaiian Islands, and
          3 higher-latitude sites, off southern California, off Washington state and in the Gulf of Alaska. Fre-
          quency measurements were extracted along the contour of the third harmonic from each call, and
          data from each region were compared. Calls from the Gulf of Alaska and Hawai‘i presented a
          downshift in frequency, beginning just past the midway point of the contour, which was not pres-
          ent in calls recorded from southern California or Palmyra Atoll. Calls from Washington displayed
          intermediate characteristics between those from the other 2 high-latitude sites. Cluster analysis
          resulted in consistent grouping of call contours from Washington and southern California, in what
          we termed the NEP B1 variant, while contours from Hawai‘i and the Gulf of Alaska were grouped
          together, as a NEP B2 variant. Frequency differences were also observed among the variants; the
          Gulf of Alaska displayed the highest frequency on average, followed by Washington, then south-
          ern California. Consistent with other studies, a yearly decline in the frequency of B calls was also
          observed. This discovery of at least 2 geographically distinct variants provides the first evidence
          of vocally distinct subpopulations within the NEP, indicating the possibility of a need for finer-
          scale population segmentation.

          KEY WORDS: Blue whales · Song variability · Population structure · Call frequency shift · Passive
          acoustic monitoring

                     1. INTRODUCTION                           (Marler 1970, Nottebohm 1972). However, much as
                                                               genetic variation often arises from the retention of
   In many vocal taxa, the production of repetitive            random errors in the genetic code, vocal dialects can
sequences of vocalizations, often referred to as song,         occur when birds, either mistakenly or via improvisa-
plays an important role in mate selection and repro-           tion, produce errors or variances in the population’s
duction (Searcy & Anderson 1986, Davidson &                    established song structure. Because birds are among
Wilkinson 2004, Holy & Guo 2005) and can therefore             the few known species of vocal learners (Nottebohm
have strong evolutionary consequences (Irwin et al.            1972, Jarvis 2006), these song variants can be copied
2001a,b). Songbirds are the best studied group when            by young males and retained within distinct commu-
it comes to function and structure of song, and for            nities. Furthermore, when male song is a driving fac-
them, song production is, at least partially, a learned        tor in female mate selection, the maintenance of
behavior mastered via the imitation of conspecifics            these dialects within distinct bird population group-
                                                               © The authors 2021. Open Access under Creative Commons by
*Corresponding author: alexc.rutland@gmail.com                 Attribution Licence. Use, distribution and reproduction are un-
                                                               restricted. Authors and original publication must be credited.
                                                               Publisher: Inter-Research · www.int-res.com
20 Endang Species Res 46: 19–33, 2021 ings can act as a prezygotic mating barrier and fur- majority of these animals were taken from the South- ther contribute to geographic separation and genetic ern Ocean, nearly all regions saw a dramatic decline isolation (Edwards et al. 2005). The ability to observe in their numbers (Clapham & Baker 2018). Conse- this geographic separation between populations of quently, blue whales were granted worldwide pro- terrestrial organisms such as birds has greatly con- tection from commercial whaling in 1966 by the tributed to our ability to understand the processes International Whaling Commission. Shortly after, in that drive the spread and retention of unique song 1970, they were listed as endangered in the USA. structures within and between species. Since receiving protections, efforts have been made In the marine environment, on the other hand, the to determine the status of blue whale populations geographic separation of populations is much harder and what impacts from human activities are still to visualize. Therefore, in the marine realm, instead present. The most recent estimates indicate between of observing geographic separation and investigat- 5000 and 15 000 individuals remaining globally ing the unique dialects found between communities, (Cooke 2018), of which approximately 2000 belong to we can study unique dialects observed in acoustic the Northeast Pacific (NEP) population (Monnahan & data and use this information to infer separation Branch 2015). However, due to the pelagic nature of among allopatric, as well as in sympatric, populations these animals, estimating recovery rates and under- (Barrett-Lennard et al. 1996, McDonald et al. 2006). standing population structure is challenging. Baleen whales are highly mobile vocal species whose Ship-based surveys are a traditional approach to populations can overlap in time and space, and their answering population-level questions. Unfortu- fully aquatic nature makes them logistically chal- nately, these surveys are limited to daylight hours lenging to study. However, it is well known that and good sea state conditions. Passive acoustic meth- baleen whales produce species-specific vocalizations ods, on the other hand, are operational under a (Clark 1990, Heimlich et al. 2005, McDonald et al. greater variety of conditions and may be an efficient 2006, Clark & Johnson 2011). Some baleen whales, tool for understanding population structure (McDon- like some species of birds, bats and elephants, are on ald et al. 2006). In addition, deploying long-duration the short list of vocal learners (Boughman 1998, Pep- passive acoustic recorders across multiple locations perberg 2002, Jarvis 2004, Poole et al. 2005). Hump- allows for a long-term investigation of the distribu- back whales Megaptera novaeangliae are a species tion, seasonality and changes in relative abundance with the best documented example of cultural song of these vocal marine mammals (Širović et al. 2004, transmission in baleen whales. For example, the 2015, Oleson et al. 2007, Samaran et al. 2013, Buchan movement of a small number of male humpback et al. 2014, Balcazar et al. 2015, Leroy et al. 2016, whale singers off Australia from one population to Barlow et al. 2018). another resulted in a dramatic change in the song Baleen whales produce 2 types of species-specific structure in their new population (Noad et al. 2000, sounds: songs and social calls (Edds-Walton 1997). Garland et al. 2017). Given the evolutionary conse- The songs and social calls of blue whales are gener- quences of song divergence observed in the terres- ally high-amplitude (approximately 175−190 dB re trial realm, it is worthwhile to study the degree of 1 μPa @ 1 m) and low-frequency (
Carbaugh-Rutland et al.: Northeast Pacific blue whale song variants                                  21

                 70                                                               70

                 60                                                               60

                 50                                                               50
Frequency (Hz)

                                                                 Frequency (Hz)
                 40                                                               40

                 30                                                               30

                 20                                                               20

                 10                                                               10

                  0                                                                0
                      5   10       15        20        25                               5        10       15        20       25
                                Time (s)                                                               Time (s)
    Fig. 1. Example spectrograms of the 2 B call variants (4000 point fast Fourier transform, 90% overlap, Hann window). The B1
    variant (left) was recorded in southern California, and the B2 variant (right) was recorded in the Gulf of Alaska. Note the
                     downstep in frequency in the B2 variant (beginning at ~19 s) and its absence in the B1 variant

    pulses (Rivers 1997, McDonald et al. 2001). The sec-                        NEP blue whales migrate between warm-water
    ond unit is a tonal B call, which is a long-duration                     winter breeding grounds in the eastern tropical
    (10+ s) call with a slightly downswept contour (Rivers                   Pacific (ETP) and cooler, nutrient-rich waters off the
    1997, McDonald et al. 2001). B units often contain a                     west coast of North America, where they feed (Mate
    gap in frequency approximately at two-thirds of the                      et al. 1999, Bailey et al. 2009, Szesciorka et al. 2020).
    duration (Fig. 1). Broken units such as this are not un-                 Long-term acoustic data have shown B call detec-
    common in blue whale populations, and Berchok et                         tions peak in the ETP between January and May,
    al. (2006) demonstrated these breaks are likely con-                     during the Northern Hemisphere winter and spring,
    trolled by the whale itself and thus may help in con-                    and decline between June and November, during
    veying information. B calls generally have their high-                   the Northern Hemisphere summer and fall (Stafford
    est received signal-to-noise ratio in the third                          et al. 1999a). Furthermore, in the Gulf of California,
    harmonic, which has shown a consistent linear de-                        another possible breeding area, songs and AB singu-
    cline at a rate of about 0.4 Hz per year, dating back to                 lar calls also occur at their highest rates in the winter,
    the 1960s (McDonald et al. 2009). Phrasing of A and                      between December and February, after which the
    B units can vary, and 2 song variants have been de-                      detection rates decrease until March (Paniagua-
    scribed to date: AB song, in which A and B units                         Mendoza et al. 2017). The presence of NEP B calls in
    alternate regularly, and ABB song, in which 1 A unit                     the central Pacific has not previously been examined
    is followed by multiple B units before the A unit is                     in detail. In the cooler and more productive waters
    repeated again (Lewis & Širović 2018).                                   off southern California, B call rates peak in the sum-
      NEP blue whales also produce A and B calls in                          mer and fall, between August and November (Širović
    non-song context. Singular A and B calls are struc-                      et al. 2015). In the Gulf of Alaska, visual observations
    turally similar to the AB song units, but they do not                    of blue whales have been exceptionally rare since
    occur in repetitive phrases. While these singular calls                  the cessation of whaling (Stafford 2003, Calambo-
    are also only known to be produced by males, they                        kidis et al. 2009). However, acoustic evidence sup-
    contrast AB songs in that they have been recorded                        ports a summer−fall peak in calling here as well, with
    from males in close proximity to other whales, sug-                      peak B call occurrence falling between September
    gesting they may play a role in short-distance com-                      and October, and indicates a potential return of blue
    munication as well as reproduction (Oleson et al.                        whales to their pre-whaling migratory range (Calam-
    2007). We use the term B call in this manuscript when                    bokidis et al. 2009, Rice et al. 2021). Combined with
    we are not explicitly considering the behavioral con-                    tagging studies, these acoustic records strongly sup-
    text of its production and B unit when specifically                      port the seasonal movement of the NEP blue whales
    referring to the song structure.                                         between warmer waters, where they are found dur-
22 Endang Species Res 46: 19–33, 2021
ing winter and spring months, and cooler, more pro- and Palmyra Atoll (Fig. 2). These are bottom-moored
ductive high-latitude waters, where they occur in the acoustic recording systems that contain a hydro-
summer and fall months (Mate et al. 1999, Bailey et phone typically suspended 10 m off the seafloor, an
al. 2009, Irvine et al. 2014). However, any fine-scale acoustic release system for instrument retrieval, a
structure in population and movements within the data logger for data acquisition and batteries en-
NEP remain unknown. abling long duration of recording (Wiggins & Hilde-
Therefore, we investigated the fine-scale frequency brand 2007). With the exception of one deployment
characteristics of NEP blue whale B calls recorded at in the Gulf of Alaska, all HARP deployments sam-
high- and low-latitude locations, using an archive of pled continuously (Table 1). For analysis, these data
passive acoustic data collected from 2010 until 2013, were decimated by a factor of 100, which led to an
to evaluate the possibility of geographically distinct effective bandwidth of 10 to 1000 Hz from all sites,
groups and their differential use of feeding and with the exception of one deployment in southern
breeding areas within the North Pacific. California which had a higher sample rate and
resulted in an effective bandwidth of 10 Hz to
3.2 kHz (Table 1). Data from Hawai‘i were collected
2. MATERIALS AND METHODS via University of Hawaii’s ALOHA Cabled Observa-
tory (ACO), a deep-sea multi-purpose observatory
Passive acoustic data were collected using 2 re- that has continuously collected passive acoustic data
cording systems. High-frequency acoustic recording since 2011 (Fig. 2). ACO data were collected at a
packages (HARPs) were used to collect data from sample rate of 24 kHz and were decimated by a fac-
southern California, Washington, the Gulf of Alaska tor of 12, which produced data with a Nyquist fre-
quency of 1 kHz (Table 1). Long-term
165° 150° 135° 120°W spectral averages (LTSAs) were calcu-
60°N
lated from downsampled data by cal-
culating 5 s averaged spectra with a
(Site 1) frequency resolution of 1 Hz.
(Site 2)
Gulf of Alaska
4214 2.1. Call selection
7877
Times with NEP blue whale B calls
Washington
were manually identified using
45° NORTH PACIFIC OCEAN LTSAs, and calls were sampled from
3728 long-term acoustic data collected be-
5355 tween 2010 and 2013 (Table 2). LTSAs
5184 were reviewed with a window size of
N o r t h e a s t P a c i f ic
1 h, and days were selected for sam-
Basin
Southern California pling based on the abundance of B
5634
30° 4372 4325 calls with a strong signal-to-noise
ratio. Data from Hawai‘i were avail-
5252 able from 2011 to 2013 and were
Hawai‘i reviewed during expected months of
4627
peak occurrence: October to Febru-
ary. To the maximum extent practica-
15° 5674 5376
3288 ble, we conducted call contour extrac-
5739 tion from at least 5 d per month at
each site. To avoid over-representing
Palmyra Atoll
4606 any single animal in the study, back-
to-back days were not sampled when-
0°
0 325 650 1300 1950 2600
ever possible, and all calls sampled
Kilometers Esri, Garmin, GEBCO, NOAA NGDC, and other contributors
within 1 d were averaged; the daily
Fig. 2. Eastern North Pacific Ocean, showing the 6 data collection locations averaged values were used in all sub-
(black circles). Depths shown are in meters sequent analyses.Carbaugh-Rutland et al.: Northeast Pacific blue whale song variants 23
Table 1. Details of sampling effort conducted for each site. High-frequency acoustic recording package deployment locations
(latitude and longitude), sample rate and duty cycle shown as interval/recording duration if sampling was not continuous are
shown. Months sampled: months during which data were reviewed to find high-quality B calls; no. of days sampled: number
of days during which contour extraction occurred; no. of contours: total number of contours extracted during that season
Site Latitude Longitude Depth Sample rate Duty cycle Season Months No. of No. of
(N) (W) (m) (kHz) (min) sampled days sampled contours
Gulf of 58° 38.741’ 148° 04.129’ 1000 200 Continuous 2011−2012 Aug−Nov 15 82
Alaska 56° 14.607’ 142° 45.439’ 989 200 12/10 2012−2013 Sep−Nov 15 128
56° 14.607’ 142° 45.439’ 987 200 Continuous 2013−2014 Sep−Nov 14 181
Total 44 391
Washington 47° 30.026’ 125° 21.212’ 1394 200 Continuous 2011−2012 Dec−Jan 10 134
47° 30.032’ 125° 21.215’ 1394 200 Continuous 2012−2013 Sep−Feb 26 330
Total 36 464
Southern 32° 50.552’ 119° 10.254’ 1004 200 Continuous 2010−2011 Jul−Nov 22 215
California 32° 50.537’ 119° 10.217’ 1008 200 Continuous 2011−2012 Jul−Jan 27 292
32° 50.806’ 119° 10.575’ 1006 200 Continuous 2012−2013 Aug−Dec 25 300
32° 50.307’ 119° 10.006’ 1003 200 Continuous 2013−2014 Jul−Dec 29 395
Total 103 1202
Hawai‘i 22° 45.000’ 158° 00.000’ 4728 24 Continuous 2011−2012 Dec 2 54
22° 45.000’ 158° 00.000’ 4728 24 Continuous 2012−2013 Jan 2 36
Total 4 90
Palmyra 05° 53.705’ 162° 02.240’ 700 200 Continuous 2010−2011 Jun−Dec 36 102
Atoll Grand total 223 2249
2.2. Call contour extraction LAB-based graphical user interface. For each site and
year, an amplitude threshold roughly equivalent to
We extracted the frequency contour of each se- the background noise level was determined empiri-
lected call using the following protocol. First, a spec- cally. Frequency contours were plotted one at a time,
trogram for the call of interest was plotted in the and frequency measurements along the contour with
MATLAB-based software TRITON (Wiggins et al. a corresponding amplitude value below the empirical
2010). B calls from southern California had particu- threshold were removed and replaced with NaN (Not
larly strong signal strengths, and therefore spectro- a Number) values, to not affect the duration of the
grams from this site could be created with a 0.25 Hz contour. If, after the removal of these data points, a
frequency resolution. Spectrograms of data from all contour was still largely complete, it was saved for
other sites were created with a 0.5 Hz frequency reso- later analyses. If too much of the contour was missing
lution. The resulting time resolutions (time steps) in (approximately 25% of the duration), the entire con-
the contour measurements were 0.4 s for southern tour was removed from the dataset.
California and 0.2 s for all other sites. Next, using Once all the calls from a given site were measured
custom-made MATLAB software, we outlined the and cleaned, daily averaged contours were calcu-
boundaries of each call, and the following features lated to avoid over-representing any individual ani-
were automatically extracted from within the box: mal in this study. In addition, monthly and annual
absolute time at the start of measurement, as well as site-averaged contours were generated and plotted
peak amplitude and frequency at peak amplitude at for visual comparison of B call structure across sites
each time step, and relative time of that step along the and years.
length of the call. Extracted contours thus consisted of
a frequency measurement every 0.4 s (southern Cali-
fornia) or 0.2 s (all other sites), along the duration of a 2.3. Statistical analyses
call, and the corresponding amplitude values for
those frequency measurements. All work was done Tests were conducted to evaluate whether B call
using MATLAB version 9.4.0.813654 (2018a). contours could be grouped by site according to their
Upon completion of contour extraction for each site, contour structure and frequency characteristics. The
amplitudes extracted from each call were reviewed first step was to quantify contour structure. This was
for signal strength using another custom-built MAT- done by extracting 10 representative measurements24 Endang Species Res 46: 19–33, 2021
from each daily averaged contour. These measure-
Table 2. Recording times at the 6 deployment locations. Grey shading: data available; no fill: no data collected. HARP: high-frequency acoustic recording package
J F M A M J J A S O N D J F M A M J J A S O N D J F M A M J J A S O N D J F M A M J J A S O N D
ments included the peak frequency as well as fre-
quency measurements in 3 s intervals following the
peak frequency, up to 15 s after the peak. Also in-
cluded was a measurement of the slope between the
2 and 4 s mark of each contour. Finally, to quantify
2013
the downstep in frequency, the difference in fre-
quency between a point just prior to and just after the
downstep in frequency was calculated.
Cluster analyses were conducted on these features
using 2 approaches: k-means clustering and Krus-
kal’s non-metric multidimensional scaling (NMS).
We used 2 independent clustering approaches to fur-
ther ensure consistency of the results of each analy-
sis. K-means clustering requires that the number of
clusters (k) be stated prior to analysis. Three inde-
pendent methods were used to determine what
2012
k-value should be used: the gap statistic (Tibshirani
et al. 2001), k-means partitioning using a range of
values of k (Calinski & Harabasz 1974) and selection
of k in k-means clustering based on Pham et al.
(2004). These tests were conducted in R (version
3.5.1) (R Core Team 2021) using, respectively, clus-
Gap in the cluster package (Maechler et al. 2021),
cascadeKM in the vegan package (Oksanen et al.
2019) and kselection in the kselection package
(Rodriguez 2015). All 3 methods suggested using 2
clusters for the 2011−2012 data, and therefore this
2011
was the number of clusters selected for that analysis.
On the other hand, the appropriate number of clus-
ters for the 2012−2013 data was either 2 or 3; thus, we
conducted analyses using both values. Clustering
analyses were completed using the kmeans com-
mand in the stats package (R Core Team 2021) for k-
means and the isoMDS command in the MASS pack-
age (Venables & Ripley 2002) for Kruskal’s NMS.
Cluster analyses were not conducted for the 2010−
2011 and 2013−2014 seasons, which only had data
available from 2 sites. This resulted in the exclusion
2010
of Palmyra Atoll data from cluster analyses.
As the final step of comparing the data across the
recording sites, we wanted to determine if the 0.4 Hz
annual decrease in the third harmonic frequency ob-
served by McDonald et al. (2009) is still observed in
the region. To accomplish this, we fitted linear mod-
els to data using simple linear regression. The ana-
Gulf of Alaska, Site 1
Gulf of Alaska, Site 2
Southern California
lysis was conducted using a single frequency meas-
urement at the point 6 s after the time of peak
HARP location
Palmyra Atoll
frequency from all daily averaged contours. This spe-
Washington
cific time step was selected because it falls within the
Hawai‘i
Month
region where the slope of the B call contour is the
least steep. Therefore, selecting a point within this
region ensured consistency in the measurements de-Carbaugh-Rutland et al.: Northeast Pacific blue whale song variants 25
49 2010–2011 52 2011–2012
Palmyra Atoll Gulf of Alaska
48 Southern California Hawai‘i
50 Southern California
47
Frequency (Hz)
Frequency (Hz)
Washington
46 48
45 46
44
44
43
42 42
0 5 10 15 20 25 0 5 10 15 20 25
Time (s) Time (s)
49 2012–2013 49 2013–2014
Gulf of Alaska Gulf of Alaska
48 Hawai‘i 48 Southern California
Southern California
Frequency (Hz)
Frequency (Hz)
47 Washington 47
46 46
45 45
44 44
43 43
42 42
0 5 10 15 20 25 0 5 10 15 20 25
Time (s) Time (s)
Fig. 3. Average Northeast Pacific B call third harmonic contours measured from all 5 sites for each analyzed season. Error bars
represent the SD of all daily averaged measurements that were used to generate the seasonal average value for each time step
spite any minor variabilities in call duration that may Palmyra Atoll, and the other in the Gulf of Alaska,
be present in the data. This analysis was conducted with similar calls recorded off Hawai‘i (Figs. 1 & 3).
using the lm command in R. Contours from each site There were 2 characteristics that differentiated
were treated as if they came from unique grouping of them from one another, frequency and the presence
animals, and therefore regressions were run on data of a notable downstep in frequency that begins ap-
from each site independently to observe whether the proximately 10 to 12 s from the start of the call. On
animals at each respective site have shifted their fre- average, B calls from the Gulf of Alaska were pro-
quency at different rates. Data from Palmyra Atoll, duced at a higher frequency than those recorded
Hawai‘i and Washington were not included in re- from Washington and southern California (Fig. 3).
gression analyses due to the sparsity of available The downstep in frequency was more prominent in
data. All appropriate diagnostic tests were run to ver- calls recorded in the Gulf of Alaska than it was at
ify the results of the regressions (Quinn & Keough the other 2 feeding grounds, where this step was
2002). Residual versus fitted plots revealed there nearly non-existent. While calls from Washington
were no issues with homoscedasticity, and Shapiro- consistently displayed intermediate characteristics
Wilks tests showed the data were mostly normally between the other 2 feeding sites, they were more
distributed with no outliers. similar to B calls from southern California visually
(Fig. 3) and statistically (Figs. 4 & 5). Contours from
both putative breeding grounds in the central
3. RESULTS Pacific displayed similar characteristics to B call
variants observed in the NEP foraging grounds.
At least 2 regionally distinct variants of B calls Mean B call contours from Palmyra Atoll strongly
were found across all sites — one dominant in south- resembled the southern California variant, whereas
ern California, with a similar variant recorded off contours measured from Hawai‘i data displayed a26 Endang Species Res 46: 19–33, 2021
G.AK
3 WA
SC
2 HI
Dimension 2
1
0
−1
−2
Stress: 5.6%
−6 −4 −2 0 2
Dimension 1
3
2
1
Dimension 2 0
−1
−2
−3
Stress: 6.9%
−6 −4 −2 0 2 4
Dimension 1
Fig. 5. Clusters from Kruskal’s non-metric multidimensional
scaling for the 2011−2012 (top panel) and 2012−2013 (bottom
panel) seasons
3.1. Site-dependent B call clusters
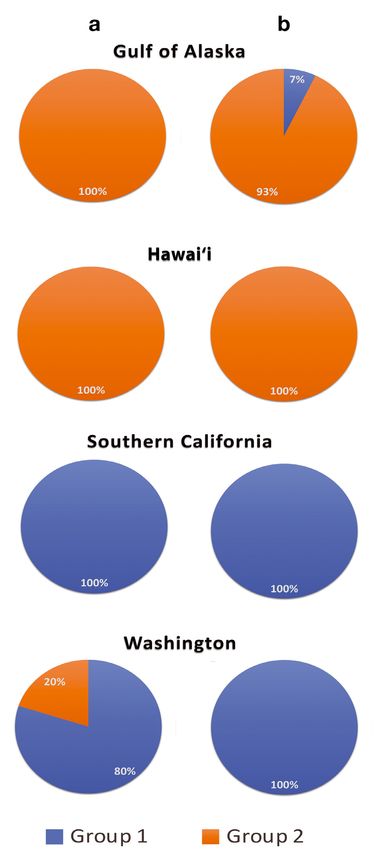
One of the 2 clusters for the 2011−2012 data con-
tained all Gulf of Alaska contours, all Hawai‘i con-
tours and 20% of Washington contours (2 of 10)
(Fig. 4A). The other cluster had all southern Califor-
nia contours and the remaining 80% of contours from
Washington (Fig. 4A).
Using the assumption of 2 clusters for the 2012−
2013 data, 100% of contours from Washington (25 of
25) and southern California (25 of 25) were clustered
Fig. 4. Proportion of contours from the (a) 2011−2012 and (b) together along with 7% of contours from the Gulf of
2012−2013 seasons, clustered into group 1 (blue) or group 2 Alaska (1 of 14) (Fig. 4B). The remaining 93% of con-
(orange) at each site via k-means clustering
tours from the Gulf of Alaska and both contours from
Hawai‘i were grouped into the second cluster
very prominent downstep in frequency and, as (Fig. 4B). When 3 clusters were assumed, all 3 feed-
such, bore strong resemblance to the Gulf of Alaska ing sites were mostly correctly placed into their own
B call variant (Fig. 3). The matches in contour struc- groups, with only a small degree of overlap. The
ture between breeding and feeding grounds were strongest overlap occurred between southern Cali-
further supported with cluster analysis (Fig. 4) and fornia and Washington. In 1 group, 20% of contours
multidimensional scaling (Fig. 5). from Washington (5 of 25) were clustered with 84%Carbaugh-Rutland et al.: Northeast Pacific blue whale song variants 27
Southern California 3.2. Frequency shift
45.5 B calls from the Gulf of Alaska and southern Cali-
fornia showed a significant linear decline over time of
45.0 its third harmonic frequency (Fig. 6). In the Gulf of
Frequency
Alaska, third harmonic frequency declined at a rate
44.5 of 0.48 Hz per year, with a 95% CI of 0.63 to 0.34 (R2 =
0.51, p = 3.51 × 10⁻⁸). In southern California, fre-
44.0 quency declined at a rate of 0.32 Hz per year, with a
95% CI of 0.37 to 0.27 (R2 = 0.63, p < 0.001). Over the
2 seasons in which data were available for Washing-
43.5
ton, the decline in the third harmonic of the B call was
2010 2011 2012 2013 not significant (R2 = 0.03, p = 0.15). Frequency shift
Year
could not be calculated for Palmyra Atoll, as there
Gulf of Alaska was only one season of data available, and we chose
not to calculate the frequency shift for Hawai‘i, due to
47.5 the small number of daily averaged B call contours
available from each of the 2 seasons of available data.
47.0
Frequency
46.5
4. DISCUSSION
46.0
We identified 2 distinct B call variants within the
45.5 NEP population of blue whales. Because these vari-
ants have not previously been described, we label
45.0
them the NEP B1 call and the NEP B2 call (Fig. 1). B1
2011 2012 2013 is produced by animals off southern California and
Year
Washington and has been tentatively matched to B
Fig. 6. Daily averaged B call frequency 6 s after the maxi- calls produced near Palmyra Atoll in the central
mum frequency from southern California (top panel) and Pacific. The spectral shape of the B1 variant displays
the Gulf of Alaska (bottom panel). Red line is the trend line
little to no downstep in frequency and is produced at
from regression analysis
a lower frequency when compared to the B2 variant.
B2 is produced by animals in the Gulf of Alaska, with
of contours from southern California (21 of 25). The indication of its occurrence off the north coast of
remaining contours from each of these 2 sites were O‘ahu, Hawai‘i, further north than the central Pacific
placed together in a second group, meaning that ulti- location where the B1 variant was recorded.
mately all contours from Washington and southern The fact that the B call makes up an essential com-
California were sorted together, across 2 groups. The ponent of the NEP song (Rivers 1997, McDonald et al.
third group contained only contours from the Gulf of 2001) makes these results intriguing. Blue whale
Alaska and Hawai‘i. This pattern of grouping is con- song has been proposed as a tool for delineating pop-
sistent with the 2-cluster analyses (Fig. 4). ulation structure worldwide (McDonald et al. 2006,
At least 2 distinct groupings were apparent from Širović & Oleson in press). In other vocal species,
multidimensional scaling, one including data from variations in song have been shown to directly im-
the Gulf of Alaska and Hawai‘i and the other includ- pact reproductive behaviors and success and in some
ing data from southern California and Washington, cases can even contribute to reproductive isolation
with very little overlap between the two (Fig. 5). Fur- between allopatric groups (Nottebohm 1970, Searcy
thermore, the stress values were 5.6 for 2011−2012 & Anderson 1986, Davidson & Wilkinson 2004, Ed-
data and 6.9 for 2012−2013 data, which indicates that wards et al. 2005, Holy & Guo 2005). We observed a
the representation of the true distances between data difference in frequency between the 2 variants of up
points, when plotted into 2-dimensional space, can to 2 Hz, depending on the section of the contour,
be classified as good (Dugard et al. 2010). These which is far greater than the within-site frequency
results further support the clustering into 2 unique variability observed at any of the sites with sufficient
groupings of B call variants in these data. data. Given that the frequency of this population has28 Endang Species Res 46: 19–33, 2021 continuously decreased over the last 60 yr, and competitive response that allows the NEP males to singers are very finely tuned to the song frequency differentiate themselves from the more monotone within a given year (McDonald et al. 2009), it is likely calls of the CWP males. Preference for more com- that these differences in frequency between the B1 plex signals is found elsewhere in the animal king- and B2 variants are important to these animals. It is dom. The females of several species of songbirds possible that the geographic separation in B call vari- demonstrate preferential selection towards males ants we observed is indicative of 2 distinct and that produce more complex song (Catchpole 1987, potentially even reproductively isolated groups Hiebert et al. 1989, Ballentine 2004). This pattern is within the NEP population — one categorized by the also observed in mice, greater white-lined bats Sac- B1 variant, recorded off the west coast of the USA copteryx bilineata and northern elephant seals and off Palmyra Atoll, and another categorized by Mirounga angustirostris (Davidson & Wilkinson the B2 variant, recorded in the Gulf of Alaska and 2004, Chabout et al. 2015, Casey et al. 2018). If a near Hawai‘i. The region off Washington state, while subgroup of animals from the NEP population has, dominated by the B1 variant, may be an area of geo- in fact, extended its range beyond, and subse- graphic overlap of the 2 populations, as B2 variants quently adjusted its reproductive calls in response were also occasionally detected there. to site-specific pressures, then it is possible that this If this is, in fact, an indication of 2 NEP populations, change may result in differential mate selection and it is important to consider what pressures may lead to divergence in the future. divergence. Blue whale population numbers rose Ideally, our hypothesis on population substructure steadily in this region after the cessation of commer- should be tested using satellite tags and genetic se- cial whaling but have been relatively constant for quencing. It would be interesting to compare gene- several decades now, leading some to believe that tic samples of animals in the Gulf of Alaska with the the population has approached its carrying capacity animals found off Washington and southern Califor- (Calambokidis & Barlow 2004, Calambokidis et al. nia to see if any degree of divergence is evident 2015, Campbell et al. 2015, Monnahan et al. 2015). within the NEP population and, if so, along what The re-emergence of blue whales in the Gulf of geographical boundaries this divergence has oc- Alaska could indicate that they have recovered in a curred. However, if this population is in the early historic, pre-whaling foraging region (Stafford 2003). stages of divergence, separation may not yet be Or, it is possible that a subgroup of animals from the observable genetically (LeDuc et al. 2007). Long- NEP population has extended its range to include the duration satellite tags could provide further verifica- productive waters of the Gulf of Alaska and now tion of movements into the central Pacific. To date, returns to this area year after year (Abrahms et al. no blue whales have been tagged in the Gulf of 2019). In the process, they may have adjusted the Alaska. While that would be a very challenging structure of their mating call in response to site- task, doing so would provide insights on the poten- specific pressures. tial migratory route into the central Pacific or other The B2 variant was observed in the Gulf of Alaska regions of the ETP. However, because the eastern and Hawai‘i. It is well known that in the Gulf of and central populations overlap in the Gulf of Alas- Alaska, NEP and central western Pacific (CWP), ka (Stafford 2003), identifying whether the tagged blue whale populations overlap in space and time animal is from the CWP or NEP population would (Stafford 2003). We also noted a spatiotemporal be a challenge and would require the use of real- overlap between these 2 call types when reviewing time acoustic data as well. Alternatively, conducting December and January recordings from Hawai‘i, tagging in the fall would lead to a higher chance of which contrasts previous studies on the seasonality tagging NEP blue whales (Rice et al. 2021), al- of blue whale calls in the region (Stafford et al. though this may be an even more challenging task 2001). CWP blue whales produce a low-frequency due to weather. tonal reproductive call that has little variation in fre- Over 150 satellite tags have been deployed on blue quency across the duration of the call (McDonald et whales in the NEP, most with initial attachment off al. 2006). Furthermore, the fundamental frequency the coast of southern California, but none of the pub- of CWP blue whale calls is between 17 and 19 Hz, lished data contain examples of animals moving as only a few hertz higher than the fundamental fre- far south as Palmyra Atoll or as far west as Hawai‘i quency of the NEP calls from the same region (~15 and most indicate movement along Mexican waters Hz). It is therefore possible that the sharp downstep and to the Costa Rica Dome (Mate et al. 1999, Bailey in frequency observed in the B2 call variant is a et al. 2009, Irvine et al. 2014). Yet, our acoustic data
Carbaugh-Rutland et al.: Northeast Pacific blue whale song variants                      29

support the presence of NEP blue whales in the cen-              B calls measured in this study also displayed a con-
tral Pacific. This discrepancy between satellite tags         sistent decrease in frequency of its third harmonic.
and passive acoustic data is not entirely surprising          While there is no widely accepted theory currently
considering the relatively low number of detected             why this occurs, these results are largely consistent
calls and likely long propagation ranges at these             with previous observations of a decline in blue whale
lower-latitude locations. The locations of recorders          song unit frequency (McDonald et al. 2009, Gavrilov
off Palmyra Atoll, and generally low received levels          et al. 2012, Širović 2016, Leroy et al. 2018, Miksis-
for those calls, mean that the blue whale calls re-           Olds et al. 2018). The rate of decrease was different
corded on them were likely coming from areas to the           across locations. Calls recorded from the Gulf of
north and east of the atoll, from the presumed breed-         Alaska (B2 variants) declined at a slightly higher an-
ing grounds off Central America. The calls recorded           nual rate than calls recorded from southern Califor-
off Hawai‘i, on the other hand, often had very high           nia (B1 variants). The rate of decline was smallest off
received levels and were emanating from areas just            Washington, although that could be the result of mix-
north of O‘ahu in the central Pacific.                        ing of the 2 B variants in these waters.
   From the management perspective, the possible                 It is important to acknowledge that there are a
existence of 2 distinct groups within the NEP popula-         number of limitations inherent in passive acoustic
tion could have large implications. NOAA Fisheries            studies. The main limit is that these data do not pro-
currently manages blue whales as 2 stocks in the US           vide information on which or how many animals
exclusive economic zones of the North Pacific: one            vocalize in a given sampling period. To address this
that extends from the Gulf of Alaska to the ETP,              issue, all statistical analyses were conducted on
referred to as the eastern North Pacific stock, and           datasets that contained daily averages of contour
another in the central Pacific, referred to as the cen-       structure, to avoid over-representing a single animal.
tral North Pacific stock (NOAA 2019). In a recent                A challenge with these data was also that the re-
assessment, Monnahan et al. (2014) split North                cordings were collected opportunistically. It is still
Pacific blue whale catch records along these lines,           unknown where exactly these animals congregate
based on the presence of 2 geographically distinct            in the central Pacific, if they do in fact congregate
song types found within the region, the CWP song              for breeding. Therefore, instruments deployed near
(from the central North Pacific stock) and the NEP            Hawai‘i and Palmyra Atoll contained only occa-
song (from the eastern North Pacific stock). Histori-         sional blue whale calls, during the few instances
cally high catch rates of blue whales in the Gulf of          when animals happened to be close enough for the
Alaska when compared to southern California (Mon-             hydrophone to receive those signals, or they were
nahan et al. 2014) indicate that this region was once         well propagated over potentially long distances. As
an important blue whale habitat. In the Indian                a result, data from these sites, particularly Palmyra
Ocean, a new blue whale song was discovered off               Atoll, often displayed weak signal-to-noise ratios,
the coast of Oman, an area where blue whales were             which made measuring their features challenging.
hit particular hard by illegal Soviet whaling, and has        Data from the few days found to contain B calls in
been proposed as possible evidence for the rediscov-          Hawai‘i also presented challenges. For one, there
ery of a historically exploited population (Cerchio et        were often several calls that overlapped one an-
al. 2020). Our results may tell a similar story in the        other, which made extracting accurate contours dif-
NEP. Therefore, it may be worthwhile to further eval-         ficult. Secondly, the best calls available in this data-
uate evidence for stock delineation, which could lead         set had a very high amplitude, making them more
to a need for reassessments of catch and recovery             broadband than calls from the other study sites. The
estimates by dividing the eastern North Pacific stock         strength of the signal leads us to believe that the
into 2 regions, one where the B1 variant is present           overlapping B calls were the result of multiple ani-
and the other where the B2 variant is present, to             mals vocalizing at once, close to the hydrophone, as
evaluate separate recovery states. If there are or his-       opposed to multi-path arrivals. Because of the lim-
torically were, in fact, 2 unique groups in this area,        ited sample size from Hawai‘i data, these effects
then it is possible that one was disproportionally af-        made it difficult to evaluate whether the substan-
fected and has been slower to recover from the im-            tially higher frequency of calls measured in Hawai‘i
pacts of whaling. Alternatively, if the Gulf of Alaska        when compared to the Gulf of Alaska is a true indi-
population was extirpated, recent range expansion             cation of the calls produced there or if it is an arti-
from the population off California and Washington             fact of the data extraction process. If the broad con-
could have seeded a new subgroup.                             tour of the calls in Hawai‘i systematically resulted in
30                                        Endang Species Res 46: 19–33, 2021

a higher maximum frequency being selected along                                 5. CONCLUSIONS
the contour, it is possible that extraction of the lower
end of that wide frequency contour would have                  We have discovered the existence of at least 2 dis-
resulted in calls that were of more similar frequency        tinct variants of the stereotypical NEP blue whale B
to those recorded in the Gulf of Alaska.                     call. These 2 variants, B1 and B2, appear to be at
  Our goal in this study was to quantify one of the          least partially geographically separated, with the
call units of stereotypical songs of blue whales and to      strongest separation between B calls in the Gulf of
statistically compare its features from different sites      Alaska and those in southern California. While visual
across the North Pacific. We extracted 8 variables           comparisons originally indicated a possible third
from daily averaged B call contours. Six of those vari-      intermediate variant that was measured from Wash-
ables were measurements of frequency, collected              ington data, statistical analyses consistently grouped
across the call durations. One variable was a meas-          these calls with the B1 variant. The B1 variant occurs
urement of the slope in the least variable region of B       off the coasts of Washington and southern California,
calls across sites, and the final variable was a meas-       and the B2 variant is found further north in the Gulf
urement of the downstep in frequency, which was              of Alaska. As expected, both variants were also ob-
visually the strongest differing feature between B1          served in the central Pacific, and a similar north−
and B2 variants. When tested statistically, these vari-      south separation was observed. The B1 variant was
ables were sufficient, and highly effective in group-        recorded off Palmyra Atoll, the more southern of the
ing B call contours by their appropriate site, while         central Pacific sites, whereas the B2 variant was
also showing geographic structure across the 2 vari-         recorded off Hawai‘i, the more northern recording
ants. These results support our hypothesis on the            location. These distinct variants may indicate sepa-
existence of unique B call variants within the NEP           rate populations, or groups that have begun to
population and offer a new approach to studies               diverge, which could have important management
investigating the previously underestimated com-             consequences for this endangered species.
plexities of stereotypical whale songs.                        We also observed a significant decline in tonal fre-
  Moving forward, this study should be expanded to           quency of NEP blue whale calls in these data and
include more years of data as well as other sites in         found that the rate of decrease was different for each
the North Pacific. Sites of particular interest would        variant. While this frequency shift has been observed
be presumed breeding grounds such as the Gulf of             across all blue whale populations, we still do not
California and the Costa Rica Dome. Investigating            know why they engage in this behavior. Different
these sites for the presence of B1 and B2 variants           rates of frequency decline in a species where individ-
could provide further information on the geographic          uals generally appear to be very well tuned to the
separation of the 2 call types. We explored variations       correct annual frequency indicate, however, that this
in B call structure alone, which is only one aspect of       decline is likely biologically important and locally
NEP blue whale song. Song phrasing in blue whales            driven.
can also be highly variable within populations. For            The communicative behavior of many species of
example, variants of pygmy blue whale Balaenoptera           large cetaceans is still an underexplored topic. The
musculus brevicauda song in the southeastern Indian          results of this study demonstrate that the vocal reper-
Ocean were defined by which of 3 stereotypical units         toire of the NEP population is more complex and
they contained (Jolliffe et al. 2019). In the NEP, 2 dis-    variable than previously understood and can serve as
tinct song patterns have been found, an AB pattern           a foundation for future studies on the topic of fine-
and an ABB pattern (Lewis & Širović 2018). Similarly,        scale variations in stereotypical reproductive calls.
once thought to be a variant of the SEP1 song type           Given the observed implications of such variations in
(Stafford et al. 1999b), a new song type, SEP2, has          singing behavior in other taxa (Edwards et al. 2005),
been described in the ETP that is differentiated from        further explorations into this topic could provide
SEP by subtle yet apparent differences in unit shape         valuable insights into the still poorly understood pop-
and patterning (Buchan et al. 2014). Further studies         ulation dynamics of these endangered animals.
should therefore include not only investigations of
variations in A call structure but also explorations         Acknowledgements. We thank the scientists, engineers and
into patterns of A and B unit production, to see if          faculty of the Whale Acoustics Lab at the Scripps Institution
                                                             of Oceanography for access to HARP data used in this analy-
song phrasing is different between songs produced            sis. In particular, deployment, recovery and data processing
with the B1 variant and songs produced with the B2           were supported by Hannah Bassett, Tim Christianson, Chris
variant.                                                     Garsha, Ryan Griswold, Brent Hurley, John Hurwitz, Erin
Carbaugh-Rutland et al.: Northeast Pacific blue whale song variants 31
O’Neill and Bruce Thayre as well as Sean Wiggins and John Calinski T, Harabasz J (1974) A dendrite method for cluster
Hildebrand. HARP data collection was supported by the analysis. Commun Stat 3:1−27
Chief of Naval Operations CNO-N45 (Frank Stone, Ernie Campbell GS, Thomas L, Whitaker K, Douglas AB, Calam-
Young and Bob Gisiner) and the US Pacific Fleet Environ- bokidis J, Hildebrand JA (2015) Inter-annual and seasonal
mental Monitoring Program (Chip Johnson). Data from trends in cetacean distribution, density and abundance off
ACO were provided by James Potemra, Bruce Howe and southern California. Deep Sea Res II 112:143−157
Fernando Santiago-Mandujano from the University of Casey C, Reichmuth C, Costa DP, Le Boeuf B (2018) The rise
Hawai‘i. ACO was supported by research and instrumenta- and fall of dialects in northern elephant seals. Proc Biol
tion grants from the National Science Foundation to the Uni- Sci 285:20182176
versity of Hawai‘i. A.C.R. was funded by a Texas A&M Uni- Catchpole CK (1987) Bird song, sexual selection and female
versity at Galveston Graduate Fellowship. choice. Trends Ecol Evol 2:94−97
Cerchio S, Willson A, Leroy EC, Muirhead C and others
(2020) A new blue whale song-type described for the
LITERATURE CITED Arabian Sea and western Indian Ocean. Endang Species
Res 43:495−515
Abrahms B, Hazen EL, Aikens EO, Savoca MS and others Chabout J, Sarkar A, Dunson DB, Jarvis ED (2015) Male
(2019) Memory and resource tracking drive blue whale mice song syntax depends on social contexts and influ-
migrations. Proc Natl Acad Sci USA 116:5582−5587 ences female preferences. Front Behav Neurosci 9:76
Archer FI, Rankin S, Stafford KM, Castellote M, Delarue J Clapham PJ, Baker CS (2018) Whaling, modern. In: Würsig
(2020) Quantifying spatial and temporal variation of B, Thewissen JGM, Kovacs KM (eds) Encyclopedia of
North Pacific fin whale (Balaenoptera physalus) acoustic marine mammals, 3rd edn. Academic Press, London,
behavior. Mar Mamm Sci 36:224−245 p 1070−1074
Bailey H, Mate BR, Palacios DM, Irvine L, Bograd SJ, Costa Clark CW (1990) Acoustic behavior of mysticete whales. In:
DP (2009) Behavioural estimation of blue whale move- Thomas JA, Kastelein RA (eds) Sensory abilities of ceta-
ments in the Northeast Pacific from state-space model ceans. Springer, Boston, MA, p 571−583
analysis of satellite tracks. Endang Species Res 10:93−106 Clark CW, Johnson JJ (1984) The sounds of the bowhead
Balcazar NE, Tripovich JS, Klinck H, Nieukirk SL, Mellinger whale, Balaena mysticetus, during the spring migrations
DK, Dziak RP, Rogers TL (2015) Calls reveal population of 1979 and 1980. Can J Zool 62:1436–1441
structure of blue whales across the southeast Indian Cooke JG (2018) Balaenoptera musculus. The IUCN Red List
Ocean and the southwest Pacific Ocean. J Mammal 96: of Threatened Species 2018:eT2477A50226195. https://
1184−1193 www.iucnredlist.org/species/2477/156923585 (accessed
Ballentine B (2004) Vocal performance influences female 7 Nov 2019)
response to male bird song: an experimental test. Behav Davidson SM, Wilkinson GS (2004) Function of male song in
Ecol 15:163−168 the greater white-lined bat, Saccopteryx bilineata. Anim
Barlow DR, Torres LG, Hodge KB, Steel D and others (2018) Behav 67:883−891
Documentation of a New Zealand blue whale population Dugard P, Todman J, Staines H (2010) Approaching multi-
based on multiple lines of evidence. Endang Species Res variate analysis: a practical introduction, 2nd edn. Rout-
36:27−40 ledge, New York, NY
Barrett-Lennard LG, Ford JKB, Heise KA (1996) The mixed Edds-Walton PL (1997) Acoustic communication signals of
blessing of echolocation: differences in sonar use by fish- mysticete whales. Bioacoustics 8:47−60
eating and mammal-eating killer whales. Anim Behav Edwards SV, Kingan SB, Calkins JD, Balakrishnan CN, Jen-
51:553−565 nings WB, Swanson WJ, Sorenson MD (2005) Speciation
Berchok CL, Bradley DL, Gabrielson TB (2006) St. Lawrence in birds: genes, geography, and sexual selection. Proc
blue whale vocalizations revisited: characterization of Natl Acad Sci USA 102(Suppl 1):6550−6557
calls detected from 1998 to 2001. J Acoust Soc Am 120: Garland EC, Rendell L, Lamoni L, Poole MM, Noad MJ
2340–2354 (2017) Song hybridization events during revolutionary
Boughman JW (1998) Vocal learning by greater spear-nosed song change provide insights into cultural transmission
bats. Proc R Soc B 265:227−233 in humpback whales. Proc Natl Acad Sci USA 114:
Buchan SJ, Hucke-Gaete R, Rendell L, Stafford KM (2014) A 7822−7829
new song recorded from blue whales in the Corcovado Gavrilov AN, McCauley RD (2013) Acoustic detection and
Gulf, southern Chile, and an acoustic link to the eastern long-term monitoring of pygmy blue whales over the
tropical Pacific. Endang Species Res 23:241−252 continental slope in southwest Australia. J Acoust Soc
Calambokidis J, Barlow J (2004) Abundance of blue and Am 134:2505−2513
humpback whales in the eastern North Pacific estimated Gavrilov AN, McCauley RD, Gedamke J (2012) Steady
by capture−recapture and line-transect methods. Mar inter and intra-annual decrease in the vocalization fre-
Mamm Sci 20:63−85 quency of Antarctic blue whales. J Acoust Soc Am 131:
Calambokidis J, Barlow J, Ford JKB, Chandler TE, Douglas 4476−4480
AB (2009) Insights into the population structure of blue Heimlich SL, Mellinger DK, Nieukirk SL, Fox CG (2005)
whales in the eastern North Pacific from recent sightings Types, distribution, and seasonal occurrence of sounds
and photographic identification. Mar Mamm Sci 25: attributed to Bryde’s whales (Balaenoptera edeni) re-
816−832 corded in the eastern tropical Pacific, 1999−2001. J Acoust
Calambokidis J, Steiger GH, Curtice C, Harrison J and others Soc Am 118:1830−1837
(2015) Biologically important areas for selected cetaceans Hiebert SM, Stoddard PK, Arcese P (1989) Repertoire size,
within US waters — west coast region. Aquat Mamm 41: territory acquisition and reproductive success in the song
39−53 sparrow. Anim Behav 37:266−27332 Endang Species Res 46: 19–33, 2021
Holy TE, Guo Z (2005) Ultrasonic songs of male mice. PLOS Monnahan CC, Branch TA (2015) Sensitivity analyses for the
Biol 3:e386 eastern North Pacific blue whale assessment. Scientific
Irvine LM, Mate BR, Winsor MH, Palacios DM and others Committee of the International Whaling Commission
(2014) Spatial and temporal occurrence of blue whales Tech Rep SC/66a/IA/15
off the US west coast, with implications for management. Monnahan CC, Branch TA, Stafford KM, Ivashchenko YV,
PLOS ONE 9:e102959 Oleson EM (2014) Estimating historical eastern North
Irwin DE, Bensch S, Price TD (2001a) Speciation in a ring. Pacific blue whale catches using spatial calling patterns.
Nature 409:333−337 PLOS ONE 9:e98974
Irwin DE, Irwin JH, Price TD (2001b) Ring species as bridges Monnahan CC, Branch TA, Punt AE (2015) Do ship strikes
between microevolution and speciation. Genetica 112: threaten the recovery of endangered eastern North
223−243 Pacific blue whales? Mar Mamm Sci 31:279−297
Jarvis ED (2004) Learned birdsong and the neurobiology of NOAA (2019) Blue whale (Balaenoptera musculus muscu-
human language. Ann N Y Acad Sci 1016:749−777 lus): eastern North Pacific stock assessment report.
Jarvis ED (2006) Selection for and against vocal learning in https://media.fisheries.noaa.gov/dam-migration/2019_
birds and mammals. Ornitholog Sci 5:5−14 sars_bluewhale_enp.pdf
Jolliffe CD, McCauley RD, Gavrilov AN, Jenner KCS, Jen- Noad MJ, Cato DH, Bryden MM, Micheline JN, Curt JS
ner MM, Duncan AJ (2019) Song variation of the south (2000) Cultural revolution in whale songs. Nature 408:537
eastern Indian Ocean pygmy blue whale population in Nottebohm F (1970) Ontogeny of bird song. Science 167:
the Perth Canyon, Western Australia. PLOS ONE 14: 950−956
e0208619 Nottebohm F (1972) The origins of vocal learning. Am Nat
LeDuc RG, Dizon AE, Goto M, Pastene LA and others (2007) 106:116−140
Patterns of genetic variation in Southern Hemisphere blue Oksanen J, Blanchet FG, Friendly M, Kindt R and others
whales and the use of assignment test to detect mixing (2019) vegan: community ecology package. R package ver-
on the feeding grounds. J Cetacean Res Manag 9:73−80 sion 2.5-6. https://CRAN.R-project.org/package= vegan
Leroy EC, Samaran F, Bonnel J, Royer JY (2016) Seasonal Oleson EM, Calambokidis J, Burgess WC, McDonald MA,
and diel vocalization patterns of Antarctic blue whale LeDuc CA, Hildebrand JA (2007) Behavioral context of
(Balaenoptera musculus intermedia) in the southern call production by eastern North Pacific blue whales.
Indian Ocean: a multi-year and multi-site study. PLOS Mar Ecol Prog Ser 330:269−284
ONE 11:e0163587 Paniagua-Mendoza A, Gendron D, Romero-Vivas E, Hilde-
Leroy EC, Royer JY, Bonnel J, Samaran F (2018) Long-term brand JA (2017) Seasonal acoustic behavior of blue
and seasonal changes of large whale call frequency in whales (Balaenoptera musculus) in the Gulf of Califor-
the southern Indian Ocean. J Geophys Res Oceans 123: nia, Mexico. Mar Mamm Sci 33:206−218
8568−8580 Pepperberg IM (2002) Cognitive and communicative abili-
Lewis LA, Širović A (2018) Variability in blue whale acoustic ties of grey parrots. Curr Dir Psychol Sci 11:83−87
behavior off southern California. Mar Mamm Sci 34: Pham DT, Dimov SS, Nguyen CD (2004) Selection of K in K-
311−329 means clustering. Proc Inst Mech Eng C J Mech Eng Sci
Lewis LA, Calambokidis J, Stimpert AK, Fahlbusch J and 219:103−119
others (2018) Context-dependent variability in blue Poole JH, Tyack PL, Stoeger-Horwath AS, Watwood S
whale acoustic behaviour. R Soc Open Sci 5:180241 (2005) Elephants are capable of vocal learning. Nature
Maechler M, Rousseeuw P, Struyf A, Hubert M, Hornik K 434:455−456
(2021) cluster: cluster analysis basics and extensions. Quinn GP, Keough MJ (2002) Experimental design and data
R package version 2.1.1. https://CRAN.R-project.org/ analysis for biologists. Cambridge University Press,
package=cluster Cambridge
Marler P (1970) A comparative approach to vocal learning: R Core Team (2021) R: a language and environment for sta-
song development in white-crowned sparrows. J Comp tistical computing. R Foundation for Statistical Comput-
Physiol Psychol 71:1−25 ing, Vienna
Mate BR, Lagerquist BA, Calambokidis J (1999) Movements Rice A, Širović A, Trickey JS, Debich AJ and others (2021)
of North Pacific blue whales during the feeding season Cetacean occurrence in the Gulf of Alaska from long-
off southern California and their southern fall migration. term passive acoustic monitoring. Mar Biol 168:72
Mar Mamm Sci 15:1246−1257 Rivers J (1997) Blue whale, Balaenoptera musculus, vocal-
MATLAB (2018) Version 9.4.0.813654 (R2018a). The Math- izations from the waters off central California. Mar
Works Inc, Natick, MA Mamm Sci 13:186−195
McDonald MA, Calambokidis J, Teranishi AM, Hildebrand Rodriguez D (2015) kselection: selection of K in K-means clus-
JA (2001) The acoustic calls of blue whales off California tering. R package version 0.2.0. https://CRAN.R-project.
with gender data. J Acoust Soc Am 109:1728−1735 org/package=kselection
McDonald MA, Hildebrand JA, Mesnick SL (2006) Biogeo- Samaran F, Stafford KM, Branch TA, Gedamke J, Royer JY,
graphic characterisation of blue whale song worldwide Dziak RP, Guinet C (2013) Seasonal and geographic vari-
— using song to identify populations. J Cetacean Res ation of southern blue whale subspecies in the Indian
Manag 8:55−65 Ocean. PLOS ONE 8:e71561
McDonald MA, Hildebrand JA, Mesnick S (2009) World- Searcy WA, Anderson M (1986) Sexual selection and the
wide decline in tonal frequencies of blue whale songs. evolution of song. Annu Rev Ecol Syst 17:507−533
Endang Species Res 9:13−21 Sears R, Calambokidis J (2002) COSEWIC assessment and
Miksis-Olds JL, Nieukirk SL, Harris DV (2018) Two unit update status report on the blue whale Balaenoptera
analysis of Sri Lankan pygmy blue whale song over a musculus. Committee on the Status of Endangered
decade. J Acoust Soc Am 144:3618 Wildlife in Canada, OttawaYou can also read