Genetic diversity and population structure of Cinnamomum balansae Lecomte inferred by microsatellites
←
→
Page content transcription
If your browser does not render page correctly, please read the page content below
Open Life Sciences 2022; 17: 323–332
Research Article
Bei Cui#, Dinh Duy Vu*#, Dinh Giap Vu#, Thi Tuyet Xuan Bui, Siddiq Ur Rahman,
Mai Phuong Pham, Minh Tam Nguyen, Van Sinh Nguyen, Syed Noor Muhammad Shah,
Viet Ha Tran#
Genetic diversity and population structure of
Cinnamomum balansae Lecomte inferred by
microsatellites
https://doi.org/10.1515/biol-2022-0037 the tropical forests of central and northern Vietnam,
received July 24, 2021; accepted January 03, 2022 which has been threatened in recent decades due to
Abstract: Cinnamomum balansae Lecomte (Lauraceae), the destruction of its habitat and over-exploitation. The
an economically important forest tree, is distributed in genetic diversity and population structure of the species
have not been fully evaluated. We used a set of 15 micro-
satellites to analyze 161 adult trees from 9 different popu-
lations, representing the geographical distribution of C.
# These authors contributed equally to this work and should be balansae. Ninety-two different alleles were identified.
regarded as co-first authors. Here our results showed a low genetic diversity level
with an average Ho = 0.246 and He = 0.262, and a high
level of genetic differentiation (FST = 0.601). The bottle-
* Corresponding author: Dinh Duy Vu, Graduate University of neck tests indicated evidence of a reduction in the popula-
Science and Technology (GUST), Vietnam Academy of Science and
tion size of the two populations (TC and CP). Additionally,
Technology (VAST), 18 Hoang Quoc Viet, Cau Giay, Hanoi, Vietnam;
Institute of Tropical Ecology, Vietnam – Russia Tropical Centre, all three clustering methods (Bayesian analysis, principal
63 Nguyen Van Huyen, Cau Giay, Hanoi, Vietnam, tel: +84-977365689, coordinate analysis, and Neighbor-joining tree) were
e-mail: duydinhvu87@gmail.com, duyvu@vnmn.vast.vn identified in the two genetic groups. The Mantel test
Bei Cui: Key Comprehensive Laboratory of Forestry, College of showed a significant positive correlation between genetic
Forestry, Northwest A & F University, Yang Ling 712100, China
distance and geographic distance (R2 = 0.7331). This study
Dinh Giap Vu: Department of Chemical Technology – Environment,
will provide a platform for the conservation of C. balansae
HaUI Institute of Technology, Hanoi University of Industry (HaUI),
298 Cau Dien, Bac Tu Liem, Hanoi, Vietnam both in ex-situ and in-situ plans.
Thi Tuyet Xuan Bui: Department of Plant Ecology, Institute of
Keywords: bottleneck, C. balansae, conservation, genetic
Ecology and Biological Resource, VAST, 18 Hoang Quoc Viet,
Cau Giay, Hanoi, Vietnam; Graduate University of Science and variability, fragmentation
Technology, VAST, 18 Hoang Quoc Viet, Cau Giay, Hanoi, Vietnam
Siddiq Ur Rahman: Department of Computer Science &
Bioinformatics, Khushal Khan Khattak University, Karak, Khyber
Pakhtunkhwa, 27200, Pakistan 1 Introduction
Mai Phuong Pham: Institute of Tropical Ecology, Vietnam – Russia
Tropical Centre, 63 Nguyen Van Huyen, Nghia Do, Cau Giay, Hanoi, Cinnamomum balansae Lecomte, a large and evergreen
Vietnam tree of the Lauraceae family, is distributed in the tropical
Minh Tam Nguyen: Department of Experimental Taxonomy and
forests of central and northern Vietnam [1–4]. It is found
Genetic Diversity, Vietnam National Museum of Nature, VAST, 18
Hoang Quoc Viet, Cau Giay, Hanoi, Vietnam at an elevation above 200 m in secondary forests on the
Van Sinh Nguyen: Department of Plant Ecology, Institute of Ecology ancient alluvial rocks and granite that have low relief
and Biological Resource, VAST, 18 Hoang Quoc Viet, Cau Giay, and gentle slopes. The species prefers precipitation of
Hanoi, Vietnam; Graduate University of Science and Technology, 800–2,500 mm and an annual mean temperature of
VAST, 18 Hoang Quoc Viet, Cau Giay, Hanoi, Vietnam
20–22°C [2,4]. C. balansae can reach a height of 30 m
Syed Noor Muhammad Shah: Department of Horticulture, Faculty of
Agriculture, Gomal University, Dera Ismail Khan, 29220, Pakistan
with a diameter of 85–90 cm at breast height. Flowers
Viet Ha Tran: Faculty of Silviculture, Vietnam National University of are small, greenish-yellow, and appear between March
Forestry, Xuan Mai, Chuong My, Hanoi, Vietnam and May. Fruiting appears from April to July, with fruit
Open Access. © 2022 Bei Cui et al., published by De Gruyter. This work is licensed under the Creative Commons Attribution 4.0 International
License.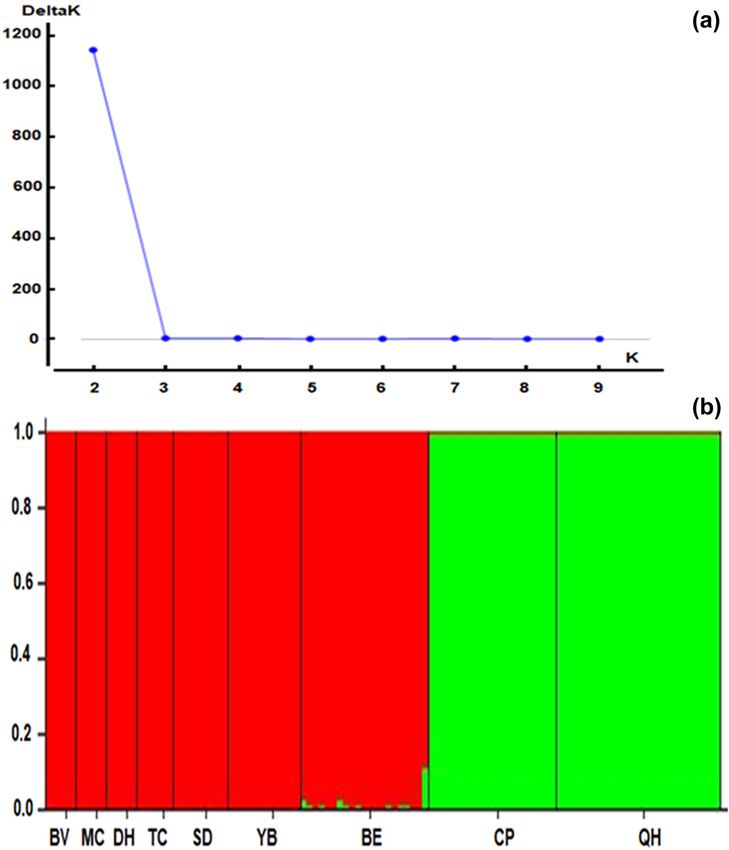
324 Bei Cui et al.
and maturation occurring in October [2]. Its bark has oil roots, leaves, and stems of C. balansae (one individual)
and camphor. The fruit oil and fat are used to make from a wild population (Ba Vi National Park, Hanoi city).
soap. Wood is used for furniture. In the past few decades, All sample tissues were immediately frozen in liquid
this species has been over-exploited by local people and nitrogen and stored at –80°C until RNA extraction.
forestry enterprises [1]. Its habitats have been destroyed To assess the genetic variation in and population
and degraded [5,6]. For that reason, C. balansae is listed structure of C. balansae, the study area for this species
as an endangered species in the IUCN Red List [7] and was carried out in nine sites, one each in Hanoi, Phu Tho,
the Vietnam Red Data Book [1]. Tuyen Quang, Yen Bai, Son La, Hoa Binh, Ninh Binh,
The adaptive and evolutionary potential of a species Thanh Hoa, and Nghe An, representing its natural range
depends on its genetic diversity [8]. Conservation and in Vietnam (Table 1, Figure 1). Sampling locations were
management of a species require knowledge of its ecolo- recorded using a global positioning system (GPS). The
gical characteristics and genetic variation within and inner bark from 161 adult trees was randomly sampled
between populations [9–11]. To obtain such information, for 9 known populations in central and northern Vietnam.
particularly a better understanding of genetics, powerful Samples were placed into plastic bags containing silica gel
and biological techniques are required [12,13]. Molecular in the field and then transferred to the Laboratory of
markers such as allozyme [14], randomly amplified poly- Molecular Biology of Vietnam-Russia Tropical Centre
morphic DNA (RAPD) [15,16], and chloroplastic DNA [17] and stored at −30°C until DNA extraction.
have been used to investigate the genetic diversity of spe-
cies in the Lauraceae family. Microsatellites (SSRs) are
widely distributed throughout the nuclear genome, dis-
playing high polymorphism and reproducibility [18–20]. 2.2 DNA/RNA extraction, cDNA sequencing,
These markers have been widely used to study the Laur-
and microsatellite loci identification
aceae species [21–29]. In the current study, microsatellites
were used to assess the genetic diversity and population
For Illumina sequencing, total RNA from each sample
structure of C. balansae and provide a platform for effec-
was isolated using the OmniPlant RNA Kit (DNase I)
tive conservation strategies of this species in Vietnam.
(www.cwbiotech.com). Both quantity and quality of total
RNA were checked through Nanodrop ND-2000 spectro-
photometer (Thermo Electron Corporation, USA) and
Agilent 2100 Bioanalyzer. An equal amount of total
2 Materials and methods RNA from each sample was pooled together and sent
to Breeding Biotechnologies Co. Ltd for cDNA library con-
2.1 Plant materials struction and transcriptome sequencing using Illumina
HiSeq™4000. Cleaned mRNA was used for cDNA library
With Illumina sequencing for the development of micro- construction extracted from 200 µg total RNA using Oligo
satellites, we collected three plant tissues, including (dT). The cDNA first strand was prepared from random
Table 1: Geographical characteristics of the nine C. balansae populations used in this study
Populations Location Sample size Latitude (N) Longitude (E)
BV Ba Vi National Park, Ha Noi City (Northern Vietnam) 10 21°06′36″ 105°33′16″
DH Chan Mong commune, Doan Hung district, Phu Tho province (Northern 15 21°33′45″ 105°09′49″
Vietnam)
SD Dong Bua commune, Son Duong district, Tuyen Quang province (Northern 19 22°10′15″ 105°20′10″
Vietnam)
YB Van Lang Commune, Yen Binh district, Yen Bai province (Northern Vietnam) 12 21°41′52″ 104°59′39″
TC Chieng Bom Commune, Thuan Chau district, Son La province (Northern 16 21°38′87″ 103°53′52″
Vietnam)
MC Tan Mai commune, Mai Chau district, Hoa Binh province (Northern Vietnam) 20 20°44′46″ 104°55′32″
CP Cuc Phuong National Park, Ninh Binh province (Central Vietnam) 21 20°21′06″ 105°35′57″
BE Ben En National Park, Thanh Hoa province (Central Vietnam) 21 19°58′08″ 105°45′57″
QH Tam Hop Commune, Quy Hop district, Nghe An province (Central Vietnam) 27 19°21′21″ 105°17′05″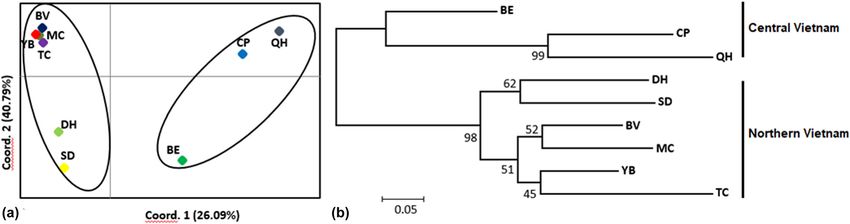
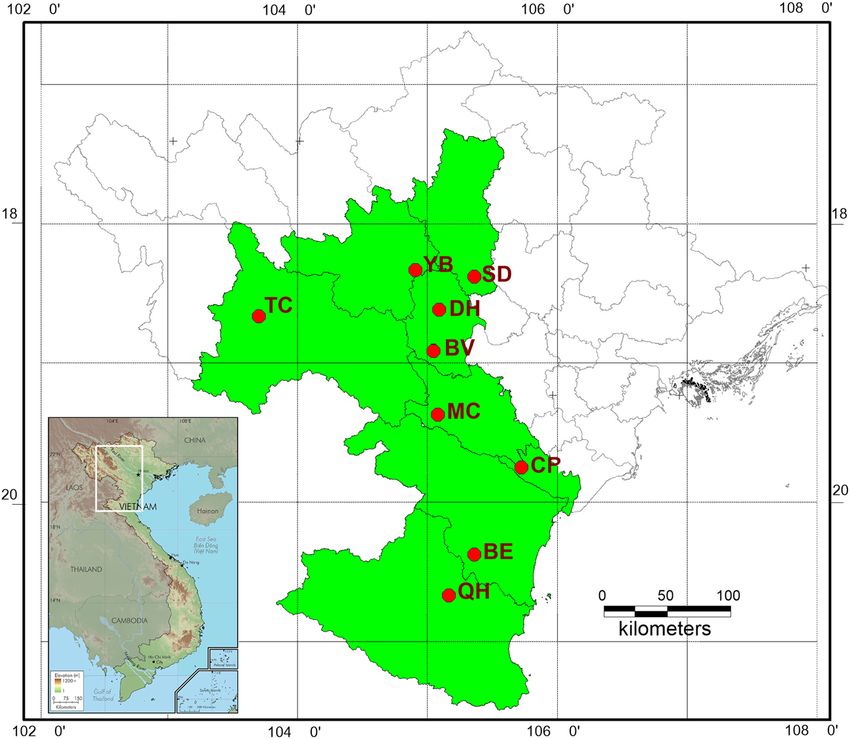
Genetic diversity and population structure of C. balansae in Vietnam 325 Figure 1: Map showing the collection sites of nine populations of C. balansae in Vietnam. hexamers using mRNA as a template, and the other showed simple sequence repeats and was deposited in strands were from the buffer, dNTPs, RNase H, and GenBank. DNA polymerase I, and then cleaned with AMPure XP Total genomic DNA was extracted from the samples beads. The cleaned double-stranded cDNA was subjected using the Plant Genome DNA Extraction Kit (BioTeke, to terminal repair, the sequencing linker was ligated, and Beijing, China). The quality of total DNA was verified then the fragment size was selected with AMPure XP by 1% agarose gel electrophoresis and NanoDrop2000 beads. The cDNA library was acquired by PCR enrichment. (BioTeke Instruments, Winooski, VT, USA). The concen- After validating the library on an Agilent 2100 Bioanalyzer, tration was then diluted to 20 ng/µL and stored at −20°C. Breeding Biotechnologies Co., Ltd sequenced the cDNA libraries on an Illumina HiSeq™ 4000. The Trimmomatic v3.0 [30] was used for raw reads filtration. The reads showing adaptor contamination, length < 36 bp, and 2.3 Microsatellite amplification low-quality value (quality
326 Bei Cui et al.
amplification was carried out on a Mastercycler X50s 2.4 Data analysis
Eppendorf, under the following thermal cycler: initial
denaturation at 94°C for 2 min, followed by 40 cycles Genetic diversity was estimated using GenAlEx [34] based
consisting of 1 min at 94°C for denaturation, 30 s align- on SSR allele frequencies, including the number of alleles
ment at the annealing temperature for each primer pair per locus (Na), effective alleles (Ne), private alleles (Np),
at 55°C and 1 min at 72°C for extension, and 10 min at the proportion of polymorphic loci (P%), the coefficient
72°C for final cycle to complete the extension of any of total inbreeding (FIT), the genetic differentiation (FST),
remaining products before holding the samples at 4°C Nei’s genetic distances among the populations, the ob-
until they were analyzed. The amplification products served heterozygosities (Ho), and the expected heterozyg-
were separated on 8% polyacrylamide gels in 1 × TAE osities (He). Gene flow between populations (Nm) was
buffer using the Cleaver Scientific electrophoresis system calculated using the FST value: Nm = (1/FST − 1)/4. The
(UK) and visualized with GelRedTM 10000X. The sizes of inbreeding coefficients (FIS) value was also calculated
the PCR products were detected and analyzed using GelA- for each population by Fstat [35]. Tests for deviation
nalyzer software with a 20 bp DNA ladder (Invitrogen). from the Hardy-Weinberg equilibrium at each locus and
Table 2: Characteristics and genetic estimates for 15 SSR loci of C. balansae
Locus Primer sequence (5′–3′) Motif Size (bp) Na Np FIS FIT FST Nm GenBank code
V03 F: CCACCCCAATTCGATTATTG (AGCAGG)5(AGC)6 219 5 2 0.335 0.645 0.467 0.285 MN486375
R: CCAAGCAGCTTTACTCCACC
V07 F: GAGAGCTTCCAAAGCCACTG (CAC)5(CAT)5 234 6 3 0.635 0.864 0.626 0.149 MN486379
R: AAGAAGCCGACAAGCAAAAA
V08 F: AGGGATTTTGGAGATTTTGC (CTT)5(CCT)7 150 9 4 −0.130 0.239 0.327 0.515 MN486380
R: GGACGCCAAAACCAAATGTA
V11 F: TTTGAGGGAAATGGTTCCTG (TAG)5(TAA)6 194 6 2 −0.096 0.453 0.501 0.249 MN486383
R: TTGGGCCAAAACAAGAAGAC
V25 F: ACGAGTTTCCACCGATTACG (ATC)8 268 5 2 −0.024 0.992 0.992 0.002 MN486397
R: ACTCCTTTCAGCACCGATTG
V30 F: TTGTTAAAAACACCAACCCCA (TCA)8 200 5 2 −0.113 0.524 0.572 0.187 MN486402
R: CAGTGGGCCAAGTGTATCCT
V31 F: ACGTGAATGTGAATGGGGTT (AAC)9 189 5 1 0.219 0.851 0.809 0.059 MN486403
R: TAGGCAAAGACTCCGAAGGA
V33 F: ATTCGGGTCTCTCTCCCTGT (ACCA)6 249 8 2 0.220 0.620 0.513 0.237 MN486405
R: CTCTCTCGCTGTCTCTGCCT
V35 F: TGGAGAACAACTTTGGGAGG (GATG)6 119 7 2 −0.258 0.518 0.617 0.155 MN486407
R: TGTTCCATGTTACAGATACAG
V41 F: ATATGGTCCCAACTCCCTCC (ACCCA)5 203 8 4 0.289 0.808 0.729 0.093 MN486413
R: ACCGTCACCAGATCATCCAT
V51 F: TCCCAACTGGACGAAGTTCT (ATGACC)7 237 4 1 0.505 0.834 0.665 0.126 MN486423
R: TTTGCTCGCTGTTATGATGC
V75 F: ATCCTCCCAAGGACGCTTAT (CCT)7 133 7 3 0.287 0.625 0.473 0.278 MN486447
R: CCTTCAAGGAAAGAAGGGCT
V81 F: CACCACCTTCTCCTTCCAAA (CTC)7 234 4 2 −0.351 0.740 0.808 0.060 MN486453
R: TTGTTGGGGTCTCCAAACTC
V93 F: CGGACAATTTTCAGGGATGA (GTC)7 166 6 2 −0.096 0.594 0.630 0.147 MN486465
R: CCTGCATTCTAGATGCCTCC
V108 F: GAAAGAAGTTGGGGGAGGAG (TGA)7 209 6 3 −0.315 0.060 0.285 0.627 MN486480
R: GAATCGCGGAGATACGGATA
Mean 6.1 0.074 0.624 0.601 0.211
Na: number of alleles; Np: private alleles; FIS: inbreeding coefficient; FIT: coefficient of total inbreeding; FST: genetic differentiation;
Nm: gene flow.Genetic diversity and population structure of C. balansae in Vietnam 327
the linkage disequilibrium for each locus pairwise com- 3 Results
bination in each population were also performed by
Genpop v.4.6 [36]. Arlequin v.3.0 [37] was used to per-
3.1 Genetic diversity
form an analysis of molecular variance (AMOVA) for
the estimation of genetic divergence as PhiPT, and its
A total of 92 different alleles were detected from 15 SSR
associated significance based on 10,000 permutations.
markers in C. balansae in the tropical forests of Vietnam.
Testing for recent bottleneck events for each population
Allele numbers ranged from 4 (VD51 and VD81) to 9
using Bottleneck v.1.2 [38] was applied with the stepwise
(VD08), with an average of 6.1 (Table 2). Among these,
mutation model (SMM) and two-phase model (TPM), and
35 alleles were private. Loci VD08 and VD49 had the
their significance was tested. The proportion of the SMM
greatest number of private alleles (4). One private allele
was set to 70% under default settings. The significance of
at 2 loci (VD31 and VD51), 3 private alleles at 3 loci (VD07,
these tests was evaluated by the one-tailed Wilcoxon
VD75, and VD108), and 2 private alleles at 8 remaining
signed-rank test.
loci were recorded.
Principal coordinate analysis (PCoA) was implemented
Genetic diversities for C. balansae populations are
based on G′ST values [39] using GenAlEx. Neighbor-joining
presented in Table 3. The average percentage of poly-
(NJ) tree was constructed genetic relationships among
morphic loci was 68.15%, ranging from 60% in the 4
populations based on a matrix of FST values using Pop-
populations of BV, SL, TQ, and NA to 86.67% in the TH
tree2 [40]. Bayesian analysis of population structure
population. The average value of alleles (Na) per popula-
was performed with Structure v.2.3.4 [41] to determine
tion was 1.9, ranging from 1.6 (SL) to 2.2 (YB and TH).
the optimal value of the genetic cluster (K). Setting the
The highest number of private alleles (Np = 8) was
admixture model with correlated allele frequency and
detected in the CP population, followed by three popula-
the ancestry models, 10 separate runs of the number of
tions of YB, BE, and QH with Np = 6, two populations of
clusters (K) in the dataset were performed from 1 to 10
MC and DH with Np = 4, the BV population (Np = 2), and
for each K value at 500,000 Markov Chain Monte Carlo
two populations (TC and SD) with Np = 1. The Ne value
(MCMC) repetitions and a 100,000 burn-in period. The
varied from 1.4 in 5 different populations (MC, DH, SD,
optimal value of K was detected using Structure Har-
BE, and QH) to 1.7 (YB population), with an average of 1.5
vester [42] based on the ΔK value by Evanno et al. [43].
alleles. The observed heterozygosity (Ho) and expected
A Mantel test [34] was applied to determine the rela-
heterozygosity (He) averaged 0.246 (0.143–0.339) and
tionships between genetic and geographic distances among
0.262 (0.198–0.338), respectively. The QH population
the C. balansae populations based on 999 permutations.
Table 3: Genetic diversity estimates nine populations of C. balansae
Population N Na Np Ne P% Ho He FIS p value of bottleneck
TPM SMM
BV 10 1.7 2 1.5 60 0.267 0.275 0.003 0.049 ns
MC 20 1.8 4 1.4 73.33 0.260 0.253 −0.011 ns ns
DH 15 1.7 4 1.4 66.67 0.219 0.213 −0.028** ns ns
TC 16 1.6 1 1.5 60 0.250 0.267 0.073 0.014 0.014
SD 19 1.7 1 1.4 60 0.193 0.228 0.101 ns ns
YB 12 2.2 6 1.7 73.33 0.339 0.338 −0.051 0.042 ns
BE 21 2.2 6 1.4 86.67 0.270 0.253 −0.076 ns ns
CP 21 1.9 8 1.7 73.33 0.270 0.334 0.212* 0.0003 0.0002
QH 27 1.9 6 1.4 60 0.143 0.198 0.179 ns ns
Mean 1.9 1.5 68.15 0.246 0.262 0.025
N: sample size; p: percentage of polymorphic loci; Na: alleles per locus; Np: total number of private alleles; Ne: effective alleles; Ho and He:
observed and expected heterozygosities; FIS: inbreeding coefficient; *p < 0.05, **p < 0.01.328 Bei Cui et al.
had the lowest genetic diversity (Ho = 0.143 and He = 0.198) The PhiPT value for the variation among populations was
and the YB population had the highest values (Ho = 0.339 significant (p < 0.001).
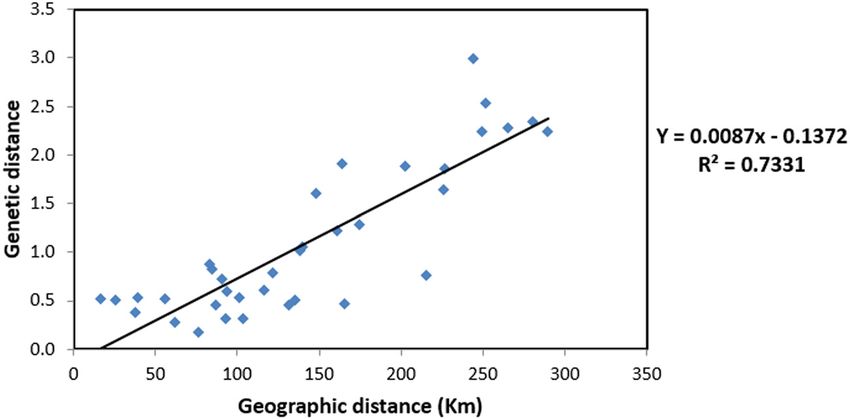
and He = 0.338). Five populations of BV, SD, TC, CP, and The Mantel test revealed a significantly high correla-
QH had positive FIS values, indicating an excess of tion between genetic distance and geographical distance
homozygosity and inbreeding in these populations. (R2 = 0.7331) (Figure 2), indicating high genetic differen-
The highest FIS value (0.212) was found in the CP popula- tiation among populations.
tion and was significant (p < 0.05). A significant deficit Genetic clusters were distinguished through the NJ
of heterozygosity was detected in two populations (TC analysis by using Poptree2 and the PCoA based on G′ST
and CP), based on the Bottleneck analysis under the values (Figure 3). Two different clusters were generated.
TPM and SMM (p < 0.05), and suggested evidence of a The first cluster included three populations (CP, BE, and
bottleneck. QH) in the central region, while the second included the
remaining six populations (DH, SD, BV, MC, YB, and TC)
in the northern region. An admixture model was per-
formed to evaluate the population structure of the 161
3.2 Population structure and Mantel test individuals of C. balansae based on the Bayesian analysis
using the Structure program. The results showed that
The average FIT value was 0.624, ranging from 0.06 the optimum number of genetic groups (K) was two,
(VD108) to 0.992 (VD25), indicating a deficiency of het- with the highest value of delta K (1,145.4) obtained from
erozygosity in the populations (Table 2). The genetic dif- Structure Harvester might an optimum number of genetic
ferentiation among populations (FST) varied from 0.285 clusters (Figure 4). Each individual in each population was
(VD108) to 0.992 (VD25) with an average of 0.601, indi- assigned to one of the two genetic clusters. The ancestry
cating high differentiation among all the populations and coefficients of each individual and each population are
reflecting low gene flow (Nm = 0.211). Our results of the shown in Figure 4. The red cluster represented all indivi-
AMOVA showed that the proportion of genetic variation duals from the populations of BV, MC, DH, TC, SD, and YB,
among the populations was higher (74%) than within while the green cluster represented CP and QH popula-
populations (Table 4). The PhiPT value and gene flow tions. All the individuals in the BE population were sepa-
among populations were 0.744 and 0.086, respectively. rated and closer to the red cluster than the green cluster.
Table 4: Analysis of molecular variance from nine populations of C. balansae
df* Sum of squares Variance components Proportion of variation (%) PhiPT value Nm
Among populations 8 1307.8 13.592 74 0.744** 0.086
Within populations 102 477.5 4.681 26
Total 110 1785.3 18.273
df* degree of freedom; **p < 0.001.
Figure 2: Mantel test of genetic distance and geographical distance of nine C. balansae populations.Genetic diversity and population structure of C. balansae in Vietnam 329
Figure 3: Principal Coordinates (PCoA) (a) and NJ tree for nine populations of C. balansae with bootstrap values above branches (b).
Figure 4: The Delta K distribution graph (a) and bar plot of admixture assignment for nine C. balansae populations to cluster (K = 2 and
highest ΔK value = 1145.4) based on Bayesian analysis (b).
4 Discussion and population size [47]. Species with widespread distri-
bution, large population size, longevity, and outcrosses
The genetic diversity of a species is often correlated with often maintain high genetic diversity compared to species
its history and ecology [44–46]. The genetic diversity is with a narrow distribution [48]. Here our results indi-
positively correlated with geographic distribution range cated that C. balansae has low genetic diversity330 Bei Cui et al. (Ho = 0.246 and He = 0.262) and high genetic differentia- from individuals of all the populations should be con- tion among populations (FST = 0.601), compared to other ducted so that random loss of genetic variability due to widespread species, such as C. camphora in South China loss of individual ecotypes should be avoided and move (Ho = 0.45 and He = 0.44) [29], Albanian olive (Ho = 0.75 towards new self-sustaining populations. The establish- and He = 0.60) [49 and Eugenia dysenterica (Ho = 0.545 ment of a new large population of C. balansae should and He = 0.62) [50]. Although this species has a wide- provide new alleles, which might improve its fitness under spread distribution and long life, the decline in genetic different environmental stresses to prevent the gradual diversity may be related to anthropogenic disturbances, reduction in the population of C. balansae. such as deforestation, habitat degradation, and over- exploitation of C. balansae [51]. Furthermore, in the cur- rent study, positive FIS values were observed in the five 5 Conclusion populations of BV, TC, SD, CP, and QH, while the negative FIS values were found in the remaining four populations These results confirmed that C. balansae had low genetic of MC, DH, YB, and BE. A heterozygosity deficit was diversity and high genetic differentiation among popula- determined by the Bottleneck analysis, which detected tions in the evergreen tropical forests. The nine popula- a reduction in the population size of C. balansae. Small tions of C. balansae were divided into two genetic groups populations might be the result of inbreeding, which related to the geographic distance. Our study will contri- can decrease genetic variation. However, the bottle- bute to understanding the population history of this spe- necks also show a rapid reduction in the population cies and the genetic relationships among the C. balansae sizes of TC and CP in recent decades. A high level of populations. genetic differentiation (FST = 0.601) was determined, and reflected low gene flow (Nm = 0.211) among C. balansae Acknolwedgement: We thank E. Sterling (New York) and populations. This is in contrast to previous reports on K. Koy (Berkeley) for providing the map. widespread species, such as Dalbergia cochinchinensis (FST = 0.23) [52] and Erythrophleum fordii Oliv (FST = 0.18) Funding information: This research was funded by the [53]. The dispersal of pollen and seeds plays an important Graduate University of Science and Technology under role in maintaining high genetic diversity within and low grant number GUST.STS.ĐT2019-ST01, Basis project of genetic differentiation among populations [54,55]. The Vietnam – Russia Tropical Center in 2019 and Project E large geographic distance between C. balansae popula- 1.2 by Vietnam – Russia Tropical Centre. tions may be responsible for high genetic differentiation. Moreover, habitat fragmentation can increase the isola- Author contributions: Cui B, Vu DD, Vu DG and Tran VH tion between populations. Thus, these suggested the designed the study. Vu DD, Vu DG, Tran VH, Bui TTX, geographic distance and habitat fragmentation as a bar- Pham MP, Nguyen MT and Nguyen VS collected samples rier to restrict gene flow between populations. Popula- in field works. Vu DD, Vu DG, Tran VH, Bui TTX, Pham tion structure and genetic relationships are important MP, Nguyen MT implemented the molecular experiments. for establishing the appropriate scale and subunits for Cui B, Vu DD, Vu DG, Tran VH, Nguyen MT, Rahman SU species conservation and management [56]. The study and Shah SNM analyzed data and wrote the original draft also identified two genetic groups using NJ, Structure, of manuscript. All authors have read and approved the and PCoA: one in northern Vietnam (DH, SD, BV, MC, final manuscript. YB, and TC populations), and the other in central Vietnam (BE, CP, and QH populations). The Mantel test shows Conflict of interest: Authors state no conflict of interest. that there are almost obvious geographical boundaries between the studied populations, and it indicated Data availability statement: The datasets generated during the effects of the geographic distance on the number and/or analyzed during the current study are available of migrants per generation inferred from the studied from the corresponding author on reasonable request. loci. This suggests that past human activities can have a significant impact on the present population structure and genetic diversity of C. balansae in Vietnam. Thus, the best References conservation strategy should be to establish an ex-situ conservation site for this species through collecting seeds, [1] MOST, VAST. Vietnam red data book, part II. Plants. Pub Sci germinating, and cultivating seedlings. Collecting seeds Tech; 2007. p. 289–90.
Genetic diversity and population structure of C. balansae in Vietnam 331
[2] Nguyen KD. Flora of Vietnam – Lauraceae. Sci Technics Publ (Berberidaceae) and their application to population genetic
House. 2010;20:22–234. stidues. Mol Breed. 2014;34:1733–46.
[3] Tai VA, Thin NN. Survey and inventory of threatened plant [20] Tam NM, Duy VD, Duc NM, Thanh TTV, Hien PD, Trang NTP,
species in Ha Giang province, Vietnam. J Biol. et al. Genetic variation and outcrossing rates of the
2014;36(3):323–9. endangered tropical species Dipterocarpus dyeri.
[4] Hai TN, Nghi DH, Phuong LD, Hoang TV. Study on the sylvi- J Tropical Sci. 2019;31(2):259–67.
culture characters of Cinnamomum balansae Lecomte at Ben [21] Tsuneki S, Mori K, Kaneko S, Isagi Y. Identification and
En National Park. J Forestry Sci Technol. 2016;6:176–85. characterization of eight microsatellite loci in Machilus
[5] Amos W, Harwood J. Factors affecting levels of genetic pseudokobu (Lauraceae), an endemic species of the Bonin
diversity in natural populations. Phil Trans R Soc Land B. Islands. Conserv Genet. 2009;10(6):2009–11.
1998;353:177–86. [22] Kameyama Y. Development of microsatellite markers for
[6] Keller LF, Waller DM. Inbreeding effects in wild population. Cinnamomum camphora (Lauraceae). Am J Bot. 2012;99:e1–3.
Treds Ecol Evol. 2002;11:424–9. [23] Chen LY, Cao YN, Yuan N, Nakamura K, Wang GM, Qiu YX.
[7] IUCN. The IUCN red list of threatened species. In: World Characterization of transcriptome and development of novel
Conservation Monitoring Centre. Cinnamomum balansae. EST-SSR markers based on next-generation sequencing
The IUCN Red List of Threatened Species; 1998. technology in Neolitsea sericea (Lauraceae) endemic to East
e.T35937A9969078. (accessed 8 May 2020). Asian land-bridge islands. Mol Breed. 2015;35:187.
[8] Lande R. Extinction ricks from anthropogenic, ecological [24] Martins EM, Lamont RW, Martinelli G, Medeiros FL, Quinet A,
and genetic factors. In: Landweber LA, Dobson AP, editors. Shapcott A. Genetic diversity and population genetic structure
Genetic and extinction of species. Princeton, NJ: Princeton in three threatened Ocotea species (Lauraceae) from Brazil’s
University; 1998. p. 1–22 atlantic rainforest and implications for their conservation.
[9] Vu DD, Bui BTT, Nguyen MT, Vu DG, Nguyen MD, Bui VT, et al. Conserv Genet. 2015;16:1–14.
Genetic diversity in two threatened species in Vietnam: [25] Zhu S, Ding Y, Yap Z, Qiu Y. De novo assembly and
Taxus chinensis and Taxus wallichiana. J Res. characterization of the floral transcriptome of an economically
2017;28(2):265–72. important tree species, Lindera glauca (Lauraceae), including
[10] Vu DD, Bui TTX, Nguyen MD, Shah ANM, Vu DG, Zhang Y, et al. the development of EST-SSR markers for population genetics.
Genetic diversity and conservation of two threatened Mol Biol Rep. 2016;43:1243–50.
dipterocarps (Dipterocarpaceae) in southeast Vietnam. [26] Chen CH, Zheng YJ, Liu SA, Zhong YD, Wu Y, Li J, et al.
J Res. 2019;30(5):1821–31. The complete chloroplast genome of Cinnamomum
[11] Nguyen MT, Vu DD, Dang PH, Bui TTX, Nguyen HPL, Nguyen MD. camphora and its comparison with related Lauraceae species.
Population genetic structure and demographic history of the Peer-Rev J. 2017;5:e3820.
dipterocarp species Anisoptera costata Korth revealed by [27] Kameyama Y, Furumichi J, Li J, Tseng YH. Natural genetic differ-
microsatellite analysis. Planta. 2021;253:66. entiation and human-mediated gene flow: the spatiotemporal
[12] Petit RJ, Mousadik EA, Pons O. Identifying populations for tendency observed in a long-lived Cinnamomum camphora
conservation on the basis of genetic markers. Conserv Biol. (Lauraceae) tree. Tree Genet Genomes. 2017;13:38.
1998;12:844–55. [28] Li Z, Zhong Y, Yu F, Xu M. Novel SSR marker development
[13] Frankham R, Ballou JD, Briscoe DA. Introduction to and genetic diversity analysis of Cinnamomum camphora
conservation genetics. Vol. 190. Cambridge, UK V: based on transcriptome sequencing. Plant Genet Resour.
Cambridge University Press; 2004. p. 385–6 2018;16(6):568–71.
[14] Lin TP, Cheng YP, Huang SG. Allozyme variation in four [29] Zhong Y, Yang A, Li Z, Zhang H, Liu L, Wu Z, et al. Genetic
geographic areas of Cinnamomum kanehirae. J Heredity. diversity and population genetic structure of Cinnamomum
1997;88:433–8. camphora in South China revealed by EST-SSR Markers.
[15] Joy P, Maridass M. Inter species relationship of Cinnamomum Forests. 2019;10(11):1019.
species using RAPD marker analysis. Ethnobot Leafl. [30] Bolger AM, Lohse M, Usadel B. Trimmomatic: a flexible
2008;12:476–80. trimmer for Illumina sequence data. Bioinformatics.
[16] Abeysinghe PD, Samarajeewa NGCD, Li, G, Wijesinghe KGG. 2014;30(15):2114–20.
Preliminary investigation for the identification of Sri Lanka [31] Grabherr MG, Haas BJ, Yassour M, Levin JZ, Thompson DA,
Cinnamomum species using randomly amplified polymorphic Amit I, et al. Full-length transcriptome assembly from RNA-Seq
DNA (RAPD) and sequence related amplified polymorphic data without a reference genome. Nat Biotechnol.
(SRAP). J Natn Sci Found Sri Lanka. 2014;42(3):201–8. 2011;29(7):644.
[17] Kuo DC, Lin CC, Ho KC, Cheng YB, Hwang SY, Lin TP. [32] Pertea G, Huang X, Liang F, Antonescu V, Sultana R,
Two genetic divergence centers revealed by chloroplastic Karamycheva S, et al. TIGR Gene Indices clustering tools
DNA variation in populations of Cinnamomum kanehirae Hay. (TGICL): a software system for fast clustering of large EST
Conserv Genet. 2010;11:803–12. datasets. Bioinformatics. 2003;19(5):651–2.
[18] Varshney RK, Graner A, Sprrell ME. Genic microsatellite [33] Clarke KR, Gorley RN. Primer (Plymouth Routines in
markers in plants: features and applications. Multivariate Ecological Research) v5: User Manual. Tutorial.
Trends Biotechnol. 2005;23:48–55. PRIMER-E Ltd Plymouth. 2001. p. 91.
[19] Guo R, Hou XY, Fang CL, An JY, Wu J, Qiu YX. Characterization [34] Peakall R, Smouse PE. GenAlEx 6.5: genetic analysis in excel.
and cross-species transferability of EST-SSR markers Population genetic software for teaching and research an
developed from the transcriptome of Dysosma versipellis update. Bioinformatics. 2012;28:2537–9.332 Bei Cui et al.
[35] Goudet J. FSTAT, a program to estimate and test gene at different densities in the south-western Chihuahuan Desert.
diversities and fixation indices (version 2.9.3); 2001. Ann Bot. 2004;94:419–26.
http://www.unil.ch/izea/softwares/fstat.html. [48] Dick C, Hardy O, Jones FA, Petit R. Spatial scales of pollen
[36] Rousset F. Genepop’007: a complete re-implementation and seed-mediated gene flow in tropical rain forest trees.
genepop Softw Windows Linux. Mol Ecol Resour. Trop Plant Biol. 2008;1:20–33.
2008;8:103–6. doi: 10.1111/j.1471-8286.2007.01931.x [49] Dervishi A, Jakše J, Ismaili H, Javornik B, Štajner N.
[37] Excoffier L, Laval G, Schneider S. Arlequin v.3.0. An integrated Comparative assessment of genetic diversity in Albanian olive
software package for population genetics data analysis. (Olea europaea L.) using SSRs from anonymous and tran-
Evolut Bioinforma Online. 2005;1:47–50. scribed genomic regions. Tree Genet Genomes. 2018;14:53.
[38] Piry S, Luikart G, Cornnet JM. Bottleneck: a computer program [50] Boaventura-Novaes CRD, Novaes E, Mota EES, Telles MPC,
for detecting recent reductions in the effective population size Coelho ASG, Chaves LJ. Genetic drift and uniform selection
frequency data. J Heredity. 1999;90:502–3. shape evolution of most traits in Eugenia dysenterica DC.
[39] Hedrick PW. A standardized genetic differentiation measure. (Myrtaceae). Tree Genet Genomes. 2018;14:76.
Evolution. 2005;59(8):1633–8. [51] Vu DD, Bui TTX, Nguyen VS, Pham MP, Ta TTH, Nguyen V, et al.
[40] Takezaki N, Nei M, Tamura K. Software for constructing Evaluation of genetic diversity and a bottleneck of
population trees from allele frequency data and computing Cinnamomum balansae H. Lecomte populations in Phu Tho
other population statistics with Windows interface. province by microsatelite (SSR) markers. J Forestry Sci
Mol Evolution. 2010;27:747–52. Technol. 2021;2021(1):3–9. (Vietnamese, abstract by English).
[41] Pritchard JK, Stephens M, Donnelly P. Inference of population [52] Hartvig I, So T, Changtragoon S, Tran HT, Bouamanivong S,
structure using multilocus genotype data. Genetics. Theilade I, et al. Population genetic structure of the endemic
2000;155:945–59. rosewoods Dalbergia cochinchinensis and D. oliveri at
[42] Earl DA, Von-Honldt BM. Structure Harvester: a website and a regional scale reflects the Indochinese landscape
program for visualizing structure output and implementing the and life-history traits. Ecol Evol. 2018;8:530–45.
Evanno method. Conserv Genet Resour. 2012;4:359–61. [53] Tan J, Zhao ZG, Guo JJ, Wang CS, Zeng J. Genetic diversity
[43] Evanno G, Regnaut S, Goudet J. Detecting the number and population genetic structure of Erythrophleum fordii Oliv.,
of clusters of individuals using the software structure: an endangered rosewood species in South China. Forests.
a simulaton study. Mol Ecol. 2005;14:2611–20. 2018;9:636.
[44] Hamrick JL, Godt MJW. Effects of history traits on genetic [54] Fukue Y, Kado T, Lee SL, Ng KK, Muhammad N, Tsumura Y.
diversity in plant species. Phil Trans Roy Soc Lond B Biol Sci. Effects of flowering tree density on the mating system
1996;351:1683–5. and gene flow in Shorea leprosula (Dipterocarpaceae)
[45] Lammi A, Siikamaki P, Mustajarvi K. Genetic diversity, popu- in Peninsular Malaysia. J Plant Res. 2007;120:413–20.
lation size, and fitness in central and peripheral populations of [55] Chan HT. Reproductive biology of some Malaysian
a rare plant Lychnis viscaria. Conserv Biol. 1999;13:1069–78. dipterocarps II. Fruiting biology and seedling studies.
[46] White TL, Adams WT, Neale DB. Forest genetics. Boston, MA, Malay Forester. 1980;48:438–51.
USA: CABI Publshing; 2007. p. 149–86. [56] Ferriere R, Dieckmann U, Couvet D. Evolutionary conservation
[47] Ferrer M, Eguiarte L, Montana C. Genetic structure and biology. Cambridge, United Kingdom: Press Syndicate of the
outcrossing rates in Flourensia cernua (Asteraceae) growing University of Cambridge; 2004. p. 56.You can also read